


Abstract
3014
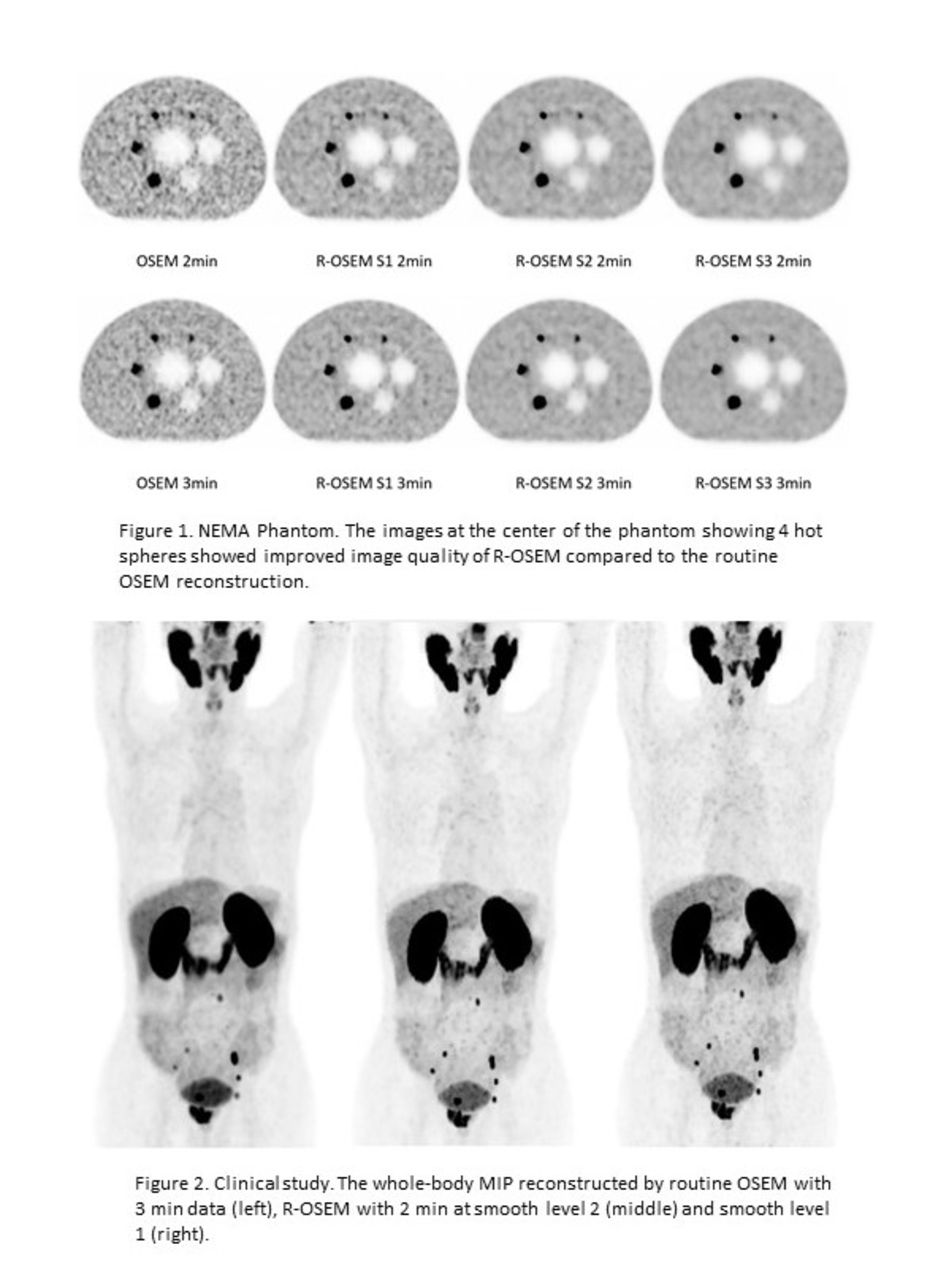
Introduction: A regularized ordered subset expectation maximization (R-OSEM) reconstruction algorithm of PET was developed to reduce the image noise as well as improve the contrast recovery. In the presented study, we evaluated the image quality of R-OSEM and optimized scan protocol for 68Ga PSMA PET.
Methods: A NEMA phantom with hot spheres filled with 4:1 target-to-background ratio of 68Ga was scanned on United Imaging uMI780 PET/CT scanner. The list-mode data was reconstructed to simulate 2 and 3 min/bed 68Ga PSMA PET acquisition described in the patient study. Eight patients with known prostate cancer were retrospectively enrolled. All patients received whole-body PET/CT on the same scanner as the phantom study with the following protocol: acquisition time 3 min/bed with 30% overlap from the eye to mid-thigh, injected dose 96-140 MBq 68Ga PSMA-11 according to body weight (2 MB/kg), uptake time 48-95 min. The list-mode data of the phantom and the patients were reconstructed with: standard OSEM reconstruction with TOF and PSF modeling using 3 min/bed data(Group O3); R-OSEM using 3 min/bed data with smooth levels of S1 (Group R3S1), S2 (R3S2), and S3 (R3S3); R-OSEM using 2 min/bed data with smooth levels of S1 (Group R2S1), S2 (R2S2), and S3 (R2S3). Therefore, 7 groups of the images were reconstructed into pixel size 3.125x3.125x2.89 mm volume for each patient and the phantom. The contrast recovery coefficient (CRC) and background variance (BV) were measured in the hot spheres in the phantom. In the patient study, SUVmax of the tumor was measured on a PSMA avid lesion. The standard deviation (SD) of the reference was measured in a homogeneous area of normal liver tissue. The SUVmax and SD of R-OSEM reconstructed groups were subtracted by standard OSEM reconstruction group to compared intra-patient changes and the difference was tested by Welch’s t-test.
Results: In the phantom study, CRC was 46%, 50%, 47%, 44%, 43%, 38% and 31% and BV was 13%, 11%, 8%, 7%, 12%, 9%, and 8% on 10 mm hot sphere in the phantom for O3, R3S1, R3S2, R3S3, R2S1, R2S2, and R2S3 group respectively. In the patient study, the tumor SUVmax was significantly higher in all R-OSEM groups than OSEM group (all p < 0.003), and SD was significantly lower in R-OSEM groups than OSEM group (all p < 0.003) except for R2S1 group (p = 0.2). The mean increase of SUVmax was 2.99, 2.92, 2.85, 3.02, 2.95, and 2.88, and the mean decrease of SD was 0.035, 0.113, 0.170, 0.030, 0.138, and 0.203 in R3S1, R3S2, R3S3, R2S1, R2S2, and R2S3 group respectively compared to O3 group.
Conclusions: The phantom results showed that the CRC was increased in R-OSEM group with lower smooth level compared to OSEM with the same acquisition time and BV was reduced in all R-OSEM groups with equal or short acquisition time. The patient study results showed that lesion SUV was increased while the background SD was reduced by R-OSEM. The image quality could be maintained when the acquisition time was reduced. Table 1. Difference of lesion SUVmax and reference SD in patients
Table 2. Phantom result

In this issue


Jump to section
Related Articles
Cited By...
- No citing articles found.