


Abstract
The purpose of this study was to assess the predictive and prognostic value of interim FDG PET (iPET) in evaluating early response to immunochemotherapy after 2 cycles (PET-2) in diffuse large B-cell lymphoma (DLBCL) by applying 2 different methods of interpretation: the Deauville visual 5-point scale (5-PS) and a change in SUV (ΔSUV) by semiquantitative evaluation. Methods: In total, 145 patients with newly diagnosed DLBCL underwent pretreatment PET and PET-2 assessment. PET-2 was classified according to both 5-PS and percentage ΔSUV. Receiver-operating-characteristic analysis was performed to compare the accuracy of the 2 methods for predicting progression-free survival. Survival estimates, based on each method separately and combined, were calculated for iPET-positive (iPET+) and iPET-negative (iPET−) groups and compared. Results: Both with 5-PS and with ΔSUV-based evaluations, significant differences were found between the progression-free survival of iPET− and iPET+ patient groups (P < 0.001). Visually, the best negative predictive value (NPV) and positive predictive value (PPV) occurred when iPET was defined as positive if the Deauville score was 4–5 (89% and 59%, respectively). Using the 66% ΔSUV cutoff reported previously, NPV and PPV were 80% and 76%, respectively. ΔSUV at the 48.9% cutoff, reported for the first time here, produced 100% specificity along with the highest sensitivity (24%). The 5-PS and a semiquantitative ΔSUV of less than 48.9% for each PET-2 gave the same PET-2 classification (positive or negative) in 70% (102/145) of all patients. This combined classification delivered NPV and PPV of 89% and 100%, respectively, and all iPET+ patients failed to achieve or remain in remission. Conclusion: In this large consistently treated and assessed series of DLBCL patients, iPET had good prognostic value interpreted either visually or semiquantitatively. We determined that the most effective ΔSUV cutoff was 48.9% and that when combined with 5-PS assessment, a positive PET-2 result was highly predictive of treatment failure.
In aggressive non-Hodgkin lymphoma, examinations using 18F-FDG PET or 18F-FDG PET/CT are routinely used to determine both pretreatment staging and the response to primary therapy (1). Several studies have investigated early response to therapy—as assessed by midtreatment, or interim PET (iPET)—as a promising method to predict treatment failure or long-term remission.
In diffuse large B-cell lymphoma (DLBCL), studies of the predictive value of iPET have been inconsistent, largely through lack of standardization of iPET classification criteria. The visual 5-point scale (Deauville) scoring system (5-PS) was devised in 2009 (2) and became the standard for PET/CT response assessment (3). An alternative system, based on the semiquantitative change in SUVs in response to treatment, has been put forward as being more objective than 5-PS (4). The predictive value of each method remains subject to debate (2,3,5).
In 2014, we reported the results of a prospective international cohort study, sponsored by the International Atomic Energy Agency (IAEA), to investigate the application of iPET to predict the final treatment outcome in a large cohort of DLBCL patients treated on a standard protocol (6). Although this study, based on the visual dichotomic evaluation corresponding to the Deauville criteria, confirmed this method’s predictive value, it was inadequate to guide treatment decisions.
We report here the predictive value of iPET, based on the same cohort, when evaluated by 5-PS, by semiquantitative assessment (SUV change [ΔSUV]), or by the combination of both methods.
MATERIALS AND METHODS
Study Population
For this substudy, 6 countries of the IAEA study (6) provided baseline PET (PET-0) and iPET images in digital format for analysis. The inclusion criteria for this substudy were as follows: newly diagnosed DLBCL, age above 15 y, informed consent obtained, R-CHOP (rituximab plus cyclophosphamide, doxorubicin, vincristine, and prednisone) or R-CHOP-like treatment, iPET after the second cycle of therapy (PET-2), digitally available full PET data, and a minimum of 24 mo of follow-up for patients alive and in first remission.
Treatment modification, including the use of radiotherapy, in response to the iPET findings was not allowed. Consolidation radiotherapy, if preplanned as part of primary treatment (e.g., to sites of bulk disease or to specific sites of extranodal disease), was permitted, as directed by local practice. If radiotherapy was given to sites with an incomplete response, as assessed by PET, it was classified as treatment failure.
Additional details of eligibility, treatment, and response assessment are included in the primary IAEA study report (6).
The IAEA study was approved by the respective ethical review board of each country, and all subjects signed an informed consent form.
18F-FDG PET and PET/CT Investigation
PET scans were performed on eligible patients on 3 occasions: before and within 4 wk of commencing treatment (PET-0), before the third cycle of chemotherapy (PET-2), and after completion of planned chemotherapy. All 3 were conducted on each patient using the same device. The PET scans were performed with dedicated PET or PET/CT cameras. PET was used in Brazil, and PET/CT was used in Chile, Hungary, Philippines, and Thailand. For PET-0 and PET-2, after the patient had been 6 h in a fasting state an average 6.4 ± 1.5 MBq/kg dose of 18F-FDG was administered, and the protocol stipulated 60–90 min of uptake time before whole-body images were acquired.
Scan Evaluation and Scoring
All scans were evaluated by the first author using Interview Fusion (Mediso Ltd.) software, masked to patient identifiers and disease outcome. Areas that were more intense than the local background were classified as pathologic, unless there were other explanations.
PET-2 scans were visually interpreted using 5-PS, in comparison with the PET-0 scans, as follows: score 1, no residual uptake; score 2, uptake no greater than in mediastinum; score 3, uptake greater than in mediastinum but no greater than in liver; score 4, uptake moderately greater than in liver; score 5, uptake markedly increased or progression of the lesions (2).
Using the volume-of-interest technique for semiquantitative analysis, we determined on PET-0 and PET-2 the SUVmax normalized to body weight for the most intense 18F-FDG uptake in sites of lymphoma. If PET-2 did not show elevated 18F-FDG uptake, the SUVmax was measured at the location of the most intense lesion before therapy. The percentage change in SUV between PET-0 and PET-2 scans was described by ∆SUV.
Statistical Evaluation
To determine the prognostic value of iPET, 3-y progression-free survival (PFS) was chosen as the endpoint. PFS was the interval from the beginning of treatment to treatment failure or the last known follow-up in remission. Treatment failure was defined as primary resistance to therapy, treatment escalation for progressive disease while on treatment, relapse, or lymphoma-related death of the patient.
We used receiver-operating-characteristic (ROC) analysis to compare the diagnostic effectiveness of both evaluation methods and to determine the optimal cutoffs for certain variables determining the limit for iPET positivity.
For each iPET evaluation method, Kaplan–Meier analysis was used to calculate PFS for both iPET-positive (iPET+) and iPET-negative (iPET−) groups. Values in the 2 groups were compared with the log-rank test. A P value less than 0.05 was considered statistically significant.
RESULTS
Patients and Clinical Outcomes
From the IAEA cohort of 286 patients, 145 patients were eligible for this analysis. The patients were from Brazil (49), Chile (30), Hungary (47), Philippines (4), and Thailand (15). The most frequent causes of exclusion from this substudy analysis were iPET performed after the third cycle or omission of rituximab. Six patients presenting with a mediastinal mass, classified by the local investigator as primary mediastinal lymphoma, were included. The characteristics of the cohort are in Table 1. Median PET-0 SUVmax was 18.7 (4.0–55.6), and PET-0 SUVmax was less than 10 in 20 patients.
Patient Characteristics
The median follow-up was 36.8 mo. The 104 (72%) patients who remained in continuous remission were followed up for a median of 39 mo (range, 24–66 mo). Forty-one (28%) progressed after a median interval of 8 mo (1.5–42 mo). Twenty-three patients died, 3 in first remission.
Timing of PET Investigation and Acquisition
18F-FDG uptake time was a median of 69 min (range, 40–187 min). The uptake-time differences for each pair of PET-0 and PET-2 was a median of 8 min (range, 0–76 min); in 16 patients (11%), the uptake-time difference was more than 30 min.
PET-2 scans were performed after the second treatment cycle, with a time from treatment of 6–55 d (minimum, ≥10 d in 97% [140/145] of patients). Among 5 patients with short (<10 d) treatment-to-scan intervals, there were 2 false-positive, 1 false-negative, and 2 true-negative results, based on 5-PS assessment. When these patients were assessed by ∆SUV evaluation, there was 1 false-negative and 4 true-negative results but no false-positives.
Defining Prognosis Based on iPET
During ROC analysis, we calculated the area under the curve for 5-PS and ∆SUV to be 0.82 (P < 0.0001; 95% confidence interval, 0.74–0,90) and 0.74 (P < 0.0001; 95% confidence interval, 0.63–0.84), respectively.
5-PS interpretation was significantly more accurate than ∆SUV evaluation (P = 0.045). The optimal cutoff to predict PFS for 5-PS was between a score of 3 and 4, with sensitivity of 75.6% and specificity of 78.8%. ∆SUV based on an optimal cutoff of 76.4% achieved sensitivity and specificity of 61.0% and 79.8%, respectively. Setting ∆SUV at 48.9% achieved 100% specificity, with sensitivity of 24.4% (Table 2).
Results of iPET Interpretation Using Different Definitions of iPET+
Survival Prediction Based on 5-PS
We compared survival based on different definitions of positivity: a score of more than 2, a score of more than 3, or a score of 5. Three-year PFS based on each definition is summarized in Table 2.
When positivity was defined as a score of more than 2, the overall accuracy and positive predictive value (PPV) were very low, at 59% and 40%, respectively, and 3-y survival of iPET+ patients was 60%. If positivity was defined as a score of more than 3, PPV increased to 59%, with no change in negative predictive value (NPV), and iPET+ 3-y PFS was 42%, significantly inferior to the PFS of iPET− patients, 90% (P < 0.001) (Fig. 1). The best overall accuracy of 82% was reached when only a score of 5 was regarded as positive, raising PPV to 86% and reducing NPV to 82%. But although this threshold was highly predictive of treatment failure (3-y PFS, 14%), it was less discriminatory for precise identification of survivors (82% if iPET−).

Kaplan–Meier PFS curves of 5-PS (iPET+ if 5-PS ≥ 4).
Survival Prediction Based on Semiquantitative Evaluation
The semiquantitative evaluation using a ∆SUV cutoff of 76.4% as optimum, as indicated by the current ROC analysis, did not lead to discrimination superior to evaluation based on 5-PS when iPET+ was defined as a score of more than 3 or a score of 5 (NPV, 84%; PPV, 54%) (Table 2). Applying the 66% ∆SUV cutoff, as reported previously (4), achieved a PPV of 76%. The 3-y PFS was 24% in iPET+ patients and 81% in iPET− patients (P < 0.001) (Table 2; Fig. 2).

Kaplan–Meier PFS curves of ΔSUV (iPET+ if ΔSUV < 66%).
The 48.9% ∆SUV cutoff achieved 100% specificity according to ROC analysis (PPV, 100%). This threshold identified 10 of 41 (24%) treatment failures. The 3-y PFS for a 48.9% ∆SUV cutoff for iPET− patients was 78%, which is similar to that defined by a 66% ∆SUV cutoff (81%) and a 76.4% ∆SUV cutoff (85%) (Table 2; Fig. 3). Importantly, all iPET+ patients defined by a 48.9% ∆SUV cutoff either failed to achieve remission or relapsed during short-term follow-up.

Kaplan–Meier PFS curves of ΔSUV (iPET+ if ΔSUV < 48.9%).
Survival Prediction Based on Both Visual and Semiquantitative Evaluation Combined
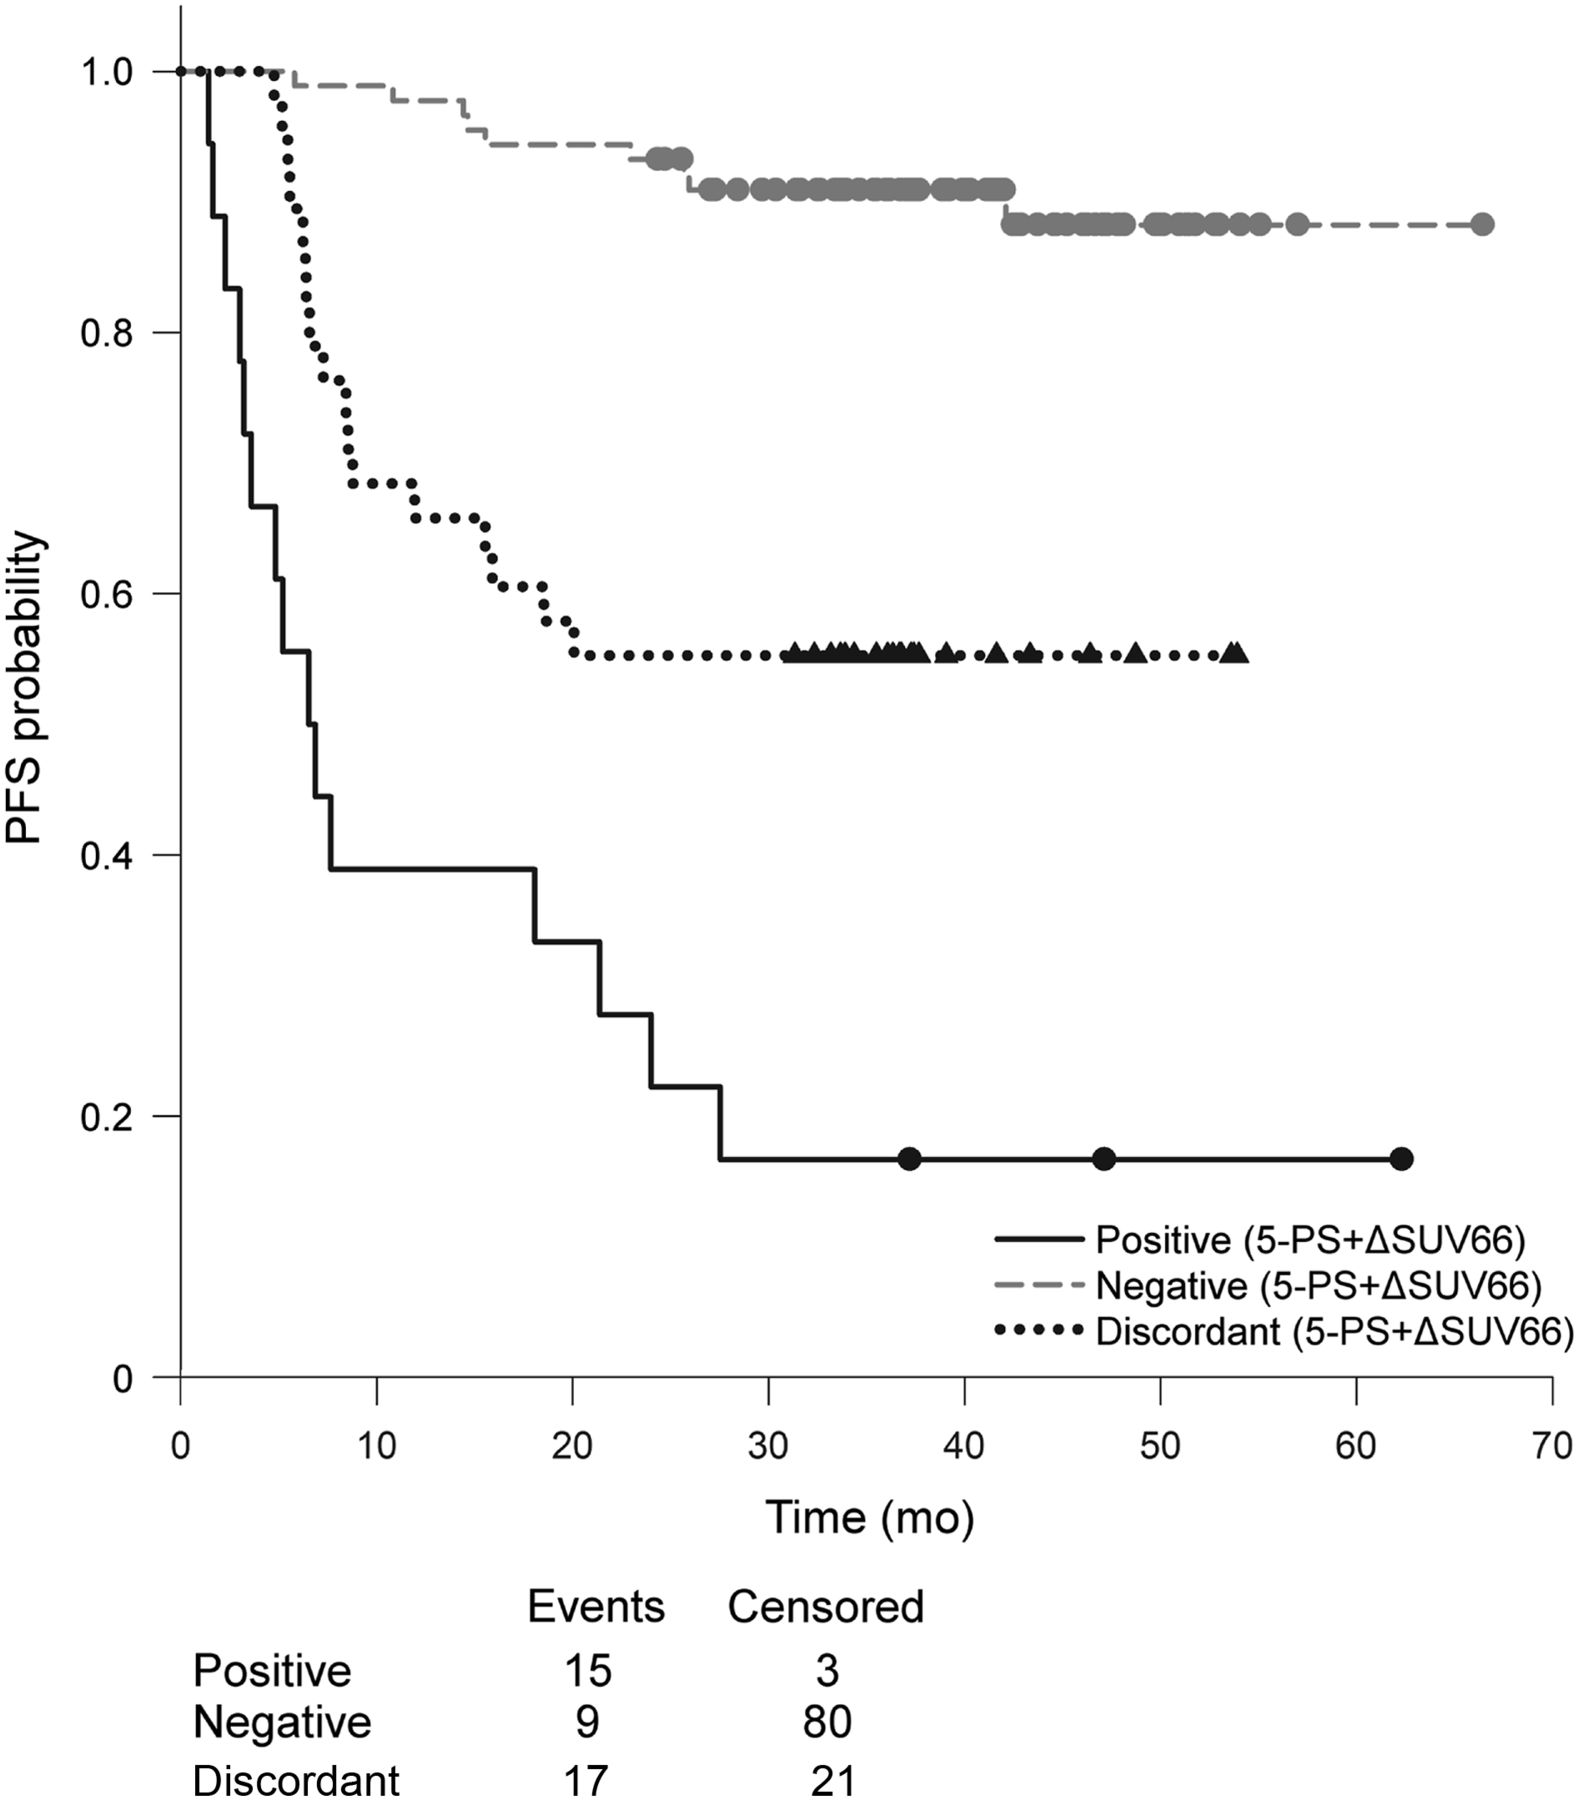
When visual and semiquantitative classifications were combined, and PET-2 was classified as positive by both a 5-PS of 4–5 and a ∆SUV of less than 66%, 107 of the total 145 patients (74%) had the same iPET classification (i.e., positive or negative) based on both techniques. In these cases, defined as concordantly positive or negative, iPET achieved 90% NPV and 83% PPV. For patients with concordant classifications, 3-y PFS was 91% for iPET− patients and 17% for iPET+ patients (Table 2; Fig. 4). The remaining 38 patients (26%), whose 5-PS and ∆SUV-based PET-2 classification differed, formed a new discordant group. Of these discordant patients, 17 (45%) had disease progression and 21 (55%) remained in remission (Fig. 4). Of 20 patients with a PET-0 SUV of less than 10, only 1 had a false (positive) result compared with 5-PS.

Kaplan–Meier PFS curves of combined evaluation (iPET+ if 5-PS ≥ 4 and ΔSUV < 66%).
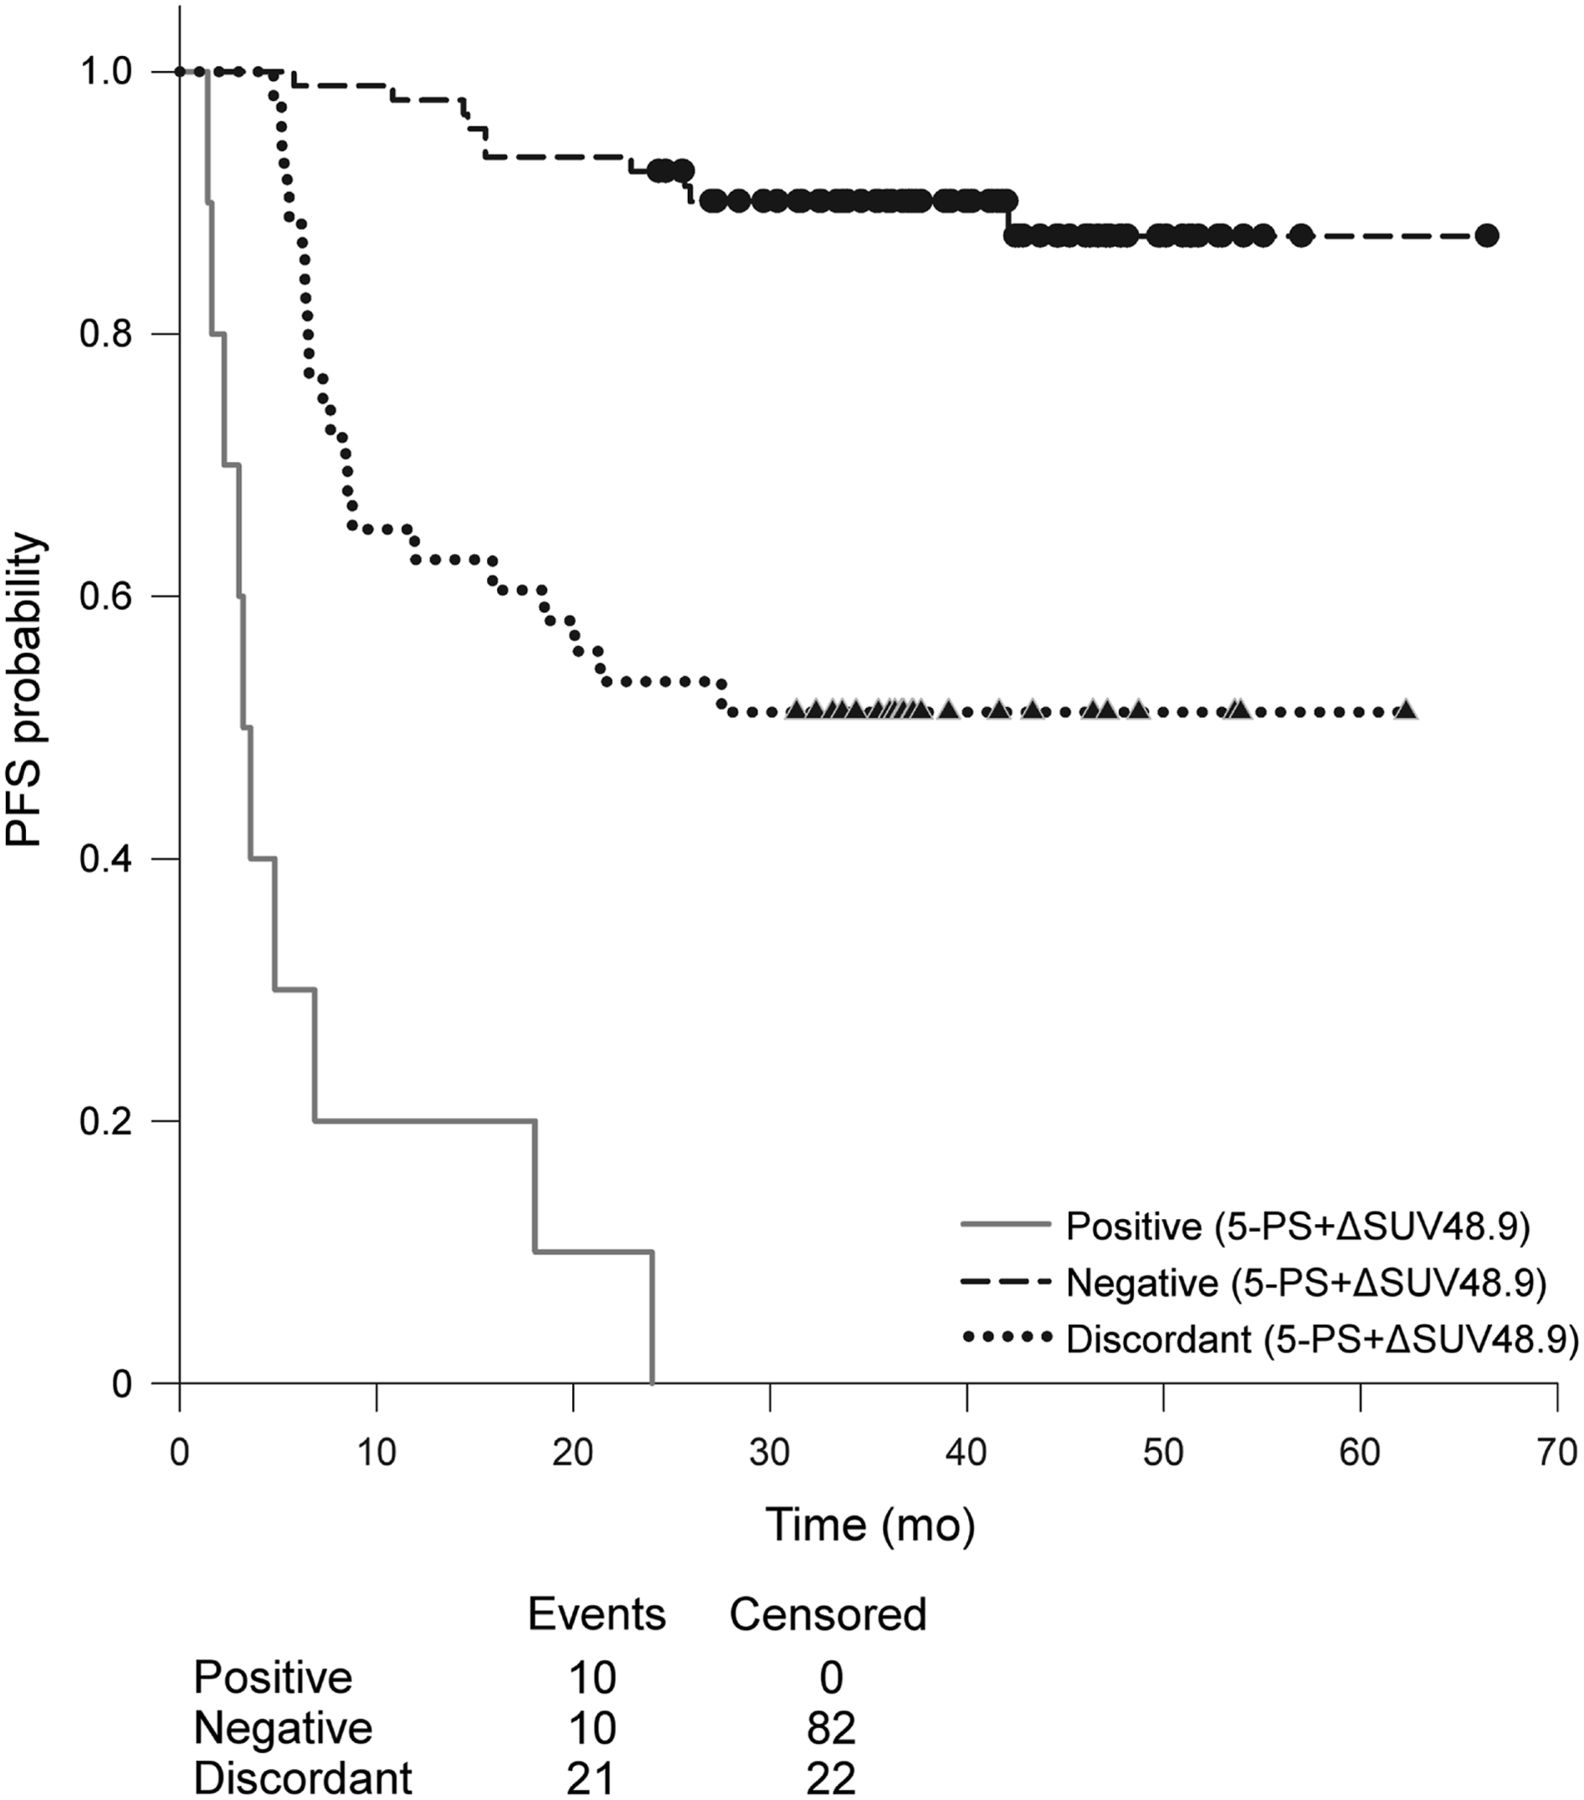
When the 5-PS classification was combined with ∆SUV using a cutoff of less than 48.9%, 102 patients (70%) had identical results and achieved 89% NPV and 100% PPV. The 3-y PFS for these concordant iPET− and iPET+ groups was 90% and 0%, respectively (Table 2; Fig. 5). For the patients in the discordant group, the 3-y PFS was 51% (Fig. 5).

Kaplan–Meier PFS curves of combined evaluation (iPET+ if 5-PS ≥ 4 and ΔSUV < 48.8%).
Although the combined approach using both 5-PS and a ∆SUV of less than 48.9%, or the use of a ∆SUV of less than 48.9% alone, was each consistently reliable for predicting treatment failure (3-y PFS, 0% vs. 0%), the combined assessment was better at predicting the survival of iPET− patients than was a ∆SUV of less than 48.9% alone (3-y PFS, 90% vs. 78%, respectively).
DISCUSSION
In the study reported here, we have investigated the prognostic significance of iPET evaluated according to the 5-PS system and the ∆SUV method.
The heterogeneity of data in previous studies originates partially from clinical and methodologic differences (5,7). To minimize the inconsistencies caused by heterogeneity, our study involved a large cohort of patients with aggressive B-cell non-Hodgkin lymphoma, 139 with DLBCL and 6 with primary mediastinal lymphoma. Each patient received CHOP or similar chemotherapy and, in all cases, rituximab. The midtreatment iPET assessment was conducted for all patients after the second treatment cycle.
A clinically useful method for early prediction of response to and final outcome from chemotherapy in DLBCL must be able to clearly separate those patients who will be cured by continuing with the standard protocol from those who will not achieve a lasting remission unless their treatment is intensified (8). The need for unequivocal identification of patients who are certain to fail with R-CHOP treatment alone has become more pressing now that incorporating autologous stem cell transplantation into the primary treatment of these patients has been demonstrated to improve their survival (9). At the same time, it is important to protect those with positive iPET findings, but who may be cured by continuing R-CHOP alone, from the toxicity of unnecessary treatment intensification.
Much effort has gone into defining a clinically relevant definition of early midtreatment iPET response using either visual assessment of scans (2,3,10–13) or, more recently, ∆SUV at sites of disease (4,10,11,13), with ongoing work linking this response evaluation by iPET to metabolic tumor volume (14).
Response assessment by PET after 2 or 3 cycles of standard chemotherapy separates patients into those with proportionately better or worse final outcomes but, until now, has been unable to unequivocally identify those who will fail to achieve lasting remission.
Numerous studies have shown that those with an early complete metabolic response (iPET−) have event-free survival in excess of 80% (5,7,13,15,16). In the full IAEA study cohort, we demonstrated that iPET− patients, based on 5-PS, who additionally had favorable baseline clinical indicators had 2-y event-free survival of 98% (6). Other published studies based on iPET assessment after 2 cycles in DLBCL treated by R-CHOP using either 5-PS or a 66% ∆SUV cutoff, as first reported by Lin (4), have reported the highest PPV of iPET for PFS or event-free survival: 78.9% (12) and 71.4% (11), respectively. However, if treatment is to be escalated to more intensive chemotherapy or autologous stem cell transplantation, there must be sufficient certainty of a poor outcome to justify the short- and long-term toxicity of second-line intensive therapies or experimental agents.
We report here a reanalysis of a large, uniformly treated cohort of 145 patients, with iPET assessment after 2 cycles of chemotherapy including rituximab, and follow-up for a minimum of 2 y. The analysis compares the sensitivity, specificity, and outcome prediction of 5-PS score, ∆SUV using different thresholds, and combination of 5-PS and ∆SUV. We have also validated the prognostic role of 5-PS and ∆SUV evaluation using the previously reported 66% cutoff (4) and that a ∆SUV strategy seems to discriminate better between good and poor outcomes than does 5-PS, in line with the results of, among others, a recent large, phase III PET-adapted trial (13).
On the basis of an ROC analysis, we found that a ∆SUV cutoff of 48.9% achieved the best specificity, 100% (PPV, 100%), and was highly predictive of outcome, without any false-positive cases. To our knowledge, this cutoff has been never evaluated by others. Importantly, patients whose iPET was classified as positive all relapsed or died within 2 y. Although the numbers are small, these 10 iPET+ patients could potentially have been informed of their poor prognosis and confidently offered early treatment escalation.
When the 48.9% ∆SUV cutoff was combined with 5-PS, NPV and PPV were 89.1% and 100%, respectively. This combined assessment, when iPET was classified as negative by both, accurately predicted a higher proportion of patients with PFS at 3 y (90%) than was possible using a 48.9% ∆SUV cutoff on its own (78% PFS). Those patients classified as iPET+ by both 5-PS and a 48.9% ∆SUV cutoff all relapsed or died (0% PFS). If confirmed in other cohorts, this result would be the evidence needed to change clinical practice.
Although the full IAEA study based on the dichotomic 5-PS evaluation confirmed this method’s predictive value, it was inadequate to guide treatment decisions (6). This new reanalysis, based on the same cohort, does not alter the conclusion of the first paper but does add to it by demonstrating that when iPET scans are classified by 5-PS and a 48.9% ΔSUV cutoff, treatment failure can be predicted with a high level of certainty.
We also examined combining a ∆SUVmax of less than 66% on iPET with 5-PS classification. Although this analysis was effective at predicting continued event-free survival, it was less accurate at predicting treatment failure. When both assessment methods classified iPET as positive, 17% (3/18) of iPET+ patients had lasting remissions with R-CHOP alone and were therefore inadequate to guide treatment.
A similar approach was used by Yang et al., who hypothesized that an iPET response based on a combined evaluation using several methodologic assessments can be an effective predictor, with high accuracy for prognosis and the ability to compensate for the limitations of each binary interpretation (17). For example, with a low baseline SUVmax (e.g., <10) or a high interim SUVmax (e.g., >5), ∆SUV evaluation may be less useful than 5-PS interpretation, as previously described (10,18); however, in our cohort, only in 1 of 20 patients with a low baseline SUVmax was ∆SUV evaluation less reliable.
The nature of this international study, though protocol-based, involved collection of clinical data in a real-world setting and thus resulted in some technical inconsistencies. Hence, a possible limitation of our study, in contrast to recent others (10–12,14), is that PET/CT technology was not exclusively applied, but 33.8% (49/145) of the investigations were performed with a standalone PET camera.
The timing of iPET is also crucial. In our study there were some inconsistencies, with iPET having been performed in 5 (3%) patients 6–9 d after the second treatment, in contrast to the recommended minimum of 10 d to avoid metabolic flare or stunning (19).
In SUV-based evaluation, physiologic and technical factors affecting SUV may lead to inaccuracy (20). Having a constant uptake time between injecting a radiopharmaceutical and starting the PET acquisition is highly important (21). The protocol of our IAEA study dictated maximally a 30-min difference between PET-0 and PET-2; however, the protocol was not complied with in 16 of 145 patients.
On the basis of our experience and the data available in the literature, compliance with a standard protocol causes most of the challenges, especially in high-volume centers (22). Nevertheless, we could conclude that the iPET assessment in DLBCL has outstanding prognostic value, not only in a strictly standardized research environment but also in routine real-world clinical practice.
CONCLUSION
Despite the technical inconsistencies, iPET examinations after 2 cycles of immunochemotherapy proved to have good prognostic value in this large DLBCL patient population and was highly predictive when both visual and semiquantitative evaluations were consistent with each other. We determined a 48.9% ΔSUV cutoff and a combined visual and semiquantitative evaluation was optimum. If validated in an independent cohort, the routine application of this method of iPET analysis would be a significant step forward to more reliable treatment decisions based on metabolic response, by unequivocally identifying those patients who will not be cured by continuing conventional therapy, thus indicating a clear need for an alternative treatment strategy.
DISCLOSURE
This study was funded and supported by the IAEA (Coordinated Research Project E1.50.20). No other potential conflict of interest relevant to this article was reported.
KEY POINTS
QUESTION: What is the predictive and prognostic value of PET-2 in evaluating early response to immunochemotherapy in DLBCL by applying 2 different methods of interpretation: 5-PS and ΔSUV by semiquantitative evaluation?
PERTINENT FINDINGS: In this cohort study of a large series of DLBCL patients, iPET had good prognostic value interpreted either visually or semiquantitatively. We determined that the most effective ΔSUV cutoff was 48.9% and that, when combined with 5-PS assessment, a positive PET-2 result was highly predictive of treatment failure.
IMPLICATIONS FOR PATIENT CARE: The routine application of this method of iPET analysis would be a significant step forward to more reliable treatment decisions based on metabolic response, by unequivocally identifying those patients who will not be cured by continuing conventional therapy, thus indicating a clear need for an alternative treatment strategy.
Acknowledgments
We thank all the researchers affiliated with the IAEA Lymphoma Study Group, listed elsewhere (6).
Preliminary results on a part of this study population were published previously in the Hungarian language (23).
Footnotes
Published online Nov. 22, 2019.
- © 2020 by the Society of Nuclear Medicine and Molecular Imaging.
REFERENCES
- Received for publication July 7, 2019.
- Accepted for publication November 6, 2019.


