


Abstract
The quantitative accuracy and image quality of multi-isotope SPECT is affected by various hardware-related perturbations. The present study evaluates the simultaneous acquisition of multiple isotopes using a multiplexed multi-pinhole SPECT system, assesses the extent of different error sources, and proposes experimental procedures for its objective characterization. Methods: Phantom measurements with single-, dual- and triple-isotope combinations of 99mTc, 111In, 123I, 177Lu, and 201Tl were performed with the NanoSPECT/CTPLUS to evaluate system energy resolution, count rate performance, sensitivity, collimator penetration, hardware versus object scatter, spectral crosstalk, spatial resolution, spatial registration accuracy, image uniformity, image noise, and image quality. Results: The intrinsic detector properties were suitable for the simultaneous acquisition of up to 3 isotopes with limitations for count rates exceeding 104 kcps and γ-energies lower than 75 keV. Spectral crosstalk between isotopes was more likely mediated by hardware than by source scatter and was strongly dependent on the isotope combination. Simultaneous multi-isotope acquisitions slightly degraded spatial resolution and image uniformity for spatially superimposed but not for spatially separated activity distributions while the background noise level was increased for all multi-isotope studies. For particular isotopes, collimator penetration and x-ray fluorescence contributed a significant portion of error. Conclusion: The NanoSPECT/CTPLUS enables the simultaneous acquisition of 3 radioisotopes with high quantitative accuracy and only little loss of image quality when the activity ratio is adapted to isotope-specific count rate sensitivities and when the system calibration is performed with phantoms of appropriate size.
SPECT is a powerful tool for noninvasive imaging of molecular processes in living organisms (1). A strength of SPECT is its capability to image multiple radioisotopes simultaneously based on spectral separation of their emitted γ- or x-ray energies. This not only improves economic efficiency and subject comfort but also provides complementary functional information. Bound to biologically acting molecules, multiple isotopes enable the simultaneous characterization of different physiologic and pathologic pathways and their mutual interactions down to the picomolar range (1). Particularly for rapidly changing pathophysiology, the temporal information cannot be assessed by consecutive studies. Therefore, dual-isotope imaging has been used successfully for comparative studies (2), competing studies (3), and dose–response assessment in therapeutic applications (4).
However, imaging multiple isotopes introduces several physical interferences that hamper image quality and quantification accuracy. Additional isotopes, for instance, inevitably increase the amount of radioactivity in the field of view (FOV). Moreover, each radioisotope has its own decay schema with different half-lives, decay modes, and emission energies. Specific attenuation, scatter, and γ-branching ratios lead to different detection efficiencies, and multi-isotope activity ratios therefore need to be selected with care.
The main limitation for multi-isotope imaging is the finite separability of energies, which causes crosstalk between isotope-specific energy windows (5). Spectral crosstalk can arise from partially overlapping photo peaks due to detector system imperfect energy resolution or as down-scatter from higher-energy emissions. Crosstalk can also arise from collimator effects such as x-ray fluorescence or collimator penetration. The related energy ambiguities, finally, degrade the quantitation accuracy, spatial resolution, and quality of the reconstructed SPECT images.
Crosstalk correction methods have been described for a variety of radioisotope combinations based on energy window subtraction or modeling (5). The former methods can fail for lower photon energies because of insufficient energy resolution. They are usually restricted to dual-isotope combinations, as commercial preclinical SPECT systems support only a few energy windows that can be acquired simultaneously. Modeling approaches, on the other hand, can be applied to an arbitrary number of emission energies but are computationally intensive. For this reason, models typically focus on source scatter and neglect scatter contribution from hardware components. However, in preclinical SPECT, hardware effects are the predominant source of error (6), whereas the imaging subjects are small and, therefore, crosstalk caused by subject scatter is small as well (7). Knowledge about the individual system response for each radioisotope and its hardware-mediated crosstalk effects turns out to be important for preclinical multi-isotope study design and protocol optimization.
The aim of the present study was to evaluate the multi-isotope capabilities of the NanoSPECT/CTPLUS (Mediso) with regard to intrinsic detector properties, quantification accuracy, and reconstructed image quality. Performance metrics for single-, dual-, and triple-isotope combinations of 99mTc, 111In, 123I, 177Lu, and 201Tl and their hardware-mediated crosstalk errors were determined. These data are used to assess the need for complex correction methods and, finally, to optimize the experimental design of future multi-isotope experiments.
MATERIALS AND METHODS
System Description
The NanoSPECT/CTPLUS is a dedicated SPECT/CT system designed for high-resolution, high-sensitivity small-animal imaging that can be configured with up to 4 detector heads. Each of its thallium-doped sodium iodide scintillation crystals (NaI(Tl)) has a size of 262 × 255 × 6.35 mm3 and is coupled to 33 position-sensitive 50.8 mm (2 in) diameter photomultiplier tubes that yield an intrinsic spatial resolution of 3.5 mm for 99mTc (8). Imaging collimation is achieved either by parallel-hole or by combined pyramid-pinhole collimators that ensure bore opening sizes of 250 mm or up to 80 mm, respectively. To increase the count rate sensitivity for pinhole acquisitions, the detectors feature multiplexed multi-pinhole collimation with 9–16 pinholes per detector. The pinhole projections are interlaced to optimize use of detector surface while minimizing multiplexing. The NanoSPECT/CTPLUS is able to acquire 4 energy windows simultaneously. It is delivered with the software HiSPECT (Scivis GmbH), an ordered-subset expectation maximization algorithm for image reconstruction.
Data Acquisition and Processing
In this study, 4 different 9-pinhole collimators were used: mouse high resolution (MH), mouse ultra-high resolution (MU), rat high resolution (RH), and rat ultra-high resolution (RU). Their geometric specifications are listed in Supplemental Table 1 (supplemental materials are available at http://jnm.snmjournals.org). For planar and SPECT scans, the image acquisition matrix was set to 256 × 256 pixels2 with a resolution of 1.0 × 1.0 mm3/pixel3. All SPECT images were acquired with 56 angular projections and 60 s duration using the energy windows shown in supplemental Table 2. Radioisotope emission spectra were sampled with equidistant but energy-range-adapted channel width from 0.2 to 0.7 keV/channel. Before the measurements, the SPECT system was calibrated according to the manufacturer’s instructions, which included calibrations for energy, linearity, uniformity, center of rotation, and collimator offset.
Ordered-subset expectation maximization reconstruction was set either to standard (0.3 × 0.3 × 0.3 mm3, 9 iterations, 35% gaussian smoothing, crosstalk correction) or to phantom (0.2 × 0.2 × 0.2 mm3, 24 iterations, 25% gaussian smoothing, crosstalk correction). The gaussian filter was applied to the projections before reconstruction and was given as a percentage of a reference resolution predefined by the vendor.
For region-of-interest analyses, the PMOD software package (version 3.7; PMOD Technologies) was used. Image processing and mathematic analyses were performed with Matlab 9.0 (MathWorks).
Energy Resolution
Measurements were performed with MH collimators using different isotopes that provide discrete γ-spectra: 67Ga, 68Ga, 99mTc, 111In, 123I, 131I, 153Sm, and 177Lu. Micro test tubes were filled with approximately 100 kBq/10 μL each and were centered to the FOV. Radioisotope γ-emission spectra were acquired to at least 100,000 counts. To estimate the absolute and relative energy resolutions  and
and  , the full width at half maximum (FWHM) was calculated fitting the data to the following gaussianlike equation:
Here,  denotes the count rate with maximal intensity
  at the γ-energy
  . Finally, the overall energy response of the detector was described using the following exponential equation:
The capability of the detector to resolve an incident photon of energy  is given by the fitting parameter λ, the best possible energy resolution
  and the worst
  .
.
Count Rate Performance
A 2-fold serial dilution of 99mTc with activities from 25 MBq to 0.2 kBq was prepared and centered in the FOV. Planar images were acquired for 30 s without collimators using 4 energy windows: 40 keV ± 50%, 120 keV ± 50%, 360 keV ± 50%, and 900 keV ± 40%. The sum of counts for each detector head was extracted. Considering linearity under low-count-rate conditions, the true count rate was linearly extrapolated from the 5 lowest measured count rates. According to the paralyzed dead-time model, the real incident count rate n was related to the measured count rate m and the paralyzed dead-time extension τ by
Assuming negligible background  and a decay constant
  for a 2-fold serial dilution, the dead time τ was determined substituting n by
  and rearranging the equation to
Plotting  against
  , the slope of the linear regression is given by
  and the intercept by
  . Dead time was determined by calculating the ratio of
  and the initial true count rate
  . To analyze the count pileup fraction, the count rate of the energy window 360 keV ± 50% was related to the total count rate, since it includes the double- and triple-piled 99mTc photo peaks at 281.0 and 421.5 keV.
System Sensitivity
For sensitivity measurements, micro test tubes were filled with approximately 10 MBq/10 μL of 99mTc, 111In, 123I, 177Lu, or 201Tl. The absolute activity in each sample was measured in a certified dose calibrator, ISOMED 2010 (MED Dresden GmbH). These point sources were centered in the FOV, and images were acquired in planar mode for 10 min using MH, MU, RH, and RU apertures. The sum of counts for each detector head was extracted and related to the total activity in the FOV. The experiment was repeated using 15%, 10%, and 5% energy windows.
Collimator Penetration
The fraction of collimator photon penetration was estimated for all apertures from the planar images acquired for sensitivity measurements (99mTc, 111In, 123I, 177Lu, and 201Tl). The pinhole projections of the point source on the planar images were segmented using an isocontour at 5% of the maximum intensity. This contour was enlarged by 1 FWHM of intrinsic spatial resolution (3.5 mm). The sum of counts outside the contour was assumed to be collimator penetration.
Hardware Scatter
Scatter, tungsten x-ray fluorescence, and photo-peak fractions as a function of phantom size were investigated for 99mTc to extrapolate the intrinsic hardware scatter fraction. A point source and cylindric phantoms with diameters of 1, 6, 13, 21, and 30 mm were filled with 20 MBq of 99mTc. γ-photon spectra were collected for 5 min using MH apertures. The spectral components were separated with regard to the following Compton scatter equation:
The energy of the scattered photon  depends on the incident photon energy
  , the scattering angle θ, and the electron rest mass
  . Compton scattered photons lead to a continuous signal with energies between
  and
and  . Hence, in relation to the total count rate
  , fractions for tungsten x-ray fluorescence
  , Compton scatter
  , and the photo peak
  were calculated using


With regard to an energy resolution  of 10% and tungsten’s centroid energies for
  and
and  x-ray transitions
  = 67.6 keV and
  = 58.8 keV, the lower and upper integral limits for 99mTc were set to


Hardware Crosstalk
Baseline multi-isotope quantification accuracy was investigated for all possible isotope combinations including 99mTc, 111In, 123I, 177Lu, and 201Tl (∼10 MBq/10 μL). To minimize phantom scatter, a point source of each isotope was centered in the FOV, and energy spectra were sampled for 5 min successively using the MH apertures. If photons of isotope A were incorrectly measured in energy window  of isotope B, the absolute spectral crosstalk factors
  for 1:1 mixtures were calculated by the following ratio:
The count rates  (spill-out) and
  (spill-in), both induced by isotope A, were given by integration of the spectral count rate histogram
  within the energy windows
  and
and  around its corresponding energy peak
  :
:
For an arbitrary multi-isotope experiment, the falsified count rate of isotope B can be corrected in the first approximation by scaling the planar images according to
Spatial Resolution and Registration
Glass capillary tubes with an inner diameter of 1 mm were filled with approximately 50 MBq/mL of either 99mTc, 111In, 123I, 177Lu, or 201Tl. Additional capillary tubes were filled with 1:1:1 mixtures of 99mTc/123I/201Tl, 99mTc/111In/201Tl, and 99mTc/111In/177Lu. Five capillary tubes of the same single-isotope probe were aligned circularly around the axial axis with a radial distance of 5 mm (Supplemental Fig. 1). SPECT was acquired using MH apertures. The acquisition was repeated for the multi-isotope mixtures aligned equally spaced between the single-isotope tubes (Supplemental Fig. 1). Single and multi-isotope measurements were repeated using the same setup, but centered within a 25-mm-diameter scatter phantom. All images were reconstructed using phantom parameters. FWHM and full width at tenth maximum (FWTM) were determined according to the National Electrical Manufacturers Association publication (9). For multiple-window spatial registration measurement, the line sources filled with 111In were acquired for each γ-emission photo peak at 23.6, 171.3, and 245.4 keV using a 20% energy window. The reconstructed images underwent rigid registration using only transaxial translations.
Uniformity and Noise
To estimate reconstructed image uniformity and noise, 10-mm-diameter cylindric phantoms were filled with either 99mTc, 111In, 123I, 177Lu, or 201Tl. Additionally, phantoms with 1:1:1 mixtures of 99mTc/123I/201Tl, 99mTc/111In/201Tl, and 99mTc/123I/177Lu were prepared. Three phantoms of the same single-isotope probe were aligned circularly around the axial axis with a radial distance of 10 mm (Supplemental Fig. 1). SPECT was acquired using MH apertures. The acquisitions were repeated for the multi-isotope mixtures equally spaced between the single-isotope phantoms (Supplemental Fig. 1). All images were reconstructed using phantom parameters. For the activity distribution A, the uniformity and noise coefficients  and
and  were calculated using

Here,  denotes the SD and
  the mean of the activity distribution.
Image Quality
The image quality was investigated for the isotope combinations 99mTc/123I/201Tl, 99mTc/111In/201Tl, and 99mTc/123I/177Lu. A micro Jaszczak phantom (d = 25 mm) with 6 fields of rods (d = 0.7−1.2 mm) was consecutively filled with each of the isotopes (∼5 MBq/mL) and finally with a mixture of them (ratio, 1:1:1). SPECT was acquired using MH apertures. Images were reconstructed using phantom parameters. The experiment was repeated for spatially separated activity distributions using a modified Jaszczak phantom (d = 28 mm) with 6 fields of rods (d = 1.5/5.0 mm) and 2 activity ratios (2.5 and 5 MBq/mL).
RESULTS
Energy Resolution
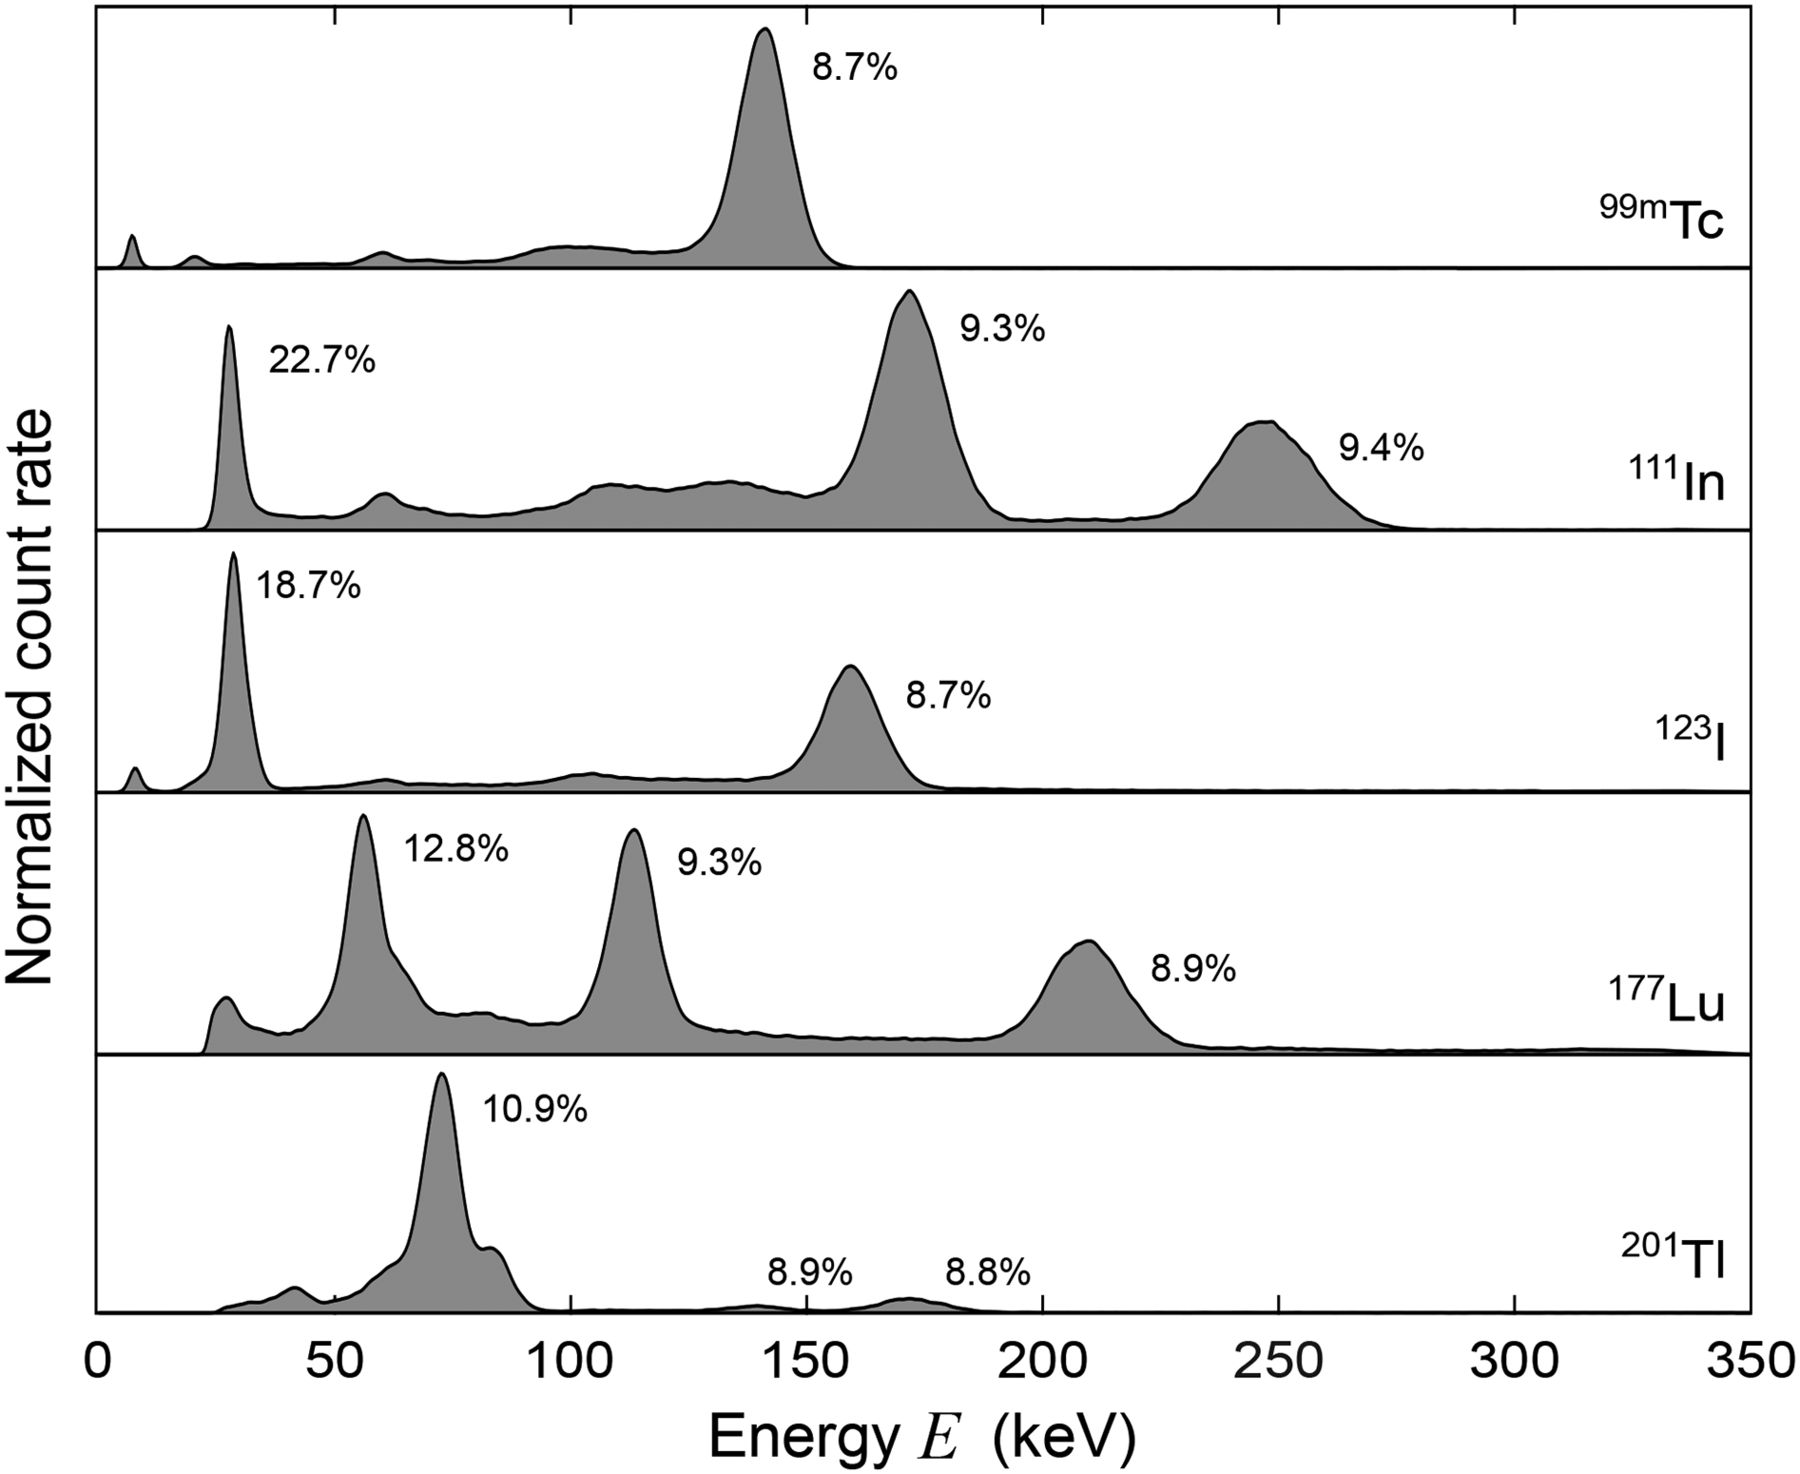
Energy spectra and photo-peak energy resolutions of radioisotopes used in this study are shown in Figure 1. The energy response function of the detector is shown in Figure 2. For photon energies greater than 75 keV, the energy resolution was below 10% FWHM and remained stable up to 500 keV. For lower photon energies, the resolution decreased exponentially up to 60% FWHM. The commonly used but simplified  model did not reflect the measured energy response function sufficiently (Fig. 2).

Spectra and photo peak energy resolutions of radioisotopes acquired on NanoSPECT/CTPLUS. Different radioisotopes provide different decay properties that need to be considered for multi-isotope protocol optimization: 99mTc (6.0 h, 100% IT); 111In (2.8 d, 100% ε); 123I (13.2 h, 100% ε); 177Lu (6.7 d; 78.6% β-, 21.4% IT); 201Tl (3.0 d, 100% ε). IT = isomeric transition; ε = electron capture.
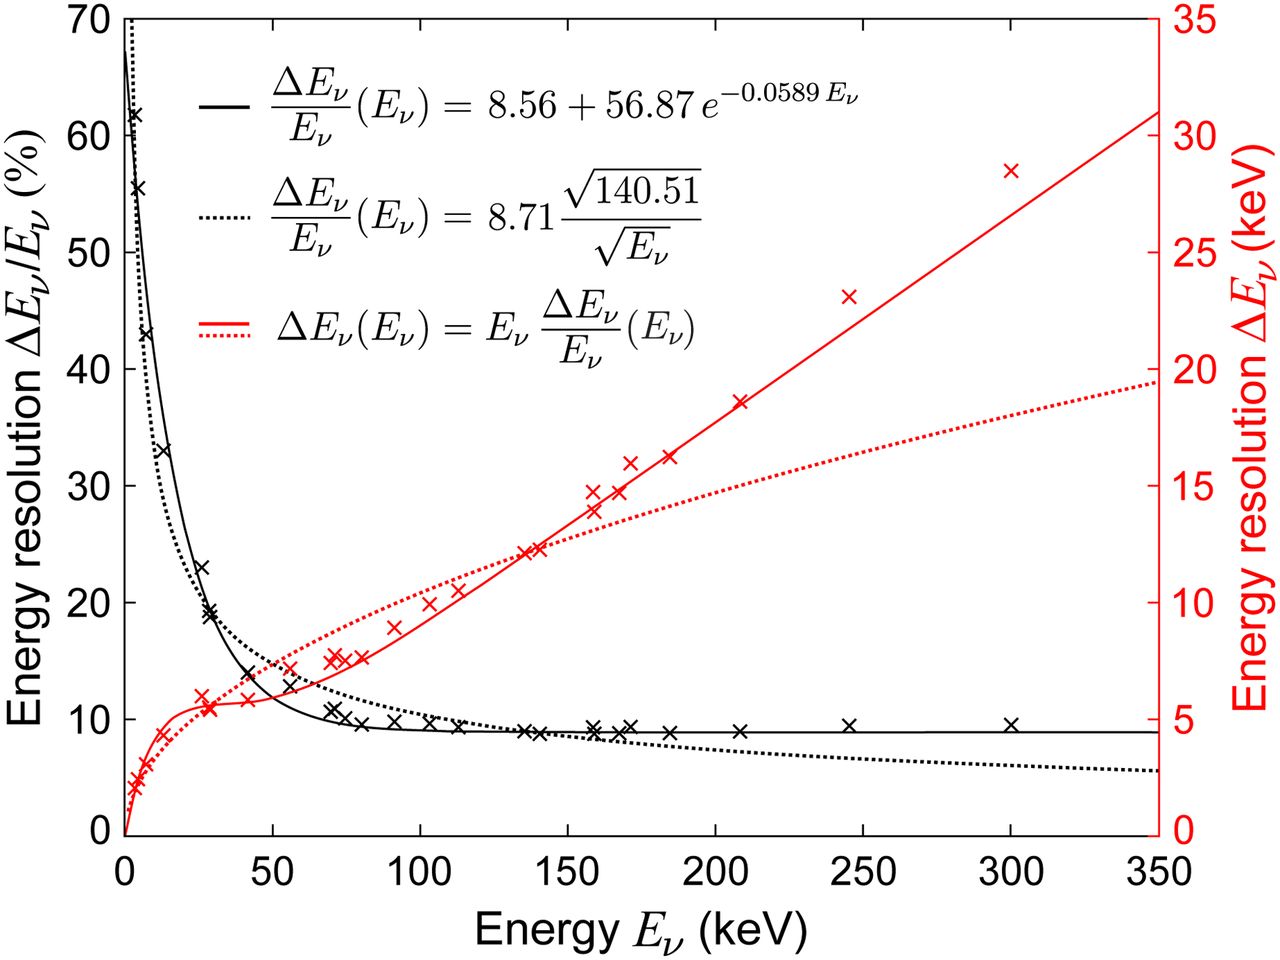
Relative (black) and absolute (red) energy resolution of NanoSPECT/CTPLUS detector expressed as exponential (solid lines) and inverse square root law (dotted lines). Energy resolution is suitable for single-, dual- and triple-isotope studies above 75 keV. For energies below, resolution is restricted by nonproportional light yield of scintillator NaI(Tl) and hampers separation of multiple isotopes.
Count Rate Performance
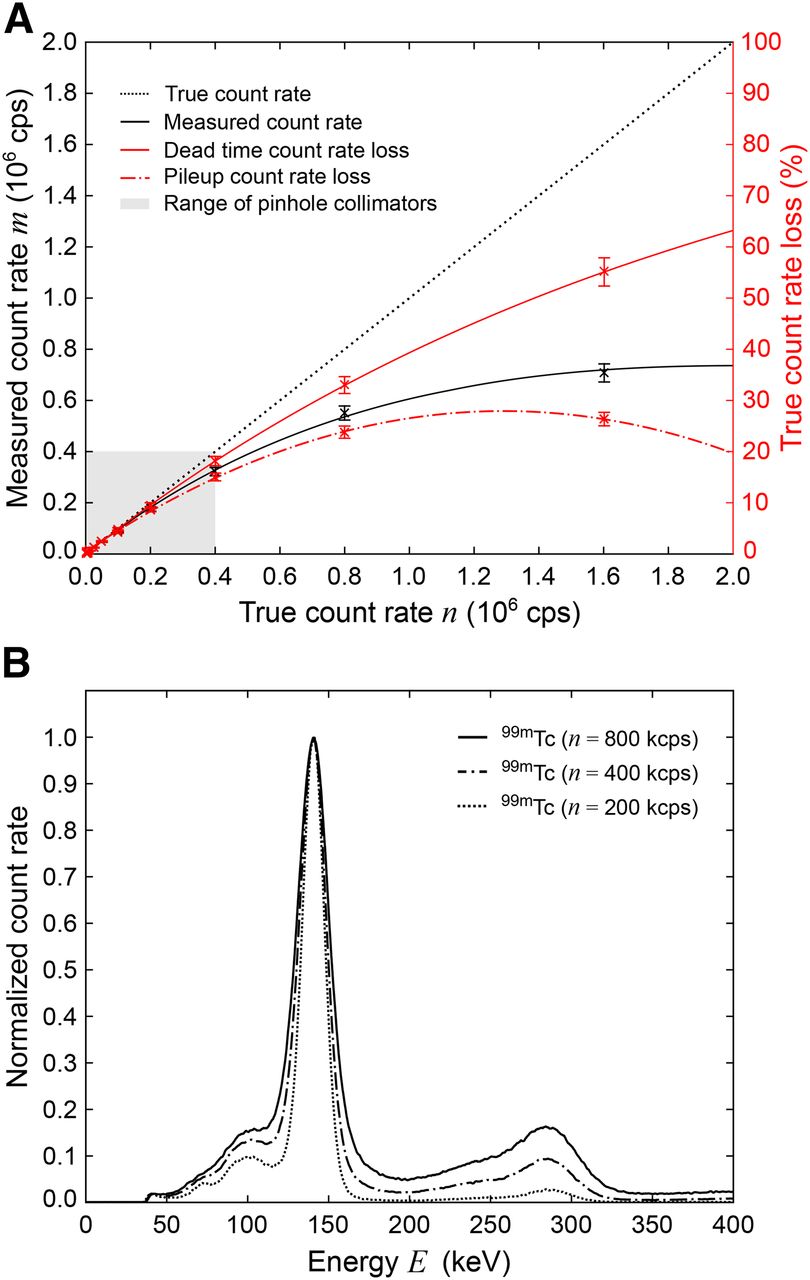
The count rate performance and relative count rate losses per NanoSPECT/CTPLUS detector head are plotted in Figure 3A. The dead time was found to be best described by the paralyzed dead-time model with a dead time of 492 ± 6 ns. Total count losses of 5%, 10%, and 20% were observed at true count rates of 104 ± 0.2, 214 ± 0.2, and 454 ± 0.2 kcps. Pileup fractions of 5%, 10%, and 20% were observed at true count rates of 112, 248, and 598 kcps. Exemplary pileup spectra for measured count rates of 200, 400, and 800 kcps are shown in Figure 3B.

Count rate performance (A) and pileup spectra (B) of NanoSPECT/CTPLUS detector. Count rate loss is low for single-, dual- and triple-isotope experiments, as sensitivity of pinhole collimation barely allow 400 kcps to be exceeded (gray area). For triple-isotope studies with high total activities, pileup may affect quantitative accuracy and image quality of high-energy radioisotopes.
System Sensitivity
Table 1 summarizes the system sensitivities per detector for all aperture sets and isotopes using 20% energy windows. Sensitivity was highest for the MH collimator, followed by RH, RU, and MU. Narrowing the energy window width from 20% to 15%, 10%, or 5% caused a mean sensitivity loss of 9.4%, 27.0%, and 57.6%, respectively (Table 2). This reduction was slightly higher for lower energy peaks, as for 177Lu (56.1 keV) and 201Tl (72.3 keV). For 111In and a 20% energy window, the 171.3 and 245.4 keV photo peaks contributed 59.7% and 40.3%, respectively, to the sensitivity. For 177Lu, 25.4%, 39.2%, and 35.4% of counts originated from 56.1, 112.9, and 208.4 keV photo peaks, respectively. For 201Tl, 88.2% and 11.8% originated from the 72.3 and 167.4 keV photo peaks, respectively. These observed count contribution fractions changed with energy window width because of the improved energy resolution at higher photo-peak energies. For assessment of isotope-specific dead-time behavior, the total point source sensitivities measured for the entire energy range are given in column “Total” in Table 2. The dark count rate for the full energy range was 54 ± 5 cps per detector head.
Count Rate Sensitivity per Detector Head Using 20% Energy Window
Count Rate Sensitivity per Detector Head Using MH Collimators
Collimator Penetration
Photon penetration fractions for different isotopes and collimators are shown in Figure 4. 99mTc showed low penetration fractions below 2.3% for all aperture sets, whereas 123I and 177Lu showed up to 13.2% photon penetration because of their branching ratios for high γ-emissions. Although 201Tl does not emit high-energy photons, penetration fractions were higher than for 111In, with up to 10% caused mainly by x-ray fluorescence of the collimator.
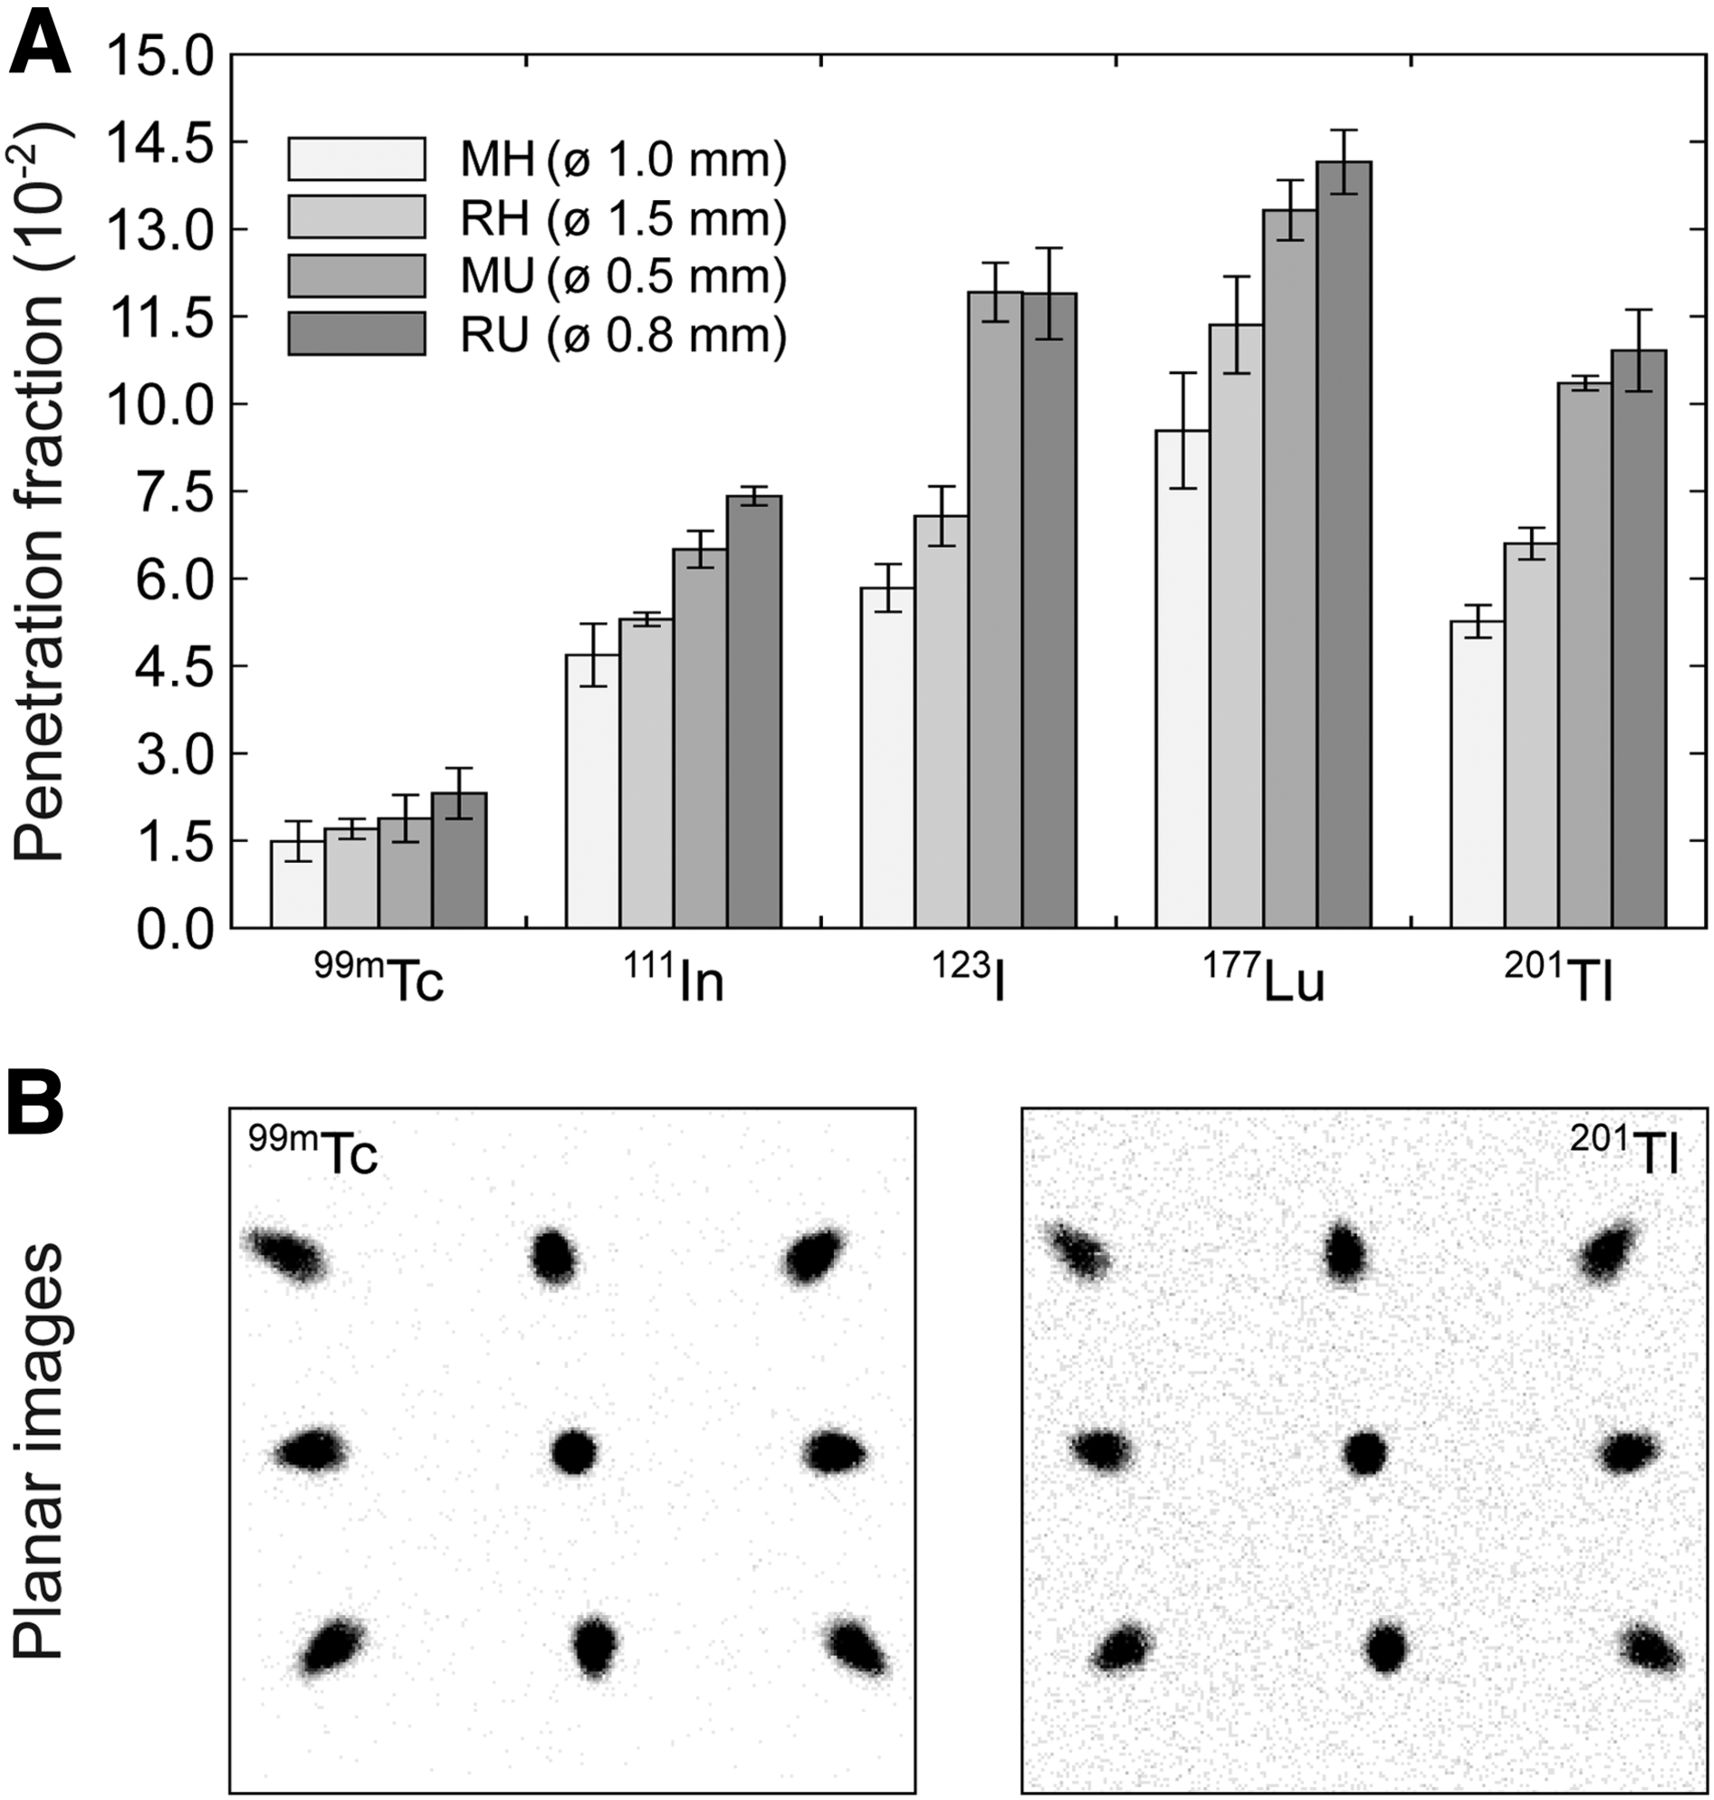
Photon penetration fractions for different collimators (A) and multi-pinhole projections of RU collimator (B). Given penetration fractions partly involve collimator scatter and, in case of 201Tl, tungsten x-ray fluorescence. Photon penetration increases background counts in planar projections and therefore degrades image quality and signal-to-noise ratio of both single- and multi-isotope reconstructions.
Hardware Scatter
Figure 5 shows 99mTc spectra and spectral component fractions for different phantom sizes. As expected, the fraction of Compton scatter increased with object size, associated with a reduction of the photo-peak fraction. Within the phantom diameter range evaluated, this dependency was found to be linear, with −0.56%/mm for the photo peak and 0.42%/mm for the Compton scatter fraction. The disproportionately rising maxima of the Compton spectrum at about 100 and 135 keV indicated a change in detected Compton scatter angles. With larger objects, the fraction of backward scattering that originates mainly from hardware components was superimposed by forward scattering from the phantom. Furthermore, the portion of characteristic x-rays from the shielding and the collimator increased slightly with phantom size. Overall, 16.9% scatter and 5.6% characteristic x-rays caused solely by the hardware were measured as baseline scatter for a 99mTc point source. Other radioisotopes showed higher overall scatter fractions including scatter, x-ray fluorescence, and collimator penetration, with 52.9% for 111In, 42.8% for 123I, 32.9% for 177Lu, and 28.7% for 201Tl.

Spectra (A) and spectral component fractions (B) for 99mTc phantoms of different sizes. Three energy windows were used to estimate fractions of tungsten x-ray fluorescence FT (I), Compton scatter FC (II), and full-energy peak FP (III). Scatter fraction increases only slightly for rodent-sized objects and therefore is caused mainly by hardware components. Disproportionately rising Compton maxima at 100 and 135 keV indicate change in detected scatter angles. Backward scatter from hardware is gradually overcome by forward scatter from measured object. Corresponding energy shift forces increase of tungsten x-ray fluorescence.
Hardware Crosstalk
Table 3 summarizes the absolute quantification errors for dual-isotope combinations without object source scatter. The table columns list the isotope emissions (spill-out) that affect the energy windows of the isotopes shown in the rows (spill-in). For an optimal isotope combination, quantification errors should be below 10%. Narrowing the 20% energy window to 10% reduced errors specifically for those isotope combinations whose photo peaks overlap because of the restricted energy resolution. The error of 123I caused by 99mTc spill-in, for instance, was reduced from 33.0% to 4.2%. Since the γ-branching ratio of 177Lu is low (Table 1), it was heavily affected by all other admixed isotopes. This was also observed for the 167.0 keV peak of 201Tl.
Quantification Errors for Multi-isotope Studies Using 1:1 Activity Ratios and MH Apertures
The overall error of an arbitrary multi-isotope combination can be estimated, summing all peaks and energy windows used. An experimental setup with 1:1:1 mixtures and energy windows 99mTc/140.5 keV/10%, 123I/159.0 keV/10%, 177Lu/112.9 keV/10%, and 177Lu/208.4 keV/20% demonstrated quantification errors: 99mTc, 10% (9.2% + 0.8%); 123I, 5.0% (4.2% + 0.8%); and 177Lu, 153.0% (34.6% + 46.0% + 15.0% + 57.4%).
For other isotope mixing ratios, error values scale linearly. A 1:2:3 mixture would lead to the following errors: 99mTc, 20.8% (2 × 9.2% + 3 × 0.8%); 123I, 3.3% (1/2 × 4.2% + 3/2 × 0.8%); and 177Lu, 85.5% (1/3 × 34.6% + 2/3 × 46.0% + 1/3 × 15.0% + 2/3 × 57.4%).
Spatial Resolution and Registration
The spatial resolution for line sources in air and within a scatter phantom are summarized in Table 4. FWHM was not significantly affected by multiple isotopes, whereas FWTM was increased for spatially superimposed activity distributions. By contrast, scatter increased both FWHM and FWTM for single- and multi-isotope measurements. The spatial registration of multiple energy windows showed a negligible displacement of maximally 0.15 mm.
Spatial Resolution With and Without Scatter Using MH Collimators
Uniformity and Noise
Single- and triple-isotope image reconstructions of the uniformity phantom for the most challenging isotope combination, 99mTc/111In/201Tl, are shown in Figure 6B. Numeric data results are listed in Table 5. The integral image uniformity was remarkably good for both single- and triple-isotope SPECT acquisitions. Multiple isotopes tended to degrade image uniformity only for superimposed activity distributions. Their line profiles showed slightly increased activity concentrations and enhanced edge profiles (Fig. 6C). Even though the image noise measure was similar for all single- and multi-isotope combinations, the line profiles indicated a slight increase in noise for multiple mixed isotopes. Background noise was significantly increased for both superimposed and adjacent multi-isotope distributions. These results were also found for other triple-isotope combinations evaluated (99mTc/123I/201Tl and 99mTc/123I/177Lu).

Small-animal Jaszczak phantom (A), uniformity phantom (B), and line profiles of single- and triple-isotope mixtures (C). Compared with single-isotope acquisitions, multiple superimposed isotopes degrade image quality slightly in terms of geometric distortion, background level, and overall noise. Multiple superimposed isotopes tend to degrade uniformity because of enhanced activity distributions at phantom edges.
Reconstructed Image Uniformity and Noise Using MH Collimators
Image Quality
Image reconstructions of a micro Jaszczak phantom for the most complex isotope combination, 99mTc/111In/201Tl, are shown in Figure 6A. Compared with single-isotope acquisitions, multiple superimposed isotopes degraded image quality slightly in terms of geometric distortion, background level, and overall noise. The line profiles (Fig. 6C) showed a more irregular pattern for triple- than for single-isotope acquisitions. The mean reconstructed activity concentration for multiple superimposed isotopes was slightly increased (<10%) but was overcompensated by partial-volume effects of small activity distributions. To a lesser extent, these results were also observed for other triple-isotope combinations without 111In (99mTc/123I/201Tl and 99mTc/123I/177Lu). In the case of adjacent activity distributions (Fig. 7), the image quality loss was negligible. Only a slight increase of background level and overall noise could be observed. Partial-volume effects contributed the main portion of error.
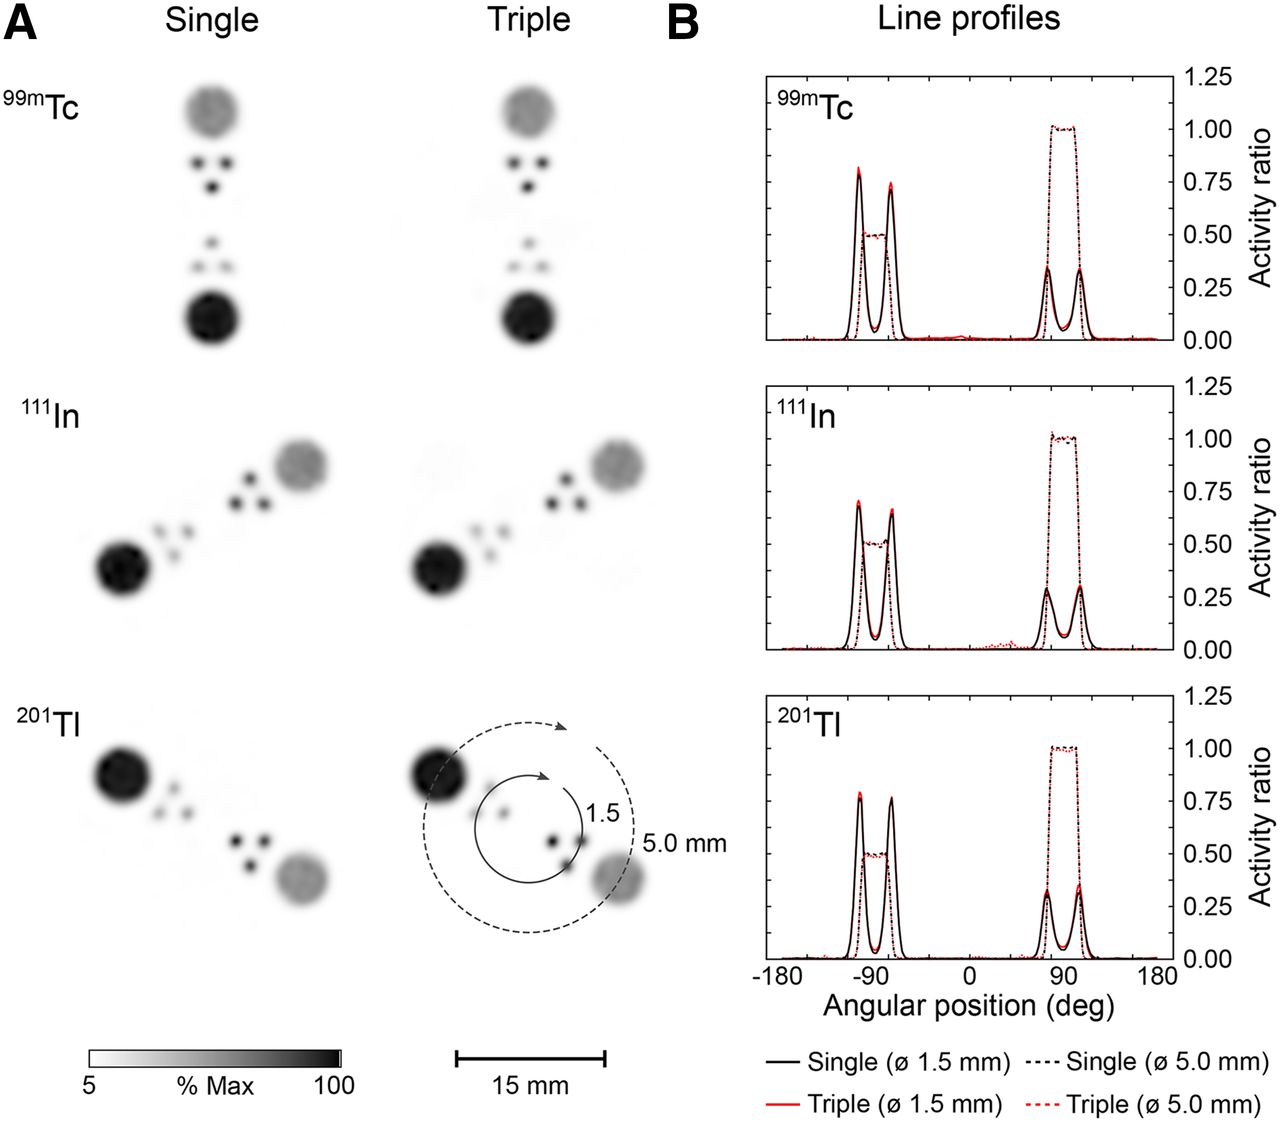
Modified small-animal Jaszczak phantom (A) and line profiles of spatially separated single- and multi-isotope mixtures (B). Multiple adjacent isotopes do not significantly affect image quality but slightly increase background noise.
DISCUSSION
The present study evaluated the multi-isotope capabilities of the NanoSPECT/CTPLUS. Although some performance characteristics of the NanoSPECT/CT have been reported (10,11), a comprehensive description on its improved successor, the NanoSPECT/CTPLUS, has not (to our knowledge) been published.
The NanoSPECT/CTPLUS showed an energy resolution of 8.7% FWHM for 99mTc (Fig. 2), which was in agreement with other photomultiplier tube–based 0.635 cm (0.25 in) NaI(Tl) detectors used for clinical and preclinical purposes (10). For photon energies below 75 keV, the energy resolution decreased exponentially because of the nonproportional light yield of the scintillator (12). The commonly used but simplified  model did not reflect the measured energy response sufficiently (Fig. 2). This model considers only the variation of photoelectrons released at the photocathode of the photomultiplier. Other parameters such as the variance of the photomultiplier gain or the associated electronics should be considered as well. Another reason might be the manifold characteristic x-ray energies below 100 keV, which are spin-off products of nuclear decay and disturb the monoenergetic measurement condition needed. However, the energy resolution was sufficient for single-isotope studies because self-scatter within the standard 20% energy window is negligible (7). For multiple radioisotopes, source scatter can lead to imperfect separation of close γ-lines as shown in the results obtained for 99mTc/123I (140.5 keV, 159.0 keV, Δ13%) and 123I/111In (159.0 keV/171.3 keV, Δ9%) (Fig. 1; Table 3). Two individual photo peaks acquired with 10% energy resolution, for instance, with energy distances of 10%, 15%, and 20% will overlap by around 21%, 7%, and 2%, respectively. For isotope combinations with low energies such as 111In/123I (23.6 keV, 28.0 keV), this direct spectral crosstalk was increased because of the lower energy resolution. In general, crosstalk caused by the finite energy resolution can be reduced by narrowing the energy windows, but this also decreases valuable sensitivity (Table 2).
Compared with parallel-hole collimation, the sensitivity of pinhole collimators is reduced at the expense of spatial resolution (13). Therefore, the NanoSPECT/CTPLUS provides multi-pinhole apertures (8) resulting in good system sensitivity comparable to other preclinical scanners (Table 1) (10). For multi-energy isotopes such as 111In, the contribution fractions of each γ-energy changed with energy window width because of the improving energy resolution toward higher energies. For particular isotopes, the sensitivity was affected by collimator photon penetration. High-energy photons of 123I (529.0 keV) or 177Lu (319.0 keV, 413.7 kV, 418.5 keV), for instance, could not be fully absorbed in the collimators, were scattered, and contributed to background counts.
In addition to energy resolution and sensitivity, detector dead-time behavior is crucial for multi-isotope imaging. Compared with other NaI(Tl) SPECT systems, count rate performance for the NanoSPECT/CTPLUS was excellent (14). The total dead time of 492 ns per detector head (Fig. 3) corresponds to nearly twice the scintillation decay time of NaI(Tl) at room temperature (15). The portion of pileup counts was low over a wide activity range. For pinhole apertures and activity levels of up to 350 MBq of 99mTc, 215 MBq of 111In, 180 MBq of 123I, 1,225 MBq of 177Lu, or 200 MBq of 201Tl, count rate losses were below 5% and can be considered negligible. These radioactivity amounts are not likely to be exceeded for either single- or multi-isotope studies because the intravenous administration volume is restricted to 0.125 mL for mice (25 g) and 1.25 mL for rats (250 g) (16). Overall, dead time and sensitivity results obtained in this study allow the conclusion to be drawn that the count rate performance of the NanoSPECT/CTPLUS does not contribute significant errors to either single- or multi-isotope studies.
Although sensitivity, dead time, and energy resolution are constant detector properties, variable errors such as attenuation, scatter, and x-ray fluorescence depend on the geometry of both the photon source and the surrounding hardware. For 99mTc, the NanoSPECT/CTPLUS showed a high baseline photo-peak fraction of about 78% (Fig. 5). Thus, 22% of photo-peak loss is caused by hardware effects. Of this fraction, 17% was due to Compton scatter in the animal bed, collimators, shielding, and the detector itself. Scatter increased only by 6% for mouse-sized and 12% for rat-sized objects. The disproportionate rise in the Compton spectrum at about 100 and 135 keV (Fig. 5A) indicated an initially high fraction of backscatter photons caused by shielding and electronic parts behind the scintillator. With increasing phantom size, this proportion was gradually overcome by forward scatter. The related energy shift to a lower mean photon energy increased the probability for photoelectric absorption in the collimator, and therefore, the tungsten x-ray fraction increased slightly from 5% to 8% (Fig. 5B). To correct attenuation, scatter, and x-ray fluorescence for single-isotope studies, it has been shown that simple calibration procedures with phantoms of appropriate diameter result in sufficient accuracies within 10% even for rat-sized objects (11). For multiple isotopes, though, scatter and x-ray fluorescence additionally caused significant spectral crosstalk between radionuclides (Table 3).
The proportion of this spectral crosstalk strongly depends on the radioisotope combination used (Table 3). As discussed before, the finite energy resolution hampered the separation of radioisotopes with close γ-energies, for example, 123I/99mTc. In contrast, collimator x-ray fluorescence affected only particular isotopes in the range of 50–90 keV. 201Tl image data, for instance, were slightly altered by x-ray fluorescence of tungsten at 67.6 keV (kα) and 58.8 keV (kβ). Moreover, theranostic radioisotopes such as 177Lu are often challenging because they have low γ-branching ratios. They are prone to spectral crosstalk from other radioisotopes. They also emit electrons that generate a continuous spectrum of bremsstrahlung that intrude all isotopes with energies lower than the electron maximum kinetic energy (498.3 keV for 177Lu). However, in this study, the measured crosstalk factors for 1-to-1 isotope combinations remained low compared with clinical SPECT. To improve quantitative accuracy, the NanoSPECT/CTPLUS user guide proposes a first-order correction using crosstalk factors obtained with appropriate phantoms. It has been shown that quantitative accuracy was acceptable as long as the peak of the lower energy was predominant (17,18). However, the extent of crosstalk is a linear function of the radionuclide activity ratio (Eq. 16), and small deviations between calibration and experimental setup are amplified for varying ratios. Calibration factors also act globally and may not reflect local scatter variations.
To assess the image quality in multi-isotope experiments, spatially superimposed and adjacent activity distributions needed to be distinguished. Superimposed radioisotopes may interfere directly because spectral thresholding is the only mechanism for radioisotope separation. If activity distributions are spatially detached, they should be completely separable. However, a significant portion of spatial crosstalk can be introduced by multiplexed multi-pinhole collimation. Projections of several pinholes overlap and share detector surface to find a compromise between magnification and sensitivity. This provokes spatial ambiguities for single isotopes, which can be resolved with iterative reconstruction approaches (13). For multiple isotopes, double ambiguities are introduced, and SPECT systems need to tackle spatial and spectral uncertainties concurrently. To avoid multiplexing, single-pinhole collimators might be the best choice, if low count rate sensitivities are acceptable.
CONCLUSION
The intrinsic detector properties of the NanoSPECT/CTPLUS were suitable for the simultaneous acquisition of up to 3 isotopes, with limitations for count rates exceeding 104 kcps and energies lower than 75 keV. Spectral crosstalk between isotopes was more likely mediated by hardware than by source scatter and was strongly dependent on the isotope combination. Simultaneous multi-isotope acquisitions slightly degraded spatial resolution and image uniformity for spatially superimposed but not for spatially separated activity distributions while background noise level was increased for all multi-isotope studies. For particular isotopes, collimator penetration and x-ray fluorescence contributed a significant portion of error.
We conclude that the NanoSPECT/CTPLUS enables the simultaneous acquisition of 3 isotopes with high quantitative accuracy and only little loss of image quality when the activity ratio is adapted to isotope-specific count rate sensitivities and when the system calibration is performed with phantoms of appropriate size.
DISCLOSURE
This work was supported in part by the Technologiestiftung Berlin (TSB). Mathias Lukas is also employed by Siemens Healthcare GmbH. No other potential conflict of interest relevant to this article was reported.
KEY POINTS
QUESTION: What are the limits of multi-isotope imaging for the NanoSPECT/CTPLUS and to what extent do hardware-related perturbations affect image quality and quantitative accuracy?
PERTINENT FINDINGS: The NanoSPECT/CTPLUS enables the simultaneous acquisition of 3 isotopes with high quantitative accuracy and only little loss of image quality when the activity ratio is adapted to isotope-specific count rate sensitivities and when the system calibration is performed with phantoms of appropriate size.
IMPLICATIONS FOR PATIENT CARE: Preclinical multi-isotope SPECT reveals information about simultaneous pathophysiologic processes, increases economic efficiency of pharmaceutical drug development, and therefore accelerates the translation from bench to bedside.
Acknowledgments
We thank Janet Francis Eary (National Cancer Institute) for careful revision of the manuscript.
- © 2020 by the Society of Nuclear Medicine and Molecular Imaging.
REFERENCES
- Received for publication January 14, 2019.
- Accepted for publication June 12, 2019.


Jump to section
Related Articles
Cited By...
- No citing articles found.