


Abstract
361
Introduction: 18F-FDopa PET imaging of gliomas is routinely interpreted with standard uptake value (SUV) derived indices. This study aimed to determine the added-value of dynamic 18F-FDopa PET parameters for predicting the characterization of newly-diagnosed gliomas achieved with the World Health Organization (WHO) 2016 classification.
Methods: We retrospectively included 58 patients having undergone a 18F-FDopa PET for the initial diagnosis of a glioma staging according to the WHO-2016 classification (20 IDH-mutant and 11 IDH-wildtype astrocytomas, 16 IDH-mutant and 1p/19q co-deleted oligodendrogliomas, 10 IDH-wildtype and 1 IDH-mutant glioblastomas). Dynamic parameters, involving time-to-peak (TTP) values and curve slopes, were tested for the prediction of glioma types in addition to current static parameters -i.e. tumor-to-normal brain or tumor-to-striatum standardized uptake values (SUV) ratios and metabolic tumor volume (MTV).
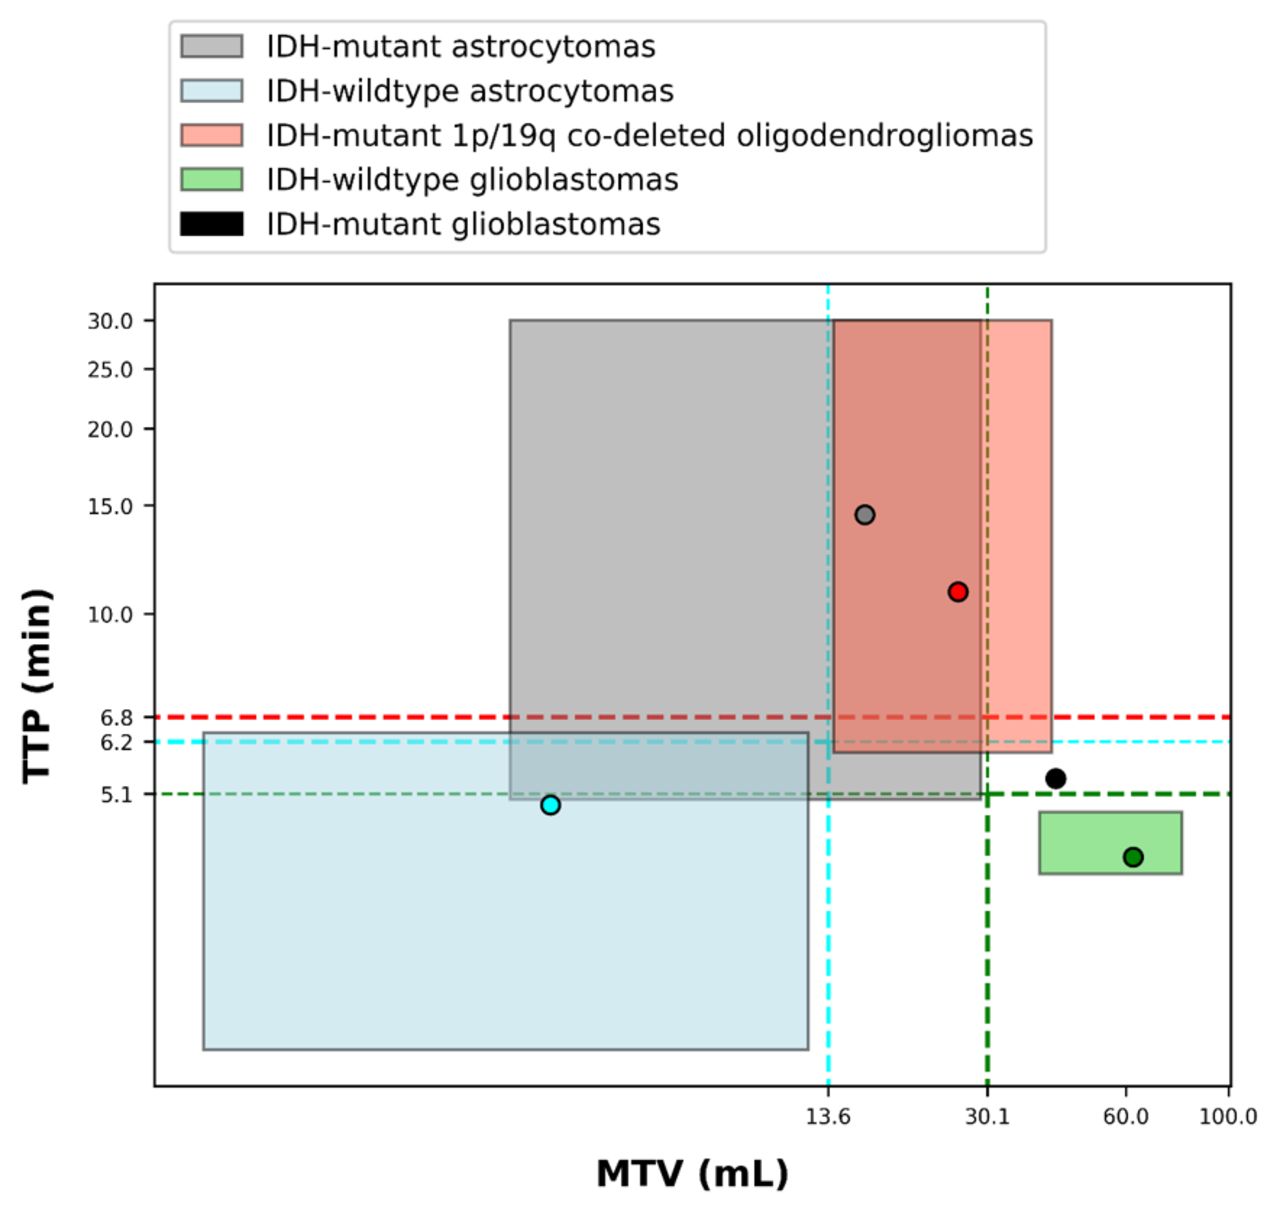
Results: The combined analysis of MTV and TTP provided the best prediction for IDH-wildtype glioblastomas (areas under curve (AUC) of 0.938 for the dual criterion of MTV ≥ 30.1 mL and TTP ≤ 5.1 min), as well as for IDH-wildtype astrocytomas (AUC of 0.907 for the dual criterion of MTV ≤ 13.6 mL and TTP ≤ 6.2 min), whereas TTP was the sole significant predictor of oligodendrogliomas (AUC of 0.679 for TTP ≥ 6.8min). Distribution of gliomas groups according to both MTV and TTP is available in Figure 1. Representative examples of each glioma subgroup are provided in Figure 2.
Conclusions: The prediction of the WHO 2016 classification of newly-diagnosed gliomas by 18F-FDopa PET is significantly enhanced when combining the analyses of dynamic with static PET parameters and especially, time-to-peak with the metabolic tumor volume. Figure 1. Distribution of median values (points) and interquartile ranges (colored rectangles) according to both metabolic tumor volume (MTV) and time-to-peak (TTP) expressed with natural logarithm, for IDH-wildtype (blue) and IDH-mutant (grey) astrocytomas, IDH-mutant and 1p/19q co-deleted oligodendrogliomas (red) and IDH-wildtype-glioblastomas (green). The single case of IDH-mutant glioblastomas is represented with a black point and the threshold diagnostic values provided by the ROC curves analyses are represented by dashed lines.Figure 2. Representative examples for each gliomas group of the metabolic tumor volume delineation on an axial slice of 18F-FDopa PET (left row) with the dynamic TBRmean curve (middle row) providing the time-to-peak delay-time (blue line) and the 10-to-30 min slope (dark blue line) and with for illustration, the same slice location recorded on contrast-enhanced T1-weighted MRI (right row).


In this issue


Jump to section
Related Articles
Cited By...
- No citing articles found.