


Abstract
The 11β-hydroxysteroid dehydrogenase type 1 (11β-HSD1) enzyme converts cortisone to cortisol and participates in the regulation of glucocorticoid levels in tissues. 11β-HSD1 is expressed in the liver, kidney, adipose tissue, placenta, and brain. 11β-HSD1 is a target for treatment of depression, anxiety, posttraumatic stress disorder, and also against age-related cognitive function and memory loss. In this study, we evaluated the radiotracer 11C-AS2471907 (3-(2-chlorophenyl)-4-(methyl-11C)-5-[2-[2,4,6-trifluorophenoxy]propan-2-yl]-4H-1,2,4-triazole) to image 11β-HSD1 availability in the human brain with PET. Methods: Fifteen subjects were included in the study. All subjects underwent one 2-h scan after a bolus administration of 11C-AS2471907. Two subjects underwent an additional scan after blockade with the selective and high-affinity 11β-HSD1 inhibitor ASP3662 to evaluate 11C-AS2471907 nondisplaceable distribution volume. Five subjects also underwent an additional scan to evaluate the within-day test–retest variability of 11C-AS2471907 volumes of distribution (VT). Results: 11C-AS2471907 time–activity curves were best fitted by the 2-tissue-compartment (2TC) model. 11C-AS2471907 exhibited a regionally varying pattern of uptake throughout the brain. The VT of 11C-AS2471907 ranged from 3.7 ± 1.5 mL/cm3 in the caudate nucleus to 14.5 ± 5.3 mL/cm3 in the occipital cortex, with intermediate values in the amygdala, white matter, cingulum, insula, frontal cortex, putamen, temporal and parietal cortices, cerebellum, and thalamus (from lowest to highest VT). From the blocking scans, nondisplaceable distribution volume was determined to be 0.16 ± 0.04 mL/cm3 for 11C-AS2471907. Thus, nearly all uptake was specific and the binding potential ranged from 22 in the caudate to 90 in the occipital cortex. Test–retest variability of 2TC VT values was less than 10% in most large cortical regions (14% in parietal cortex) and ranged from 14% (cerebellum) to 51% (amygdala) in other regions. The intraclass correlation coefficient of 2TC VT values ranged from 0.55 in the white matter to 0.98 in the cerebellum. Conclusion: 11C-AS2471907 has a high fraction of specific binding in vivo in humans and reasonable within-day reproducibility of binding parameters.
The hypothalamus, pituitary gland, and adrenal gland collectively form a complex circuit of direct influences and feedback interactions called the HPA axis. This is a major part of the neuroendocrine system and controls the response to stress and modulates a variety of processes, including digestion, mood, emotion, immune reaction, sexuality, and energy storage and consumption. Stress induces the activation of the HPA axis and release of glucocorticoids. Two enzymes are involved in the regulation of glucocorticoids and activation of glucocorticoid receptors: 11β-hydroxysteroid dehydrogenase-1 (11β-HSD1), a reductase in vivo that converts cortisone to cortisol and amplifies glucocorticoid action in a tissue-specific manner, and 11β-hydroxysteroid dehydrogenase-2 (11β-HSD2) that catalyzes the conversion of cortisol back to cortisone. 11β-HSD1 is expressed in the liver, kidney, adipose tissue, placenta, and brain, whereas 11β-HSD2 is primarily expressed in the kidney and functions mainly as a source of cortisone production. Together, glucocorticoid homeostasis is maintained by the HPA axis and activities of the 11β-HSD enzymes.
In the rodent brain, 11β-HSD1 activity is highest in the cerebellum, hippocampus, and neocortex, with levels about 10%–30% of those in kidney and liver (1–3). Activity in other regions of the brain are also detected, including the anterior pituitary, hypothalamus, amygdala, and brain stem (1,3,4). A similar expression pattern is found in the postmortem human brain (5). In general, the pattern of 11β-HSD1 messenger RNA expression in the brain is paralleled by those of immunohistochemistry and enzyme activity. Since 11β-HSD1 is expressed in key brain regions in the negative feedback action of glucocorticoids, this enzyme is a critical regulator of the HPA axis (6), and thus important in the pathophysiology of stress-related disorders such as depression, posttraumatic stress disorder, and addictive behaviors, where dysregulation of the HPA axis and glucocorticoids has been abundantly demonstrated (7–9). In addition to these disorders, accumulating evidence has pointed to the association of age-related cognitive impairment, elevated glucocorticoid levels, and increased 11β-HSD1 expression in the brain (10–12). Inhibition of 11β-HSD1 has been shown to improve memory (13) and to protect against the decline of cognitive function with age (5,14–16), or the even more catastrophic memory loss associated with Alzheimer disease (AD) (17). Importantly, recent evidence appears to also indicate a link between insulin resistance and AD (18). As a result, 11β-HSD1 inhibitors, originally targeted for type 2 diabetes, have been proposed as a target for drug development to treat cognitive impairment.
PET is a powerful imaging technology for the in vivo investigation of biologic targets. The availability of PET imaging agents for 11β-HSD1 will provide noninvasive biomarkers to interrogate the enzyme in vivo in human subjects and gain insights into its function and dysfunction in diseases. Further, PET imaging with 11β-HSD1 radiotracers can be used to assess target engagement and correlate target occupancy, dose exposure, and therapeutic response of 11β-HSD1 inhibitors currently in clinical trials, thus aiding the development of novel therapeutic agents. Merck was the first to disclose a PET radiotracer for imaging 11β-HSD1 in the brain, and ligand 11C-1 (Fig. 1) was reported in a conference abstract as having good brain uptake in rhesus monkeys and specific binding in vivo that could be blocked by MK-0916, a selective 11β-HSD1 inhibitor (19). However, imaging studies in humans with this radiotracer have not been reported. We have previously reported 11C-AS2471907 (2) (Fig. 1)—with a binding affinity of 2.2 nM for 11β-HSD1, greater than 10 μM for 11β-HSD2, and a minimal binding affinity for a wide range of protein targets—as a suitable PET radiotracer to image the 11β-HSD1 in the monkey brain. Here, we report the first PET imaging evaluation of 11C-AS2471907 in humans to assess its pharmacokinetic characteristics, select the optimal method for quantitative analysis, examine the test–retest reproducibility of kinetic and in vivo binding parameters, and define the levels of specific binding via blocking studies.

Chemical structures of radiotracers for 11β-HSD1.
MATERIALS AND METHODS
Study Plan and Population
The study was conducted in compliance with the ethical principles originating in or derived from the Declaration of Helsinki and in compliance with all International Conference on Harmonization Good Clinical Practice guidelines. In addition, all local regulatory requirements were followed, in particular, those affording greater protection to the safety of trial participants. These studies were performed under protocols approved by the Yale School of Medicine Human Investigation Committee, the Yale-New Haven Hospital Radiation Safety Committee, and the Yale University Radiation Safety Committee. Subjects were recruited by public advertisement. Written informed consent was obtained from all participants after full explanation of study procedures. Dosing of ASP3662 was conducted under the Astellas investigational new drug (IND 116,896).
All subjects were healthy males and had a comprehensive screening assessment that included a clinical interview, complete physical examination with medical history, routine blood tests, electrocardiogram, and urine toxicology. Individuals were excluded if they self-reported or evaluation revealed a diagnosis of a current or lifetime psychiatric disorder; a history of suicide attempts, current or past serious medical or neurologic illness (including a history of head injury with loss of consciousness); a history of substance abuse or dependence; nicotine use in the past 6 mo; prescription or nonprescription medication in the last 2 wk; or clinically significant laboratory or electrocardiogram results.
Fifteen subjects were included in the study (age, 38 ± 8 y [range, 28–51 y]; body weight, 84 ± 9.7 kg [range, 69–100 kg]). Two subjects underwent an additional scan after preblockade of 11β-HSD1 by ASP3662 (20) (30 mg, 26 ± 3 h before tracer injection), and 5 subjects underwent a second (retest) scan on the same day to assess test–retest variability (TRV). Test scans occurred between 10 am and 3 pm, and retest scans occurred 2.7–6.4 h later.
Radiochemistry
The reference standard AS2471907 and its N-desmethyl triazole precursor AS319448 were provided by Astellas Pharma Inc., Japan. 11CO2 was produced with the PETTrace cyclotron (GE Healthcare) through the 14N(p,α)11C nuclear reaction by bombarding a high-pressure nitrogen target containing 1% oxygen with a 16.8-MeV proton beam.
The radiotracer 11C-AS2471907 was prepared by N-11C-methylation of the precursor AS319448-00 (10 mg) with 11C-methyl triflate in anhydrous acetonitrile (0.2 mL) at 70°C for 5 min (Fig. 2) using the TRACERlab FXC Pro automated synthesis module (GE Healthcare). The crude reaction mixture was purified by high-performance liquid chromatography (HPLC) (YMC-pack Pro C18 column, 5 μm, 250 × 10 mm; YMC America Inc.). The column was eluted with a solvent mixture of 45% acetonitrile, 5% tetrahydrofuran, and 50% 0.04 M HCl (v/v, pH 1.4) at a flow rate of 4 mL/min and monitored by ultraviolet and radioactivity detectors. The desired radioactive product was collected, diluted with 50 mL of deionized water, and passed through a Waters C18 SepPak cartridge. The cartridge was rinsed with 10 mL of 0.001N HCl. The radioactive product was eluted off the SepPak with 1 mL of absolute ethanol (United States Pharmacopeia [USP]) followed by 3 mL of saline (USP) and collected into the FXC Pro product vial. Finally, the combined product solution was passed through a sterile 0.22-μm membrane filter for terminal sterilization and collected into a pyrogen-free collection vial precharged with 7 mL of saline (USP) and 40 μL of 4.2% sodium bicarbonate solution (USP) to afford a formulated solution ready for dispensing and administration.

Radiosynthesis of 11C-AS2471907.
Radiochemical purity and molar activity were determined by HPLC analysis of the final product solution (column: Phenomenex Luna C18(2), 5 μm, 4.6 × 250 mm; mobile phase: 52% of acetonitrile and 48% of 0.1 M aqueous ammonium formate solution containing 0.5% acetic acid, pH 4.2; flow rate: 2 mL/min; ultraviolet detector wavelength: 230 nm).
PET Data Acquisition
PET scans were obtained on the HRRT scanner (resolution, 2.5–3 mm full width at half maximum) for 120 min. During the scans, subjects wore an optical tracking tool to record head motion with an infrared detector (Vicra; NDI Systems). PET data were reconstructed with all corrections including motion (as recorded by the Vicra) using the ordered-subset expectation maximization algorithm (2 iterations, 30 subsets).To correct any residual motion due to possible slippage of the tracking tool on the subject’s head, a second step of motion correction was applied to the dynamic images, using a mutual-information algorithm (FSL-FLIRT, version 3.2, Analysis Group, FMRIB) with frame-by-frame registration to a summed image (0–10 min).
Arterial Blood Measurements
Arterial blood samples were drawn from a catheter inserted in the radial artery to measure the whole blood and plasma radioactivity curves, the metabolite-corrected plasma curve, and the plasma-free fraction as previously described (21,22), with modifications for the HPLC methods. In brief, plasma analysis of the radiotracer metabolism was performed from samples collected at 3, 8, 15, 30, 60, and 90 min. The automatic column-switching HPLC system was equipped with a capture column (19 × 4.6 mm) packed with Phenomenex SPE Strata-X sorbent and a Phenomenex Luna phenyl-hexyl analytic column (5 μm, 250 × 4.6 mm) with a mobile phase composed of 55% of acetonitrile and 45% of 50 mM ammonium acetate (v/v) at a flow rate of 1.55 mL/min. The retention time for 11C-AS2471907 was approximately 11 min.
Computation of Time–Activity Curves
Each subject underwent 1 MR scan as previously described (23) to help analyze the PET data. Then, 13 regions of interest (ROIs) were selected from the Anatomic Automatic Labeling (AAL) template for SPM2 (24) in the centrum semiovale, amygdala, caudate nucleus, putamen, thalamus, cerebellum, cingulate, insula, frontal cortex, occipital cortex, parietal cortex, and temporal cortex and were applied to the PET data to generate time–activity curves using each subject’s MR image to coregister the template and the PET data (23).
Kinetic Modeling
Volume of distribution (VT) (25) values were estimated using the 1- and 2-tissue-compartment (1TC and 2TC, respectively) models (26). Both models included a blood volume term, with a fitted vascular fraction. In preblock studies, the occupancy of the target enzyme and the nondisplaceable volume of distribution (VND) were computed using the occupancy plot (27). The variability of VT values was assessed by computing the intraclass correlation coefficient (ICC) (28) and the TRV, with TRV =  . The mean of TRV values (mTRV) across subjects is an index of the trend between the test and retest scans. The SD of TRV (sdTRV) is an index of the variability in VT estimates.
Unless otherwise specified, data are presented as mean ± SD across the 15 baseline scans (first scan for each subject).
RESULTS
The radiotracer 11C-AS2471907 was produced in radiochemical purity of 99.3% ± 0.5% (minimum, 98.4%, n = 22), with a molar activity of 190 ± 239 MBq/nmol (range, 44–1,210 MBq/nmol) at the end of synthesis.
The injected activity dose was 234 ± 114 MBq (range, 94–440 MBq) for 11C-AS2471907, with an administered mass of 2.5 ± 2.6 μg (range, 0.25–9.7 μg). There were no adverse or clinically detectable pharmacologic effects in any of the 15 subjects. No significant changes in vital signs, laboratory results, or electrocardiograms were observed.
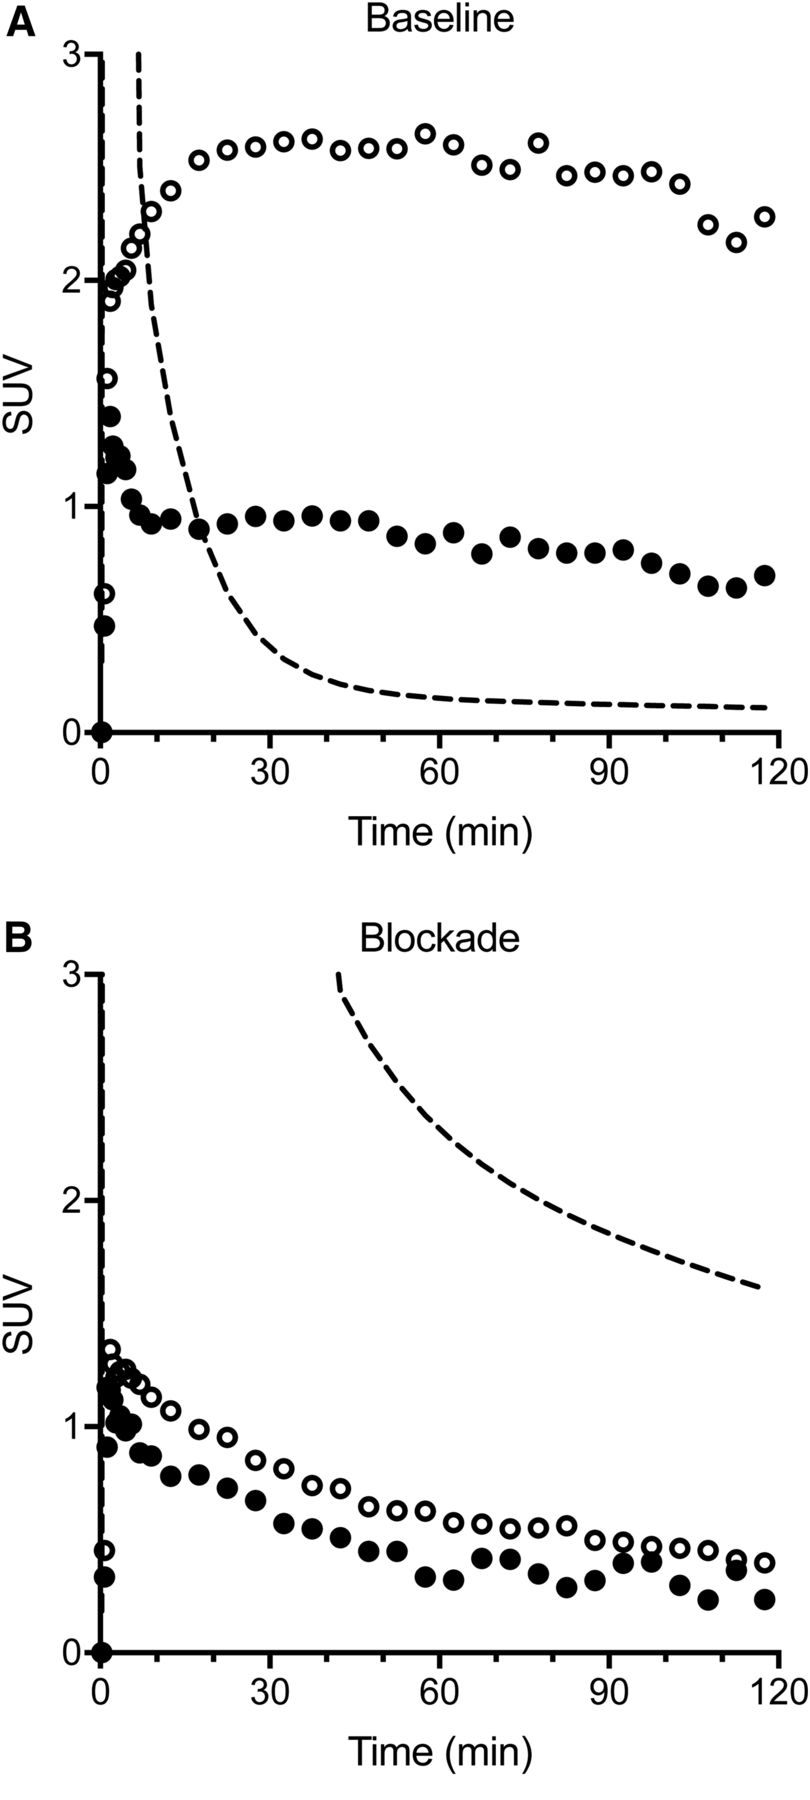
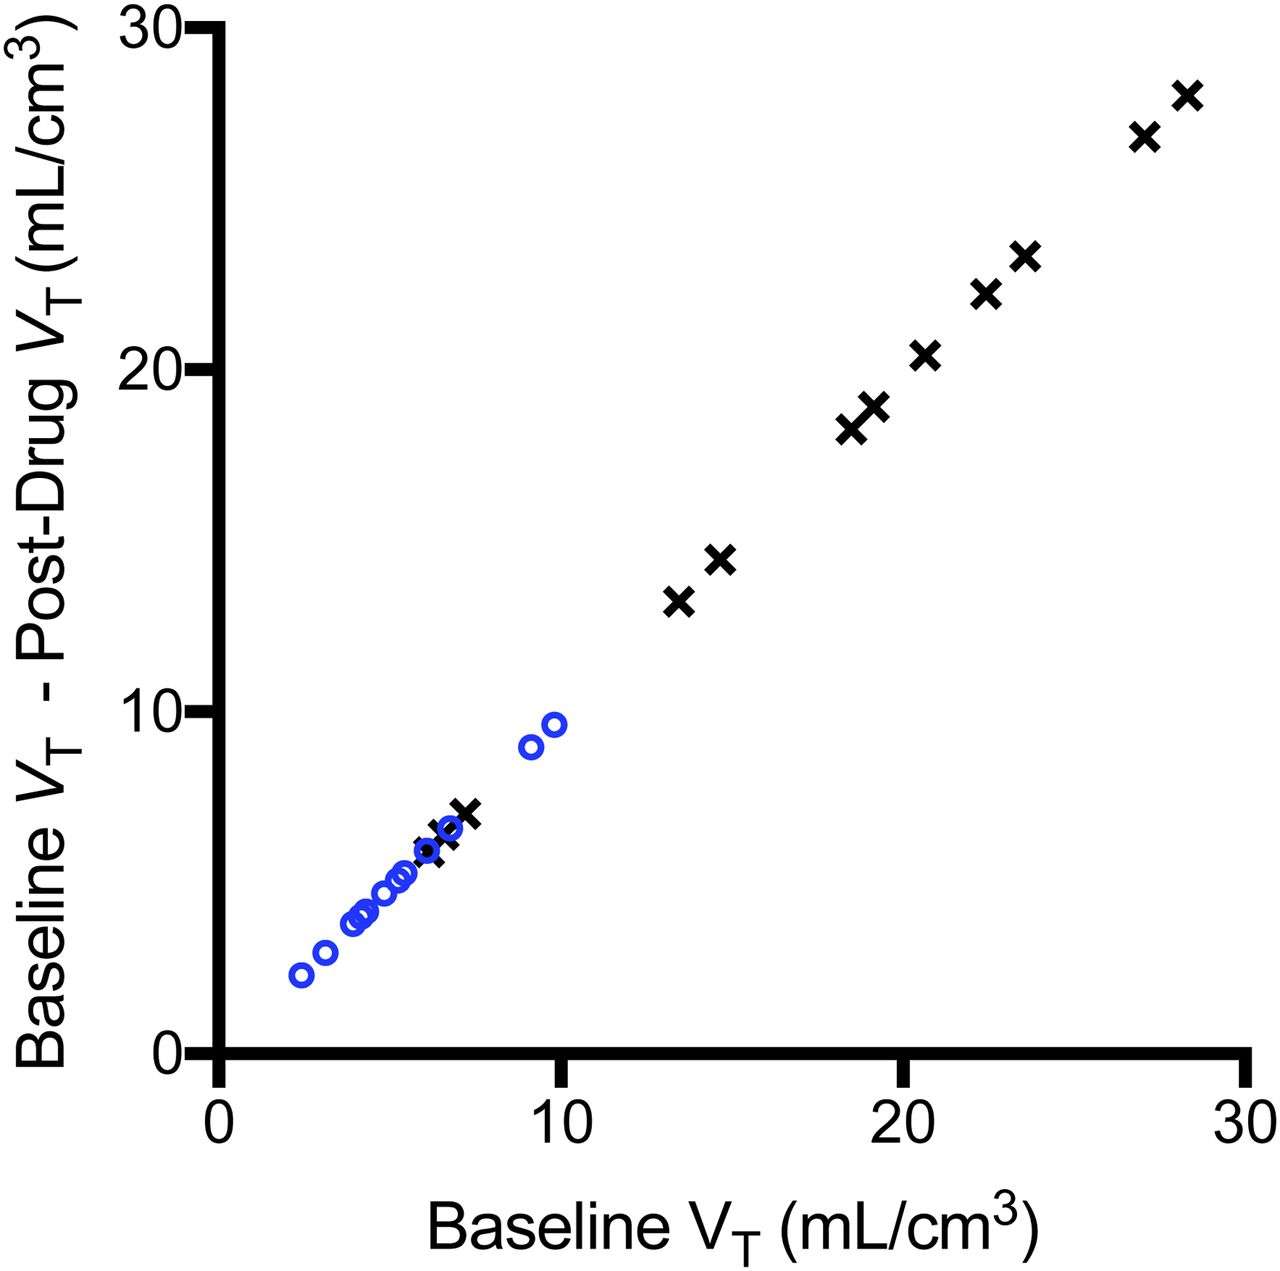
Input Functions
The parent fraction remained high through the 2-h scan: 95% ± 3% at 30 min and 85% ± 15% at 90 min after 11C-AS2471907 injection (Supplemental Fig. 1; supplemental materials are available at http://jnm.snmjournals.org). Administration of the 11β-HSD1 inhibitor ASP3662 led to lower parent fractions: 81% ± 8% at 30 min and 66% ± 13% at 90 min (n = 2). At baseline, the SUV of 11C-AS2471907 in the plasma peaked at 23 ± 5 at the end of the injection, and then decreased to 0.08 ± 0.02 at the end of the scan. The plasma clearance rate of 11C-AS2471907 was 1.0 ± 0.21 L/min. The plasma concentration of 11C-AS2471907 increased with preadministration of ASP3662 (Fig. 3): at the end of the scan, the plasma SUV was 1.1 ± 0.7, and the plasma clearance rate decreased to 0.21 ± 0.10 L/min (n = 2). Thus, blockade of the enzyme by the 11β-HSD1 inhibitor ASP3662 dramatically slowed clearance and increased tracer bioavailability. The plasma-free fraction of 11C-AS2471907 was measured at 1.6% ± 0.5% at baseline and 1.4% ± 0% after ASP3662 administration. The whole-blood–to–plasma ratio was constant at 0.63 ± 0.07 for all time points and studies, indicating that the radiotracer and its metabolites do not enter blood cells.

Regional time–activity curves at baseline (A) and after ASP3662 administration (B) in occipital cortex (○) and caudate (●). Dashed lines represent metabolite-corrected input function.
Brain PET Images
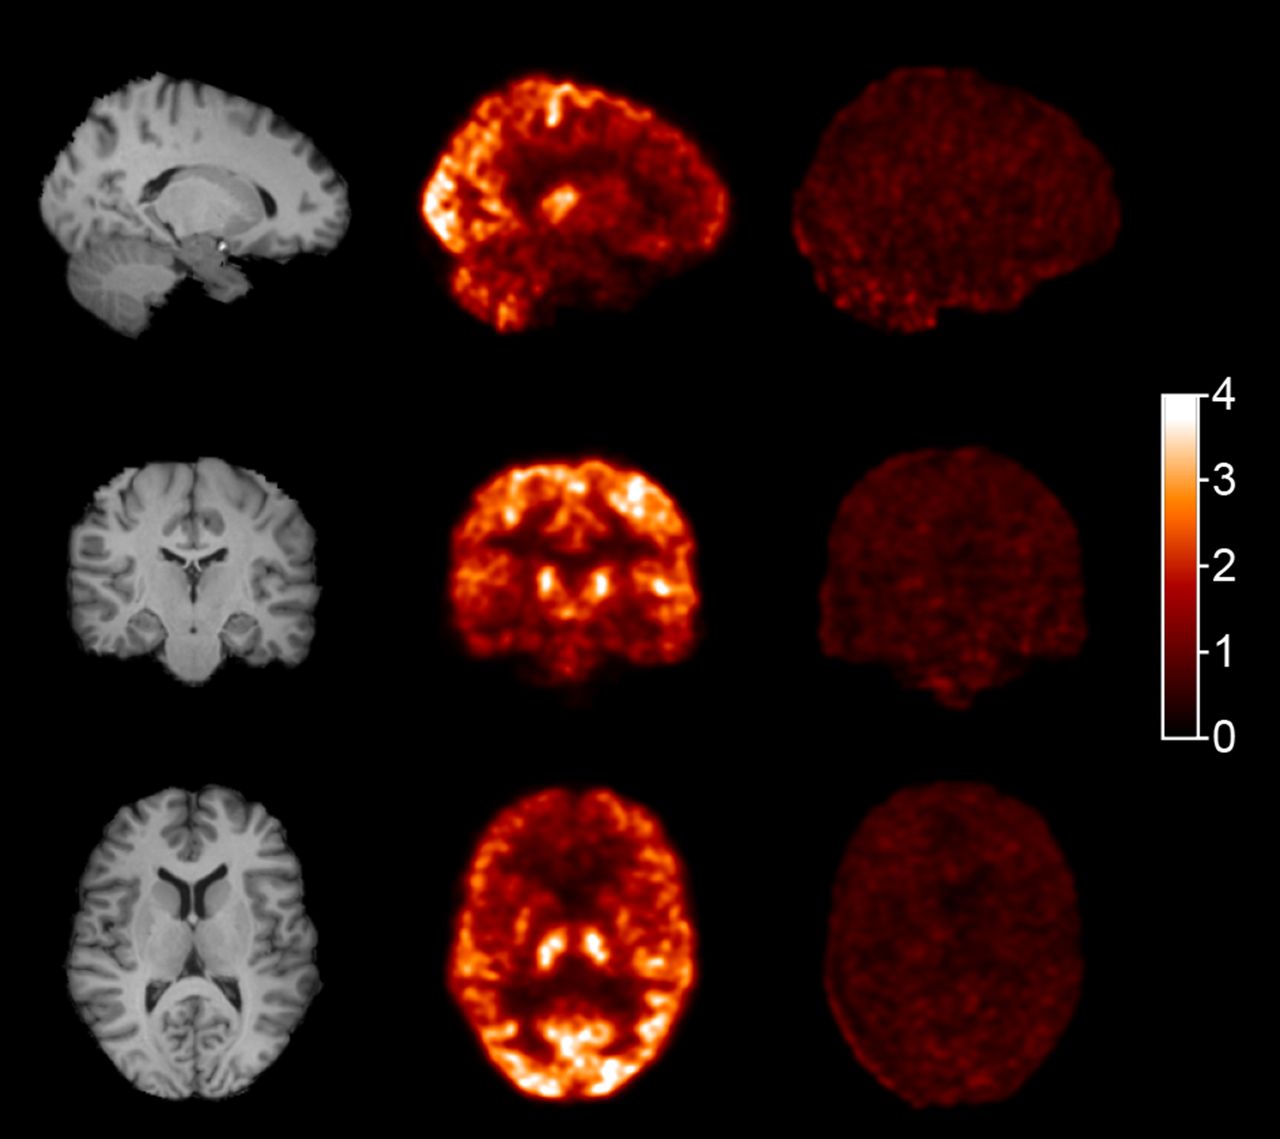
Representative images of 11C-AS2471907 in the brain are shown in Figure 4 and in Supplemental Figure 2. The rank order of regional binding, from lowest to highest peak uptake, was white matter, caudate, amygdala, insula, cingulum, frontal and temporal cortices, putamen, cerebellum, parietal cortex, thalamus, and occipital cortex. In the occipital cortex, SUV peaked at 2.7 ± 0.4 at approximately 60 min and then decreased to 2.4 ± 0.5 at 120 min. In the white matter region, the SUVpeak was 1.0. ± 0.2. After administration of ASP3662, 11C-AS2471907 uptake was reduced dramatically in the brain, especially in regions with higher uptake at baseline: in the occipital cortex, the SUV peaked at 1.2 ± 0.2 at approximately 2 min and then decreased to 0.3 ± 0.1 at the end of the scan. Representative time–activity curves at baseline and after blockade are shown in Figure 3 and Supplemental Figure 3.

MR (left) and baseline (center) and postdrug (right) PET SUV images. Averaged from 40 to 60 min.
Kinetic Modeling
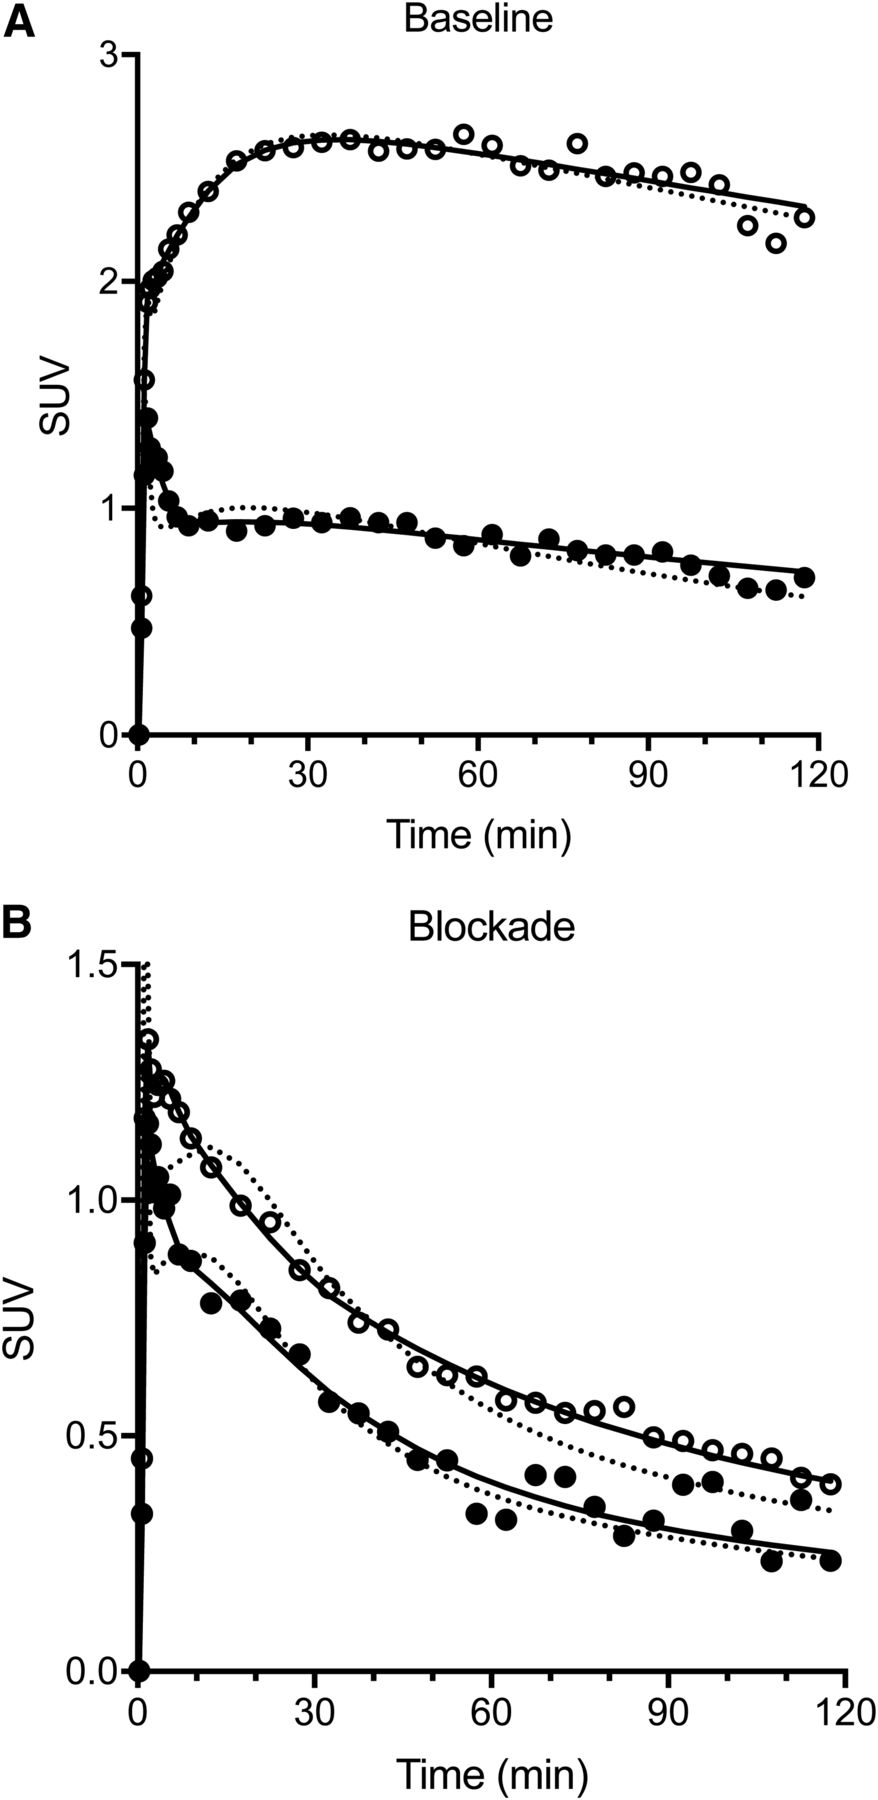
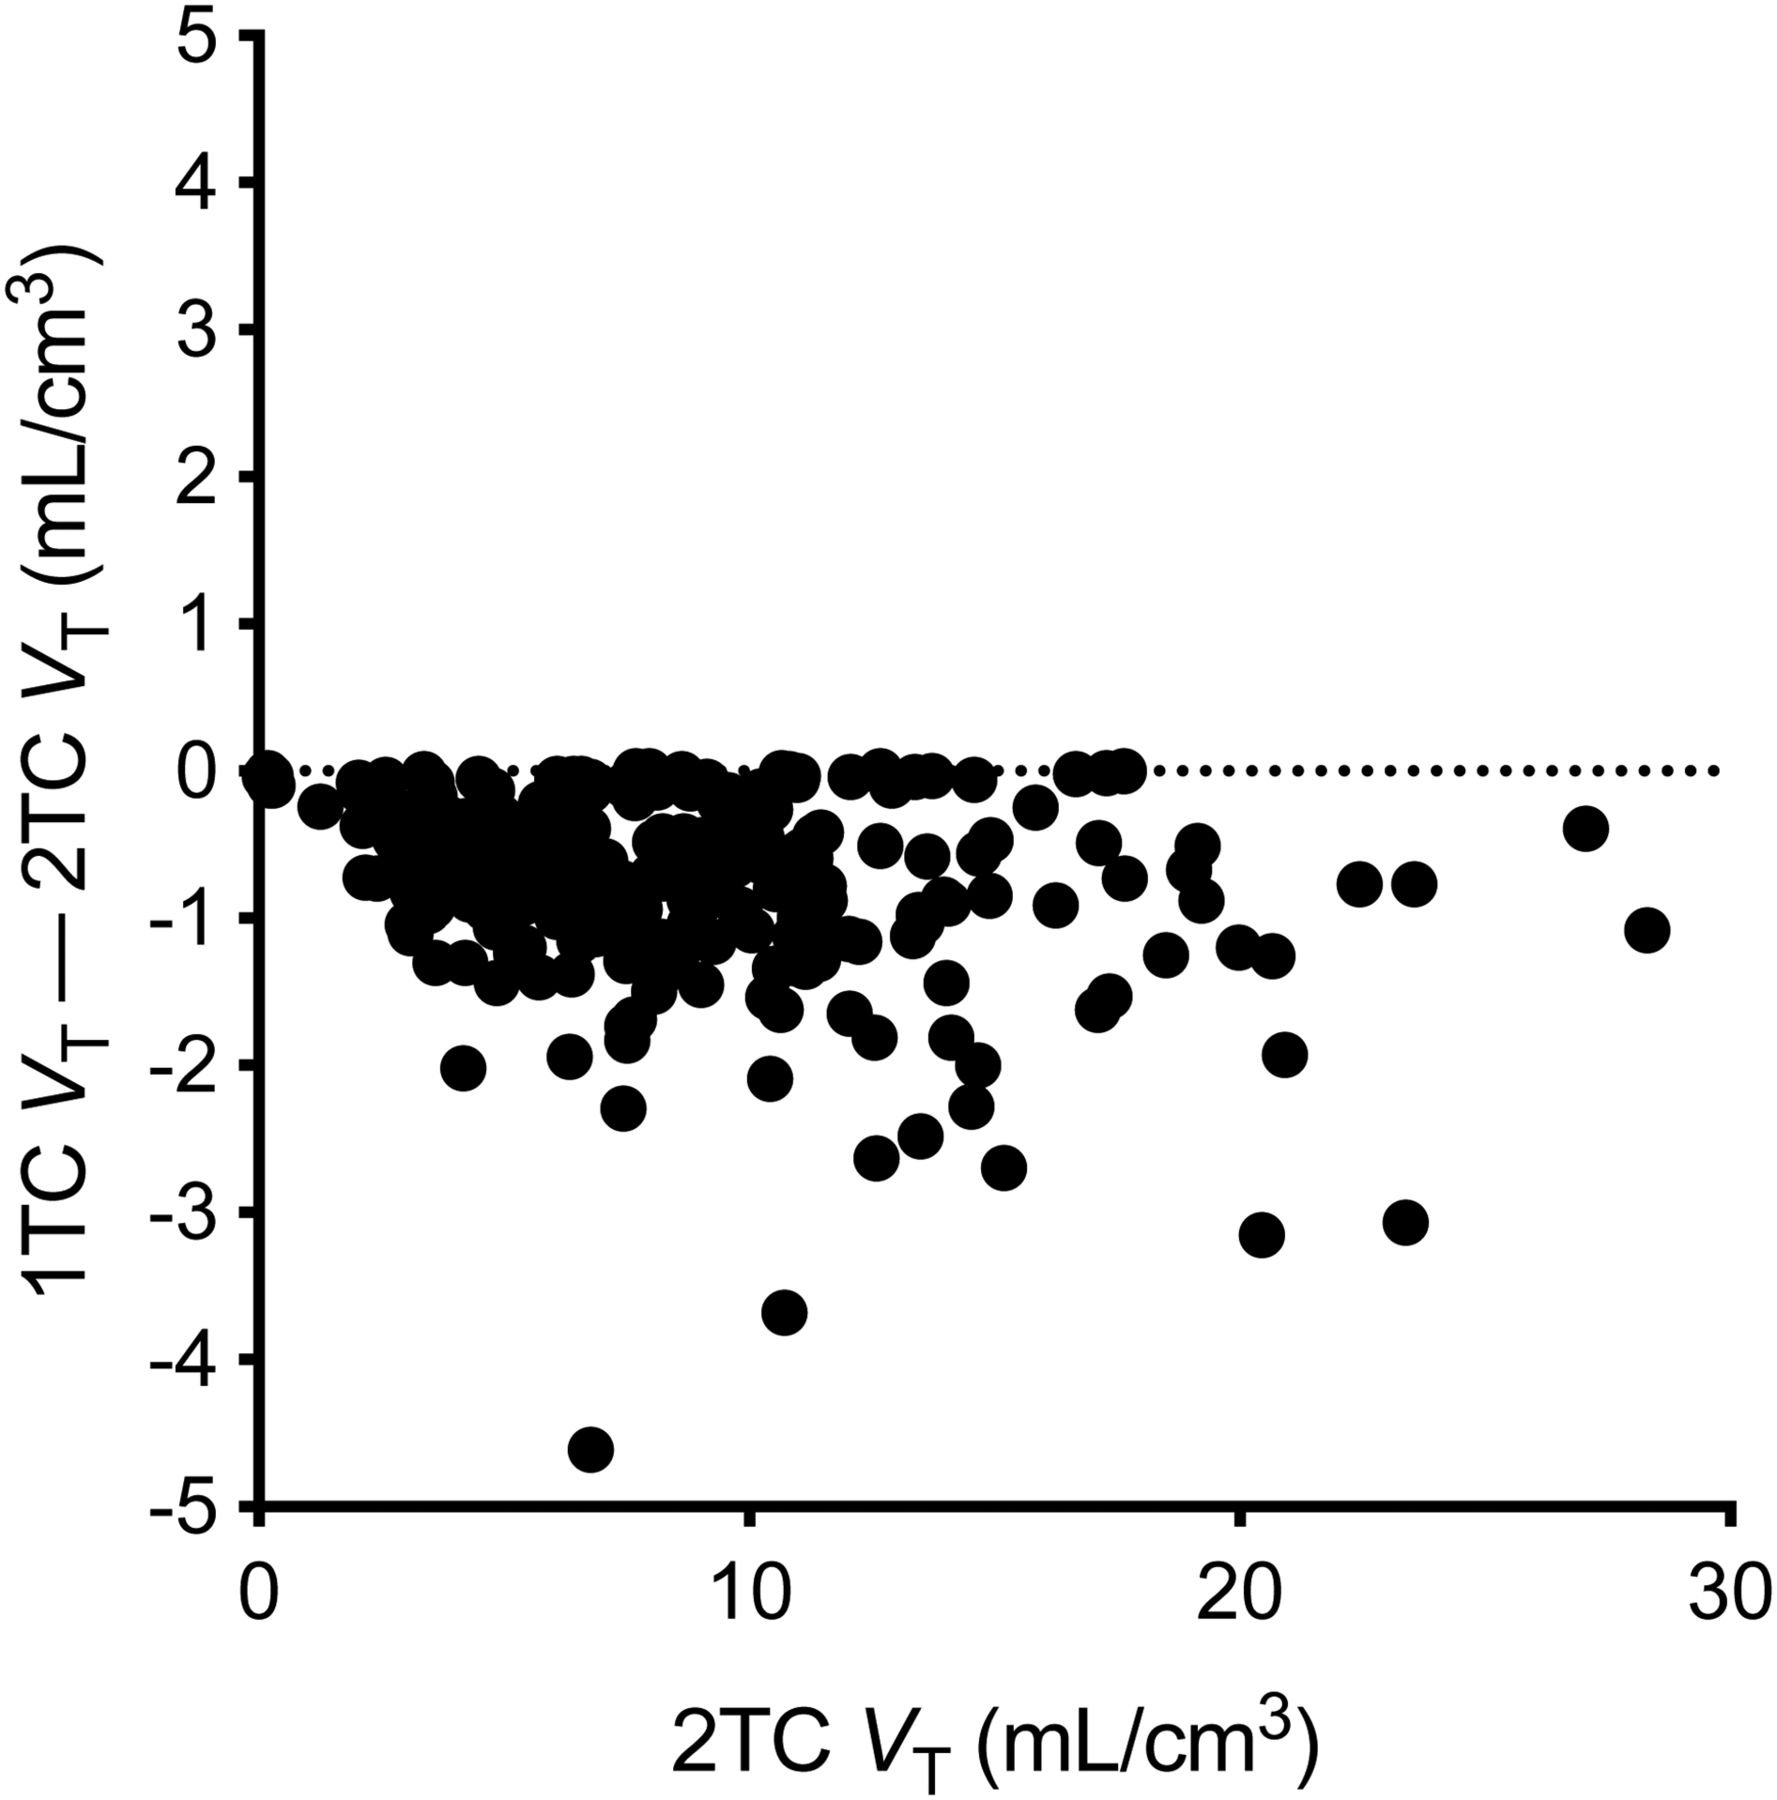
Representative fits of regional time–activity curves with the 1TC and 2TC models are shown in Figure 5. According to the F test, the 2TC model produced better fits (F2,28 > 3.34, P < 0.05) than the 1TC model in most cases (171 of 240 baseline fits, and 24 of 24 postdrug fits). At baseline, 2TC VT values ranged from 3.7 ± 1.5 mL/cm3 (range, 2.1–7.2 mL/cm3) in the caudate nucleus to 14.5 ± 5.3 mL/cm3 (range, 7.8–28 mL/cm3) in the occipital cortex (Table 1). There was large variability in VT values across subjects. The coefficient of variation across subjects ranged from 35% in the centrum semiovale (white matter region) to 52% in the cerebellum. The relative SE on VT estimates was typically lower than the coefficient of variation: for the 2TC, the median relative SE ranged from 3% in the frontal cortex to 34% in the amygdala. The entry rate constant (K1) was low: the median 2TC K1 value ranged from 0.022 mL/min/cm3 in the centrum semiovale to 0.070 mL/min/cm3 in the thalamus. Though the 2TC model produced better fits in most cases, the VT values obtained with the 1TC and 2TC models were highly correlated (r2 = 0.984), with a slope close to one (0.977) and an intercept close to zero (−0.545). A Bland–Altman plot comparing 2TC and 1TC VT values is shown in Figure 6. The high correlation between 2TC and 1TC VT values may be in part explained by the fact that the fit in the 1TC model was poor only in the early frame data, and became better in the later data (Fig. 5).

Regional time–activity curves and fitted curves at baseline (A) and after ASP3662 administration (B) in occipital cortex (○) and caudate (●). Solid lines represent 2TC model fits, and dotted lines represent 1TC model fits.
Regional VT (mL/cm3) for 11C-AS2471907 in Baseline Scans

Bland–Altman plot of VT values from 2TC and 1TC models.
After administration of ASP3662, regional VT values were drastically reduced, and ranged from 0.16 ± 0.01 mL/cm3 in the amygdala to 0.23 ± 0.07 mL/cm3 in the occipital cortex (Supplemental Table 1). Occupancy plots for the 2 blockade scans with ASP3662 are shown in Figure 7. The occupancy was greater than 99% in both scans, and the VND was estimated at 0.16 ± 0.04 mL/cm3. Thus, virtually all tracer uptake in the baseline scans is specifically bound. Based on this VND estimate and the mean baseline 2TC VT estimates, regional binding potential of 11C-AS2471907 was calculated and ranged from 22 in the caudate to 90 in the occipital cortex. However, given the very low VND, it is likely that regional binding potential estimates may not be that reliable.

Occupancy plots for the 2 blockade studies. Occupancy was estimated to be >99% for both studies, and VND was estimated to be 0.19 ± 0.016 mL/cm3 in first subject (black cross symbols) and 0.13 ± 0.011 mL/cm3 in second subject (blue circles).
Test–retest summary statistics are presented in Table 2, and individual scan VT values are shown in Supplemental Table 2. During the retest scan, 11C-AS2471907 VT values tended to be higher than those from the test scan: the average TRV value (mTRV) was positive in most regions and models. Without correction for multiple comparisons, the difference between VT values was significant in a few regions (paired Student t test, P < 0.05): the cingulum; insula; and frontal, occipital, and temporal cortices (for the 2TC model). With the 2TC model, sdTRV was less than 10% in most cortical ROIs (14% in the parietal cortex) and ranged from 14% (cerebellum) to 51% (amygdala) in other ROIs. ICC values ranged from 0.55 in the centrum semiovale to 0.98 in the cerebellum, indicating that the large intersubject variability in VT was not caused by measurement error. Comparing methods, the 2TC model produced the lowest median (across all ROIs) mTRV and sdTRV values, indicating that the simpler model did not produce less variable VT estimates.
TRV of 11C-AS2471907 VT
The effect of scan duration is presented in Supplemental Table 3. If the scan duration is reduced to 90 min, the mean bias on 2TC VT values is on the order of 8% (median value across all ROIs), but up to 31% in small ROIs; the bias SD is on the order of 8% (median value across all ROIs), but up to 58% in the smallest ROIs. Test–retest variability (sdTRV) is also increased by 10 percentage points (median value across all ROIs) when only 90 min of data are used.
DISCUSSION
In this study, we evaluated the novel radiotracer 11C-AS2471907 to quantify the distribution of the 11β-HSD1 enzyme in the brain of healthy human subjects.
The parent fraction of 11C-AS2471907 in plasma remained relatively high through the scans, although clearance of 11C-AS2471907 from the plasma was fast. After blockade of 11β-HSD1, plasma concentration of 11C-AS2471907 increased, and the parent fraction decreased, as also seen with tracers for other targets such as serotonin transporters with a large number of binding sites in the periphery (29). At baseline, uptake in the brain, as measured by SUVs, ranged from 1 to 2.5, which is sufficient for imaging studies. 11C-AS2471907 VT values were well correlated with messenger RNA scores for the 11β-HSD1 gene in the Allen human brain atlas (probes 1027298 and 1027299) in the cortex (r > 0.92, n = 6, P < 0.01), and in all ROIs excluding the white matter ROI (centrum semiovale) (r > 0.81, n = 11, P < 0.002). The white matter has the highest 11β-HSD1 messenger RNA expression in the Allen atlas, which does not match the present results.
Kinetic modeling indicated that the 2TC provided better fits than the 1TC model. Moreover, the test–retest study indicated that the VT estimates tended to be less variable with the 2TC than with the 1TC model. On the basis of these observations, the 2TC model is the recommended method for quantification of 11C-AS2471907 VT values. Because of the low uptake rate constant (K1 < 0.1 mL/min/cm3), it is also recommended to include a blood volume correction term in the model and to estimate the vascular fraction for each ROI. The low K1 values may be due in part to the low plasma-free fraction for this tracer (∼1.5%). A reference tissue model is not appropriate for this radiotracer, and likely not appropriate for any tracer targeting 11β-HSD1 due to the ubiquitous distribution of 11β-HSD1 in the brain.
Since the baseline time–activity curves were relatively flat (Fig. 3A), near-equilibrium conditions might be reached. Therefore, to evaluate whether kinetic modeling could be avoided, the tissue–to–metabolite-corrected plasma ratio (SUVR) was computed (at 60–90 min) and compared with VT. SUVR tended to be larger than VT in all ROIs: for example, it was 67% ± 48% higher in the occipital cortex. Moreover, the TRV of SUVR also tended to be higher than that of VT: for example, sdTRV was 5% for VT and 16% for SUVR in the occipital cortex. Overestimation of VT by SUVR is expected unless washout from tissue is much faster than that from plasma (30), and SUVR is additionally sensitive to the variability of these 2 parameters.
Blocking studies indicated that 11C-AS2471907 has specific binding in all investigated ROIs and thus that there is no reference region for this target. Moreover, 11C-AS2471907 VND was very low compared with baseline VT values, indicating that most of the tracer uptake in the brain is due to specific binding.
There was a large range of 11C-AS2471907 VT values across subjects. This difference between subjects was confirmed during the retest scans as indicated by the high ICC values for VT estimates. The test–retest studies also indicated that VT values from the retest scans tended to be higher than those from the test scans done earlier on the same day. This trend apparently needs verification in future studies. Nonetheless, on the basis of the current data, care should be taken in the planning of these future studies to account for this possibility. These changes in VT values could be diurnal or habituation of the subjects to the PET procedures. Diurnal changes in cortisol levels in the periphery are well documented (31), however, it is not yet known if such changes occur for 11β-HSD1 in the brain. The TRV was low in large cortical ROIs (<10%) but higher in smaller ROIs. This is in part due to the low injected activity dose in these studies (234 MBq on average), leading to noisier images and data. AS2471907 is amenable to radiolabeling with 18F, which is expected to improve image quality and quantification.
The recommended scan duration based on the present data is 120 min, due to increased variability of VT estimates with shorter scans. In the future, shorter scan length may be possible if injected activity doses can be increased, or if the fluorinated version of this tracer is used.
As the first 11β-HSD1 PET radiotracer for human use, 11C-AS2471907 should be useful for measuring target occupancy by 11β-HSD1 inhibitors in the brain. Second, this radiotracer can be used to compare brain occupancy by 11β-HSD1 inhibitors with functional activity of 11β-HSD1 in the brain (cerebral spinal fluid measurements) or periphery to explore single-dose or multiple-dose exposure relationships and inform optimal dose selection for clinical trials. Third, quantification of 11β-HSD1 with 11C-AS2471907 would allow the investigation of whether stress-related or other diseases alter 11β-HSD1 protein expression in the brain.
CONCLUSION
To our knowledge, this is the first report of a PET radiotracer to image and quantify the enzyme 11β-HSD1 in humans. 11C-AS2471907 has reasonable brain uptake and high specific binding signals in the human brain. Imaging data are modeled well with the 2TC model, and model-derived regional VT values display fairly good within-subject test–retest reproducibility. Nonetheless, between-subject variations in regional VT values are large, which may be due to physiologic differences among the subjects. 11C-AS2471907 appears to be an appropriate radiotracer to image and quantify 11β-HSD1 in the human brain and can be used to assess enzyme occupancy of 11β-HSD1 inhibitors. However, accurate quantification of 11β-HSD1 under disease conditions may require the development of a radiotracer with better imaging characteristics.
DISCLOSURE
Mark Walzer and Gerard J. Marek are employees of Astellas; Susan Bellaire and Nancy Yuan were employees of Astellas at the time of the study. This study was funded by Astellas. No other potential conflict of interest relevant to this article was reported.
Footnotes
Published online Mar. 15, 2019.
- © 2019 by the Society of Nuclear Medicine and Molecular Imaging.
REFERENCES
- Received for publication February 10, 2018.
- Accepted for publication January 7, 2019.


