


Abstract
The M1 muscarinic acetylcholine receptor (mAChR) plays an important role in learning and memory, and therefore is a target for development of drugs for treatment of cognitive impairments in Alzheimer disease and schizophrenia. The availability of M1-selective radiotracers for PET will help in developing therapeutic agents by providing an imaging tool for assessment of drug dose-receptor occupancy relationship. Here we report the synthesis and evaluation of 11C-LSN3172176 (ethyl 4-(6-(methyl-11C)-2-oxoindolin-1-yl)-[1,4'-bipiperidine]-1'-carboxylate) in nonhuman primates. Methods: 11C-LSN3172176 was radiolabeled via the Suzuki–Miyaura cross-coupling method. PET scans in rhesus macaques were acquired for 2 h with arterial blood sampling and metabolite analysis to measure the input function. Blocking scans with scopolamine (50 μg/kg) and the M1-selective agent AZD6088 (0.67 and 2 mg/kg) were obtained to assess tracer binding specificity and selectivity. Regional brain time–activity curves were analyzed with the 1-tissue-compartment model and the multilinear analysis method (MA1) to calculate regional distribution volume. Nondisplaceable binding potential values were calculated using the cerebellum as a reference region. Results: 11C-LSN3172176 was synthesized with greater than 99% radiochemical purity and high molar activity. In rhesus monkeys, 11C-LSN3172176 metabolized rapidly (29% ± 6% parent remaining at 15 min) and displayed fast kinetics and extremely high uptake in the brain. Imaging data were modeled well with the 1-tissue-compartment model and MA1 methods. MA1-derived distribution volume values were high (range, 10–81 mL/cm3) in all known M1 mAChR–rich brain regions. Pretreatment with scopolamine and AZD6088 significantly reduced the brain uptake of 11C-LSN3172176, thus demonstrating its binding specificity and selectivity in vivo. The cerebellum appeared to be a suitable reference region for derivation of nondisplaceable binding potential, which ranged from 2.42 in the globus pallidus to 8.48 in the nucleus accumbens. Conclusion: 11C-LSN3172176 exhibits excellent in vivo binding and imaging characteristics in nonhuman primates and appears to be the first appropriate radiotracer for PET imaging of human M1 AChR.
The muscarinic acetylcholine receptors (mAChRs) are G protein–coupled receptors widely expressed in the central nervous system, where they mediate acetylcholine neurotransmission (1) and thus are targets for drug discovery (2). Five main subtypes of mAChRs (M1–M5) have been identified. The M1 receptor is abundantly expressed throughout the striatum, cortex, hippocampus, and amygdala (3–6). These regions are important for learning and memory and develop amyloid plaques in Alzheimer disease patients (7). Many studies showed that M1-knockout mice display cognitive deficits (3,8–10), and activation of the M1 mAChR had precognitive effects (8,11–13), improving memory and modulating hippocampal synaptic plasticity (13–20).
Given the important roles of M1 mAChR in regulating memory, cognition, and behavior, selective M1 activation has emerged as a potential treatment strategy for cognitive impairments in Alzheimer disease and schizophrenia (21–24). Therapeutic application of nonselective mAChR agonists, for example, melameline, sabcomeline, and xanomeline, has been limited by cholinergic adverse events such as diarrhea, nausea, gastrointestinal anomalies, salivation, and sweating thought to be mediated by mAChR subtypes other than M1 (25). Therefore, there remains a need for developing M1-selective drugs for potential treatment of cognitive disorders.
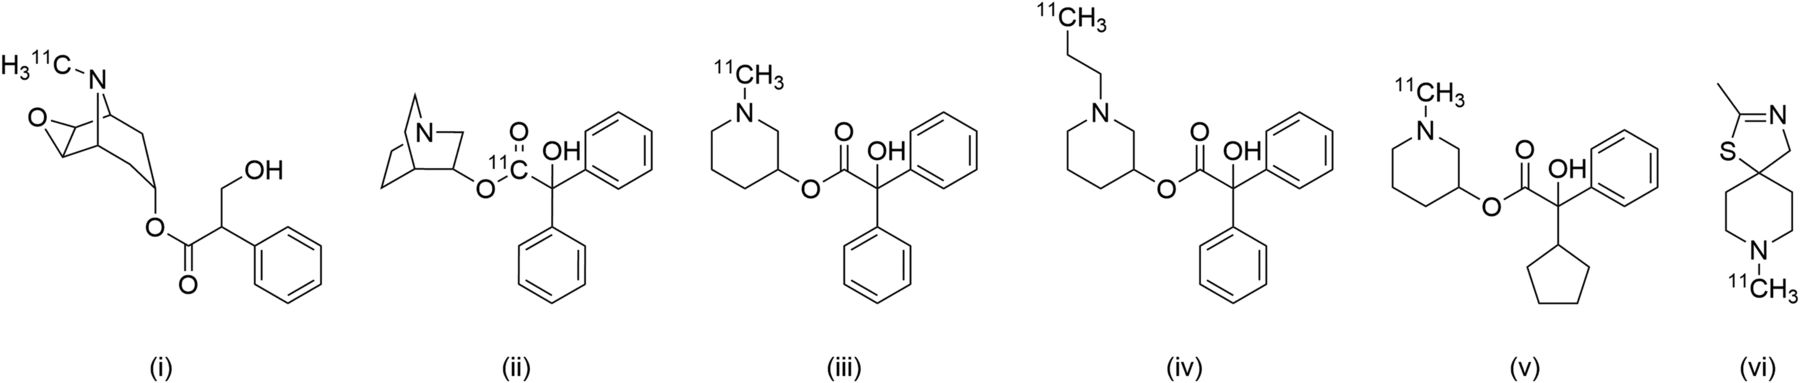
PET ligands that selectively bind to a target would greatly facilitate discovery of drugs with minimal to no side effects for superior therapeutic applications. Several PET ligands with affinity to M1 have been reported, for example, 11C-scopolamine (26), 11C-NMPB (27), N-methyl 11C-benztropine (28), and 11C-QNB (29) (Fig. 1). These ligands have good brain uptake and were used to map mAChR in primate brains. However, they lack M1 selectivity and display slow or irreversible binding kinetics. 11C-xanomeline and the M1 allosteric agonist 11C-GSK-1034702 are among the available nonselective agonist PET ligands exhibiting limited specific binding despite clear brain penetration (30,31). 11C-AF150(S) was recently reported as an agonist PET ligand for M1 receptors and evaluated in rats (32,33). However, the authors concluded that its use in brain imaging would be challenging due to its low lipophilicity (log D of 0.050), rapid metabolism, and moderate affinity (Kd of 200 nM for M1 in rat cerebral cortex) (32). More recently, (S)-1-(methyl-11C)piperidin-3-yl (R)-2-cyclopentyl-2-hydroxy-2-phenylacetate was reported as a high-affinity (Ki = 3.5 nM) radioligand based on the chemical scaffold of the antagonist MPB, but it appears to possess limited in vivo binding specificity, as its uptake was only partially blocked by the M1-selective antagonist pirenzepine (34).

Chemical structures of selected PET radioligands for mAChRs: (i) 11C-scopolamine; (ii) 11C-QNB; (III) 11C-MPB; (iv) 11C-PPB; (v) (S)-1-(methyl-11C)piperidin-3-yl (R)-2-cyclopentyl-2-hydroxy-2-phenylacetate; (vi) 11C-AF150(S).
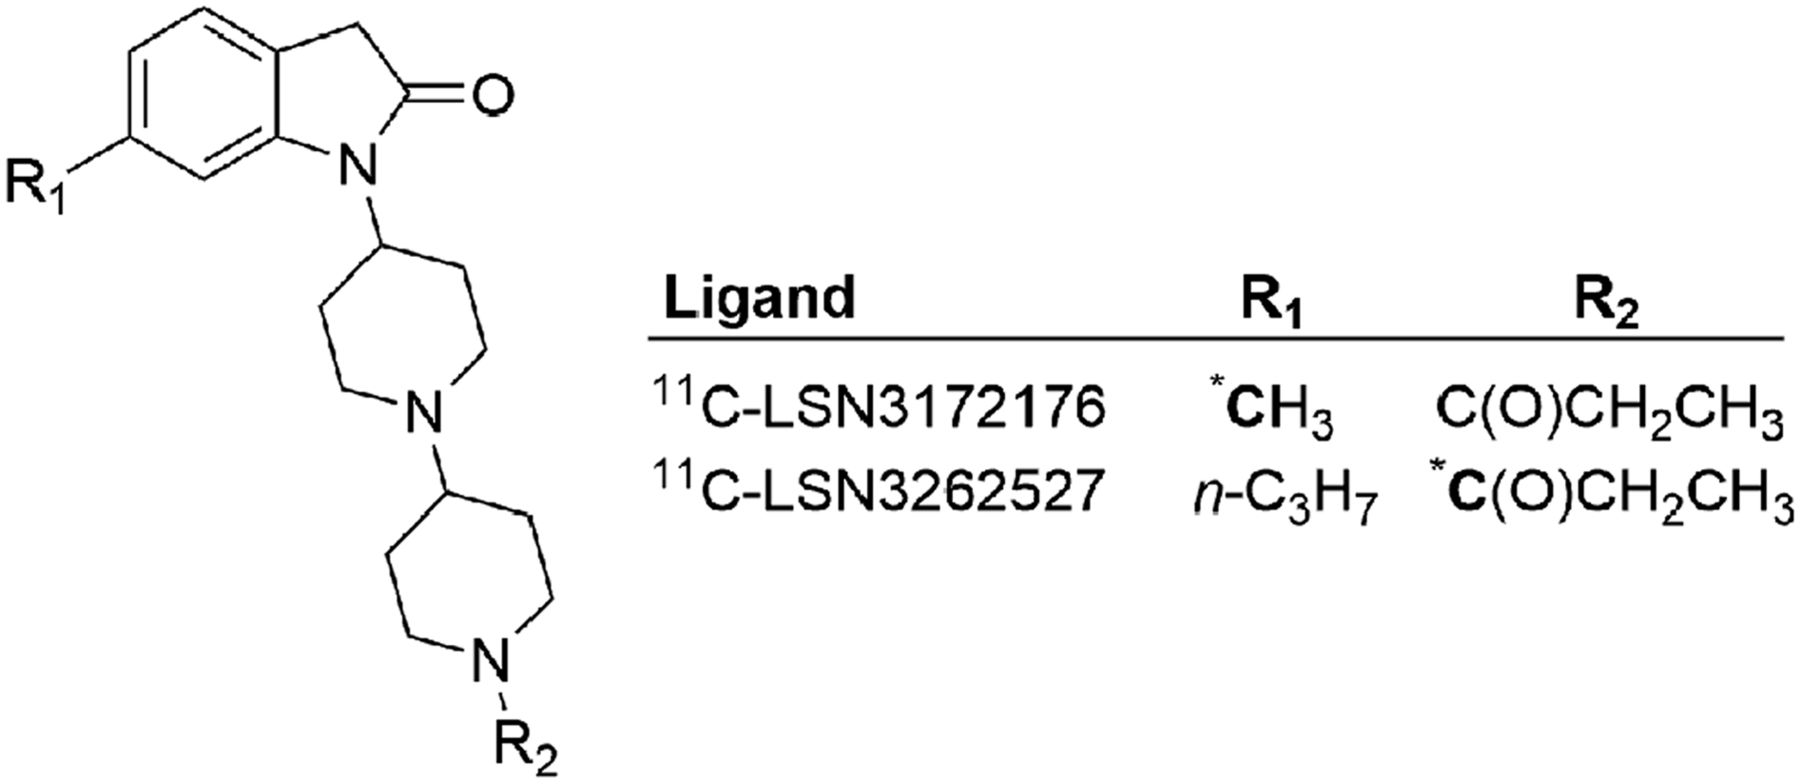
We recently reported the discovery of two novel M1 mAChR-selective agonist ligands, LSN3172176 and LSN3262527 (Fig. 2), which are amenable to 11C-radiolabeling (35,36). Here we report the radiosynthesis of 11C-LSN3172176 (ethyl 4-(6-(methyl-11C)-2-oxoindolin-1-yl)-[1,4'-bipiperidine]-1'-carboxylate) and its in vivo characterization in nonhuman primates.

Novel selective agonist for M1 mAChR. Boldface letter C with asterisk indicates 11C-radiolabeling site.
MATERIALS AND METHODS
Both the reference standard LSN3172176 and the boronic acid precursor LSN3234794 were prepared by Eli Lilly & Co. (Lilly Research Centre) according to published procedures (37). Figure 3 outlines brief synthetic schemes for LSN3172176 and LSN3234794, including radiosynthesis of 11C-LSN3172176 (the supplemental materials provide more details; supplemental materials are available at http://jnm.snmjournals.org).
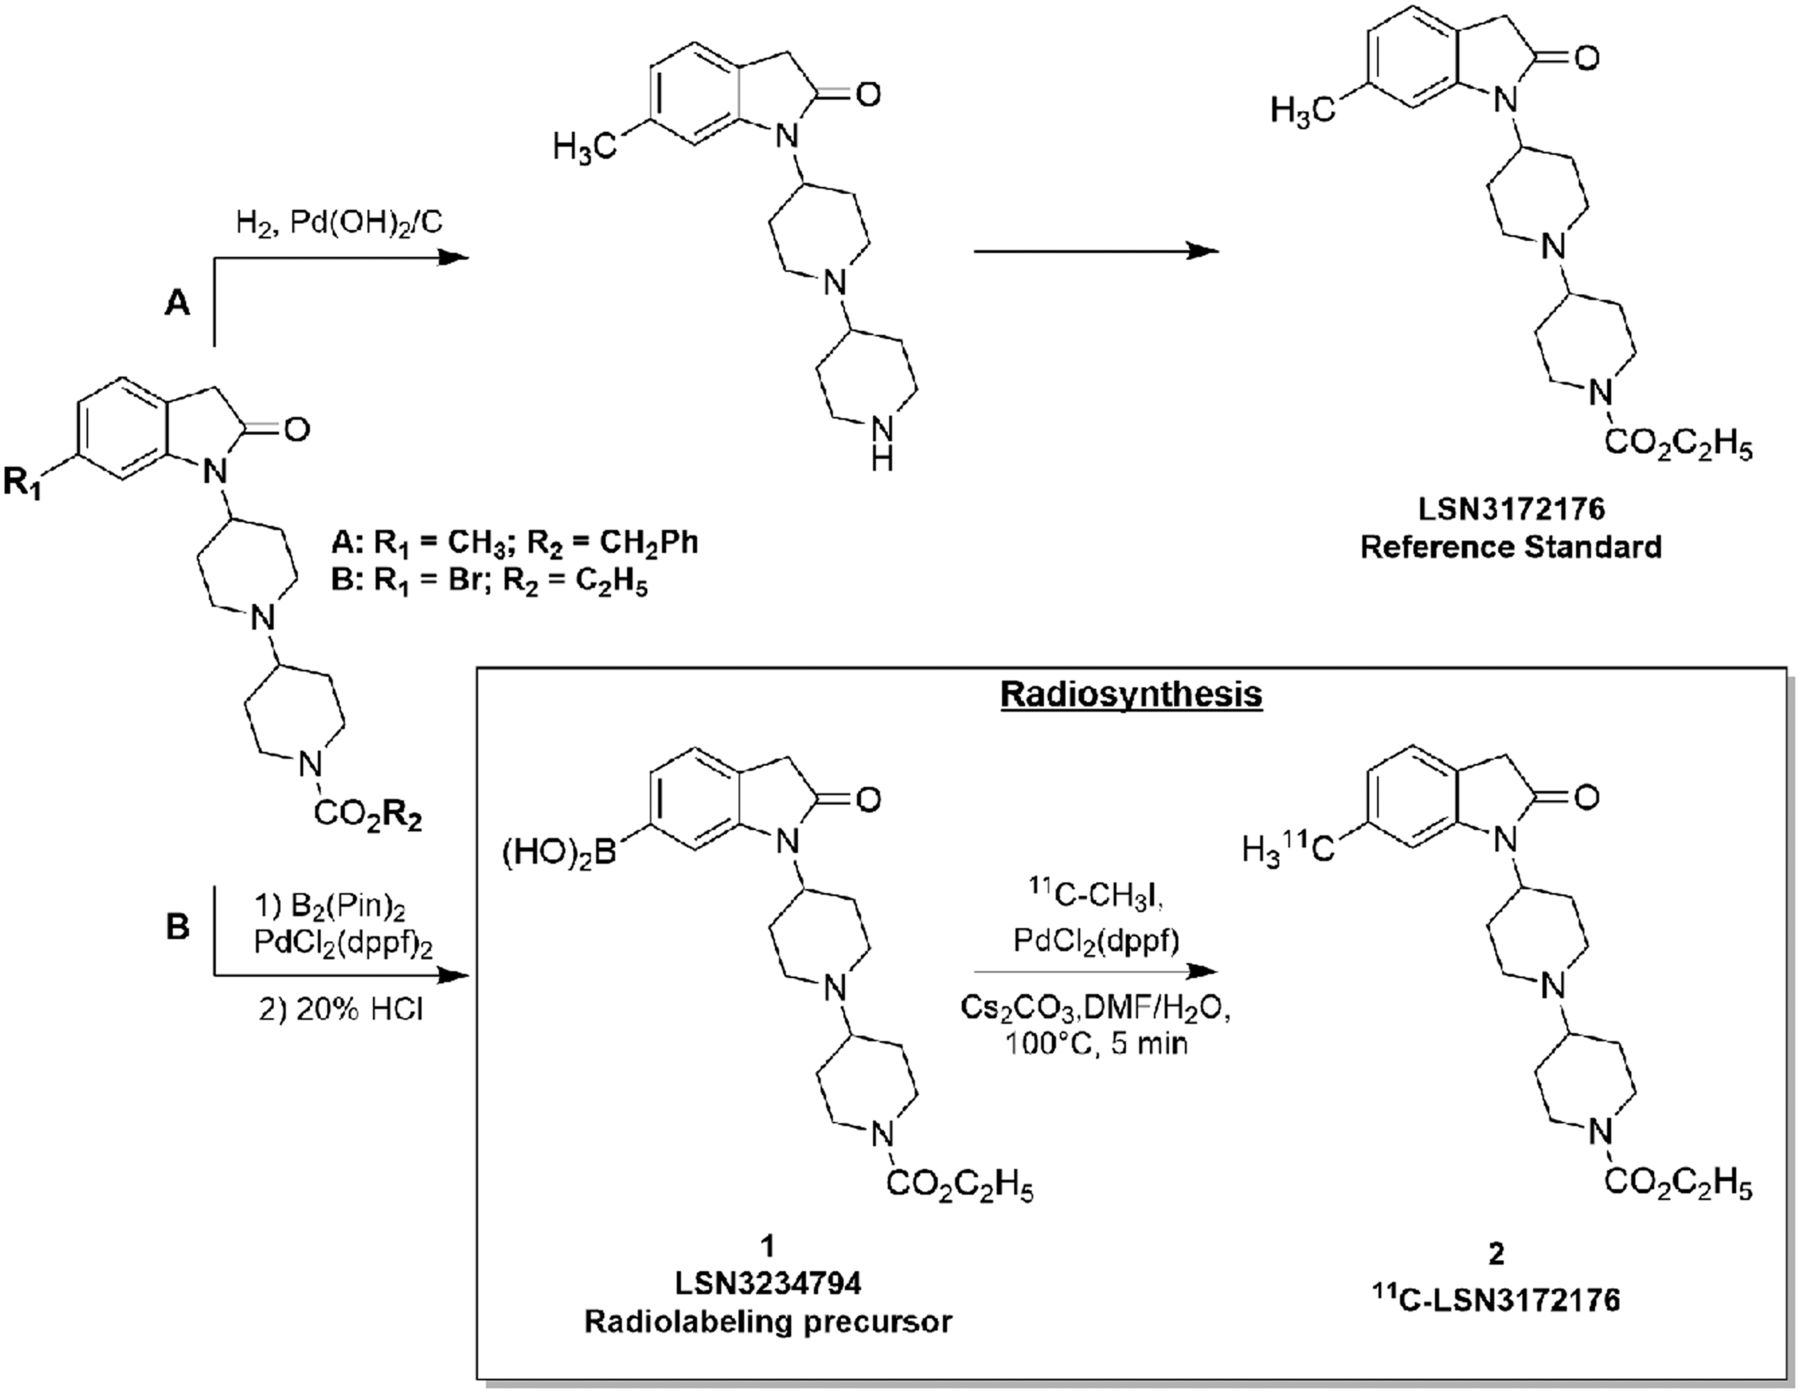
Brief scheme outlining synthesis of LSN3172176 and radiolabeling precursor, as well as radiosynthesis of 11C-LSN3172176.
In Vitro and In Vivo Properties
All in vitro pharmacologic characterization and in vivo validation of LSN3172176 as an M1-selective mAChR PET tracer candidate were described recently (38). EC50 (half the maximal effective concentration that induces a response) values were 7.0, 3.7, and 2.4 nM in mouse, rat, and human, respectively. Binding affinity (Ki, nM) for mAChRs was in the following rank order: M1 (8.9) > > M4 (41.4) > M5 (55.6), M2 (63.8) > M3 (3,031).
PET Imaging Experiments in Rhesus Monkeys
General PET Study Design
Imaging experiments were performed in rhesus monkeys (Macaca mulatta) according to a protocol approved by the Yale University Institutional Animal Care and Use Committee. Two sets of scans were obtained: a baseline scan with 11C-LSN3172176 followed by a blocking scan after administration of scopolamine (50 μg/kg) over 10 min at about 40 min before the start of the second scan (n = 2); and 2 blocking scans with 11C-LSN3172176 after pretreatment with the known M1-selective partial agonist AZD6088 at the doses of 0.67 and 2 mg/kg, both given over 15 min at about 2 h before the injection of 11C-LSN3172176.
PET Scan and Image Analysis Procedures
Subjects were sedated approximately 2 h before the first PET scan and kept anesthetized for the duration of the experiments as previously described (39).
Brain images were acquired using the FOCUS 220 PET scanner (Siemens Preclinical Solutions) with a reconstructed image resolution of about 1.5 mm. After a transmission scan, 11C-LSN3172176 was injected intravenously over 3 min using an infusion pump as reported previously (39). List-mode data were acquired for 120 min and binned into sinograms with the following frame timing: 6 × 30 s, 3 × 1 min, 2 × 2 min, and 22 × 5 min.
Scan data were reconstructed with a Fourier rebinning/filtered backprojection algorithm as described previously (39). Regions of interest (n = 16) were previously delineated on a single representative anatomic rhesus monkey MR image registered to a template image. Regions used in this study were the amygdala, brain stem, caudate, cerebellum, cingulate cortex, frontal cortex, globus pallidus, hippocampus, insula, nucleus accumbens, occipital cortex, pons, putamen, substantia nigra, temporal cortex, and thalamus. Registration parameters (from PET-to-MR and from MR-to-atlas) were obtained to apply the regions of interest to individual PET scans (40), and regional time–activity curves were generated and expressed in SUV by normalizing by the injected dose and animal body weight.
Metabolite Analysis, Arterial Input Function, and Log D Determination
Arterial blood samples were collected to determine the unmetabolized parent fraction using the automatic column-switching high-performance liquid chromatography system (41) and to calculate the plasma input function. The plasma free fraction (fp) was measured in triplicate using the ultrafiltration method, and the log D was determined by modification of the previously published procedure (42). Additional details are provided in the supplemental materials.
Data Analysis
Regional brain time–activity curves were analyzed with the 1-tissue-compartment (1T) model. Fit quality was compared with the 2-tissue-compartment model and the multilinear analysis-1 (MA1) method (43) to calculate the distribution volume (VT). In MA1, data were fitted starting at time t* = 30 min. Regional nondisplaceable binding potential (BPND) values were calculated using MA1 VT values with the cerebellum as the reference region (44). The simplified reference tissue model (SRTM) (45) was also used to calculate regional BPND values with the cerebellum as the reference region.
For the blocking experiments, target occupancy was estimated using the Lassen plot approach, which can determine the nondisplaceable volume of distribution (VND) and receptor occupancy using VT values at baseline and after pretreatment (46).
RESULTS
Radiochemistry
11C-LSN3172176 was synthesized via Pd0‐mediated cross‐coupling of 11C-iodomethane (47) with 1–1.2 mg of the boronic acid precursor (48,49) in 49.3% ± 16.6% radiochemical yield (decay-corrected) at the end of beam based on trapped 11C-iodomethane radioactivity (n = 12). The radiochemical purity was greater than 99%, and the average molar activity (Am) was 422 ± 259 MBq/nmol at the end of synthesis. Total synthesis time was 47 ± 5 min from the end of beam. The radiochemical purity remained greater than 98% at 60 min after the end of synthesis. The supplemental materials provide details.
PET Scans in Rhesus Monkeys
The mean injected dose of 11C-LSN3172176 was 187 ± 3 MBq, with an Am of 225 ± 100 MBq/nmol at the time of injection, and injected mass was 0.041 ± 0.018 μg/kg.
Plasma Analysis
Parent fraction and radioactivity in plasma over time are presented in Figure 4. 11C-LSN3172176 metabolized rapidly. The parent fraction accounted for 29% ± 6% of the radioactivity at 15 min after injection, which decreased to 10% ± 3% at 90 min (n = 8). All radiometabolites were more polar than the parent compound (Supplemental Fig. 1: retention times ∼3 and 7 min, compared with ∼11 min for the parent). The fp was high, at 41% ± 3% (n = 12). The measured log D of 11C-LSN3172176 was 2.96 ± 0.02, in the optimal range (1–3.5) for brain PET radiotracers (50).
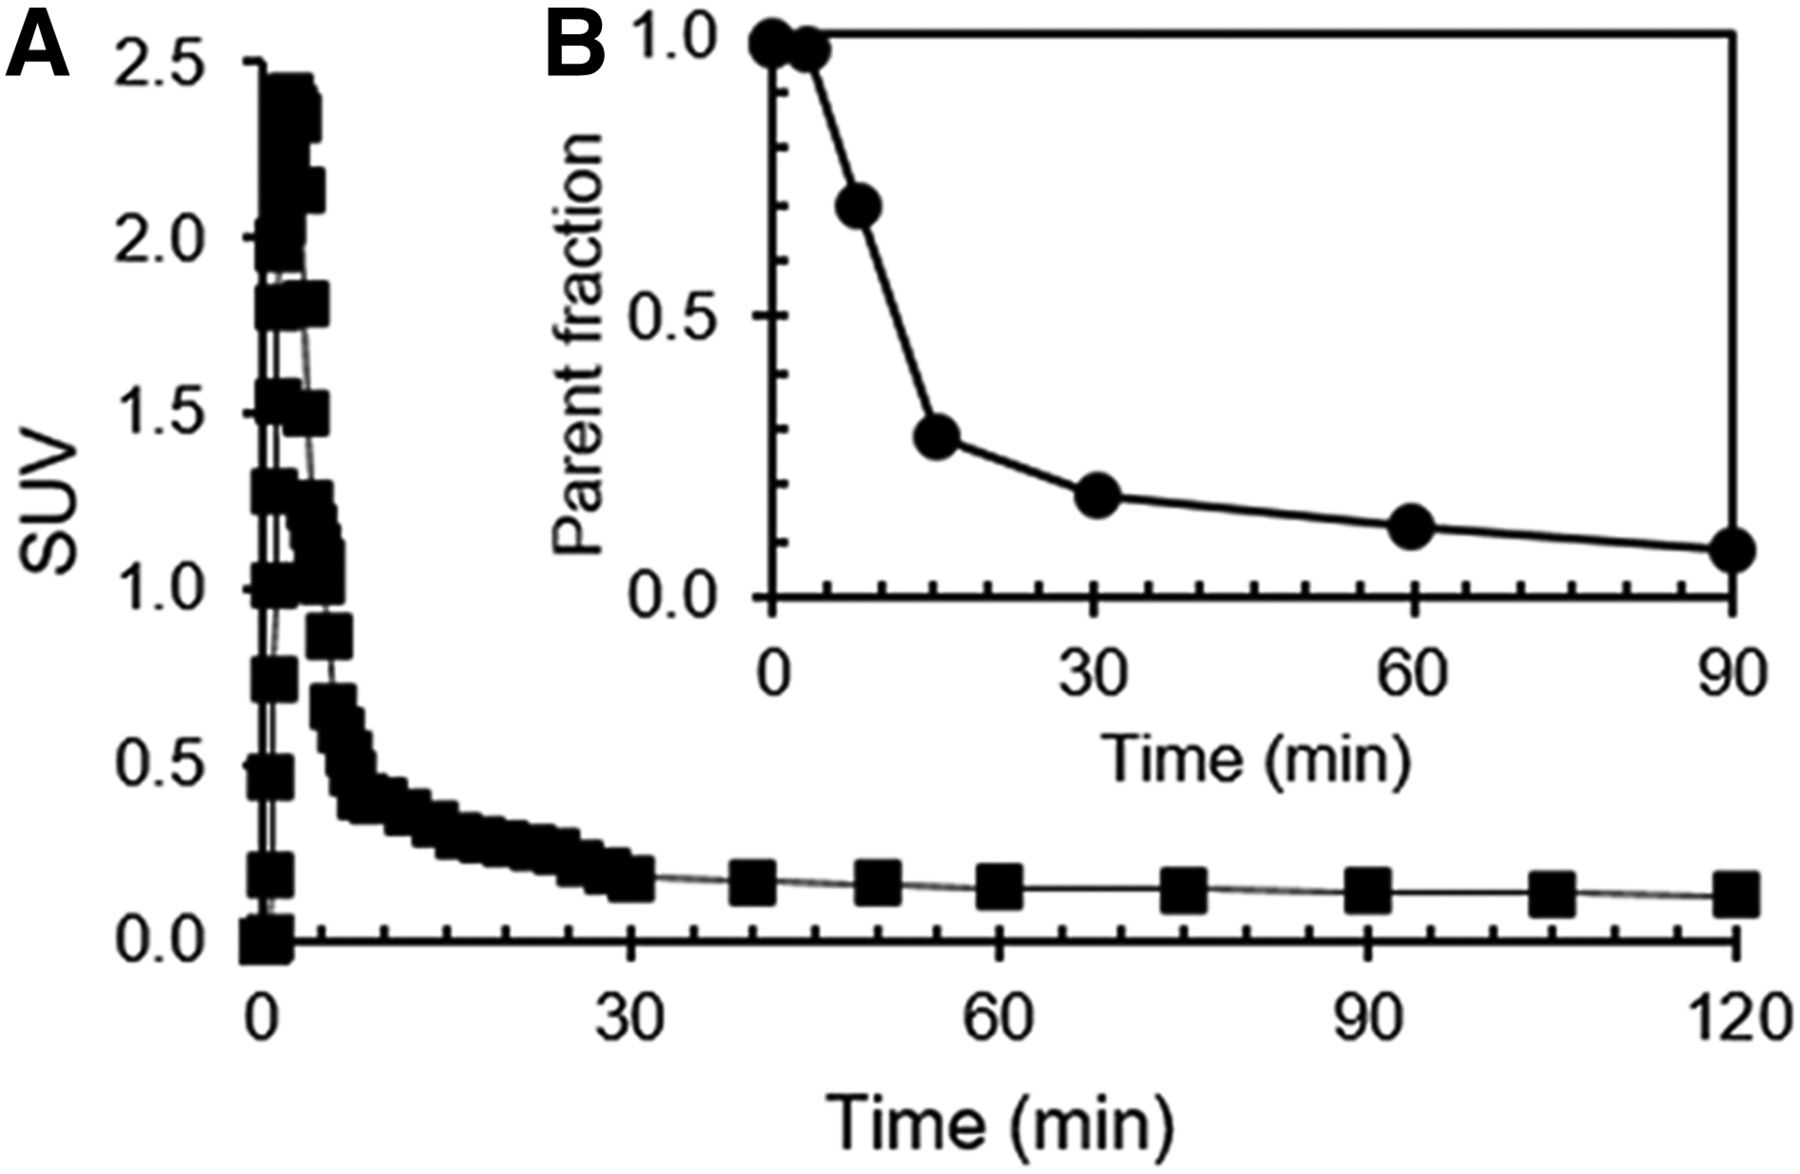
Metabolite-corrected plasma activity (A) and parent fraction in plasma (B) over time for 11C-LSN3172176.
Image Analysis and Kinetic Modeling
Representative brain PET images summed from 30 to 45 min after tracer injection are shown in Figure 5. At baseline, high uptake was seen throughout the brain (Fig. 5A), with SUV highest in the striatum followed by cortical regions, and lowest in the cerebellum. Pretreatment with the nonselective mAChR antagonist scopolamine (50 μg/kg) markedly decreased radioactivity uptake (Fig. 5B), confirming in vivo binding specificity of 11C-LSN3172176. Likewise, blockade by the M1-selective partial agonist AZD6088 (2 mg/kg) confirmed 11C-LSN3172176 in vivo selectivity for M1 mAChR (Fig. 5C).
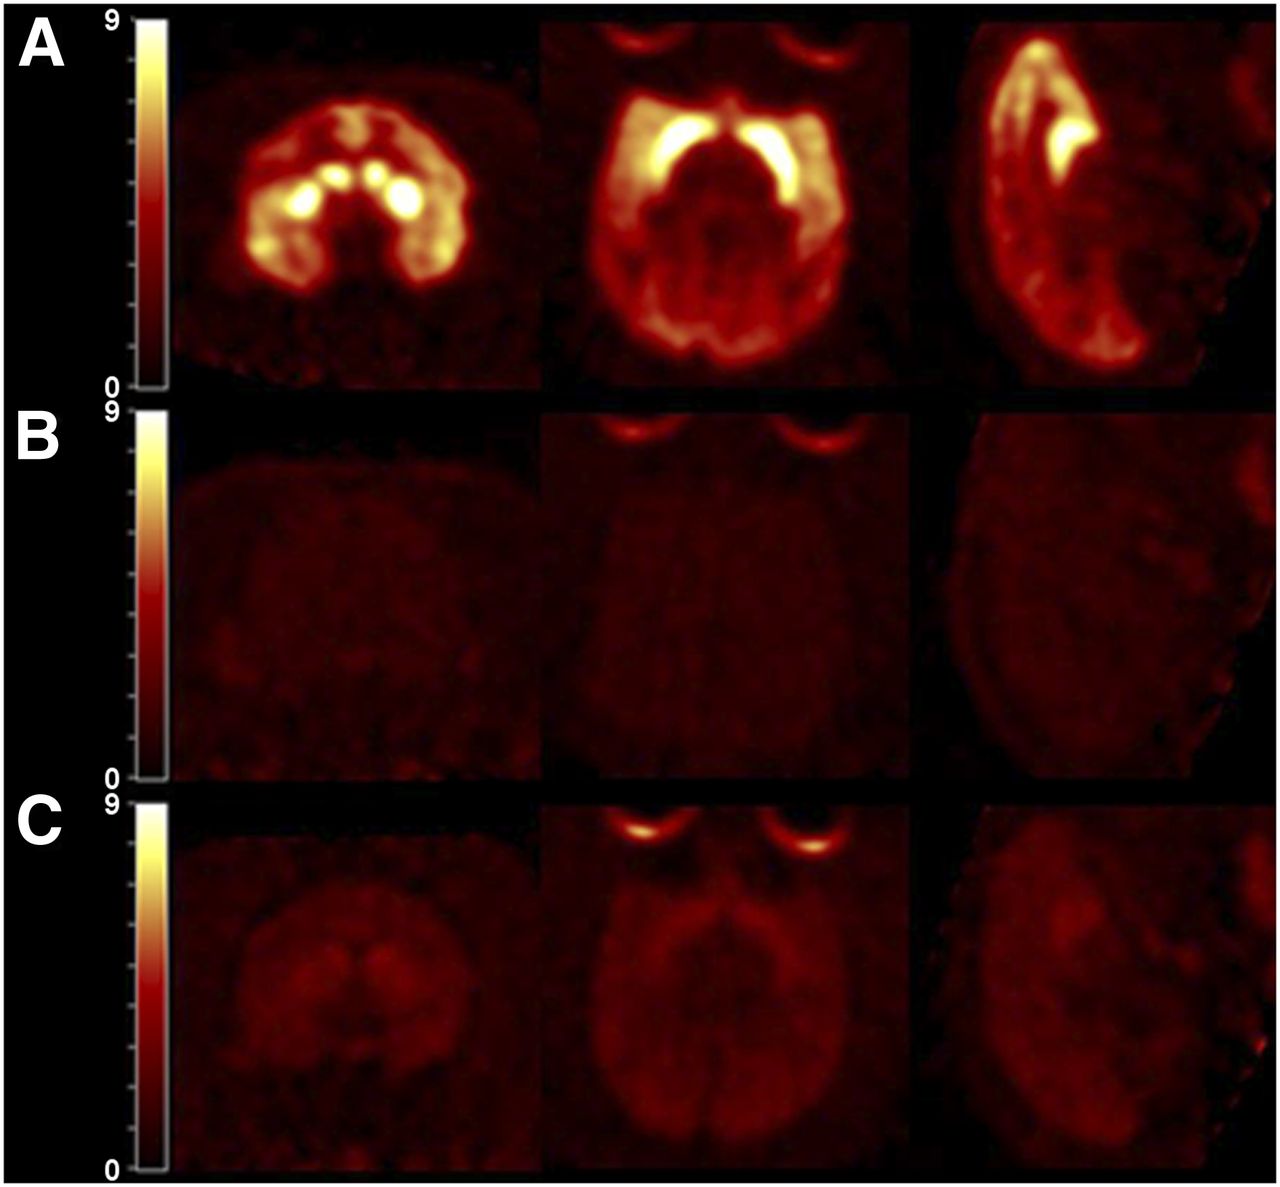
Representative PET SUV images summed from 30 to 45 min after 11C-LSN3172176 injection from baseline scan (A), after pretreatment with scopolamine (50 μg/kg) (B), and after pretreatment with AZD6088 (2 mg/kg) (C).
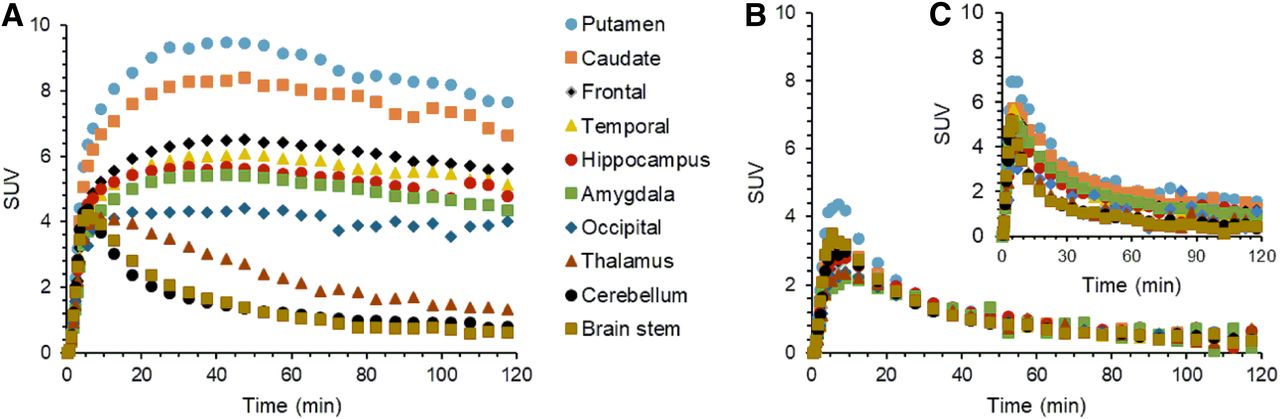
Regional brain time–activity curves are presented in Figure 6. 11C-LSN3172176 displayed high uptake and reversible kinetics, with an SUVpeak of 4–9.5 and peak uptake time ranging from 10 to 50 min after administration (Fig. 6A). Pretreatment with 50 μg of scopolamine per kilogram reduced uptake across all regions to levels similar to that in the cerebellum, with regional radioactivity peaking earlier and clearing faster (Fig. 6B). Similarly, pretreatment with AZD6088 (2 mg/kg) reduced uptake in all brain regions to more homogeneous levels, demonstrating target selectivity (Fig. 6C).

Representative time–activity curves in selected brain regions from 11C-LSN3172176 baseline (A) and blocking scans after pretreatment with scopolamine (50 μg/kg) (B), and with 2 mg of AZD6088 (2 mg/kg) (C).
It is known that the cerebellum is almost devoid of mAChRs (51,52). Indeed, uptake in the cerebellum did not change significantly between baseline and scopolamine-blocking scans (Fig. 6B), supporting the use of the cerebellum as the reference region.
The 1T model produced suitable but less than ideal fits of regional time–activity curves. MA1 (t* = 30) produced good fits and stable estimates of VT values well correlated with those from 1T (Supplemental Fig. 2). Overall, the 2-tissue-compartment model did not provide reliable VT values, with most of the estimates having SEs of greater than 25% (data not shown). Thus, MA1 was chosen for analysis.
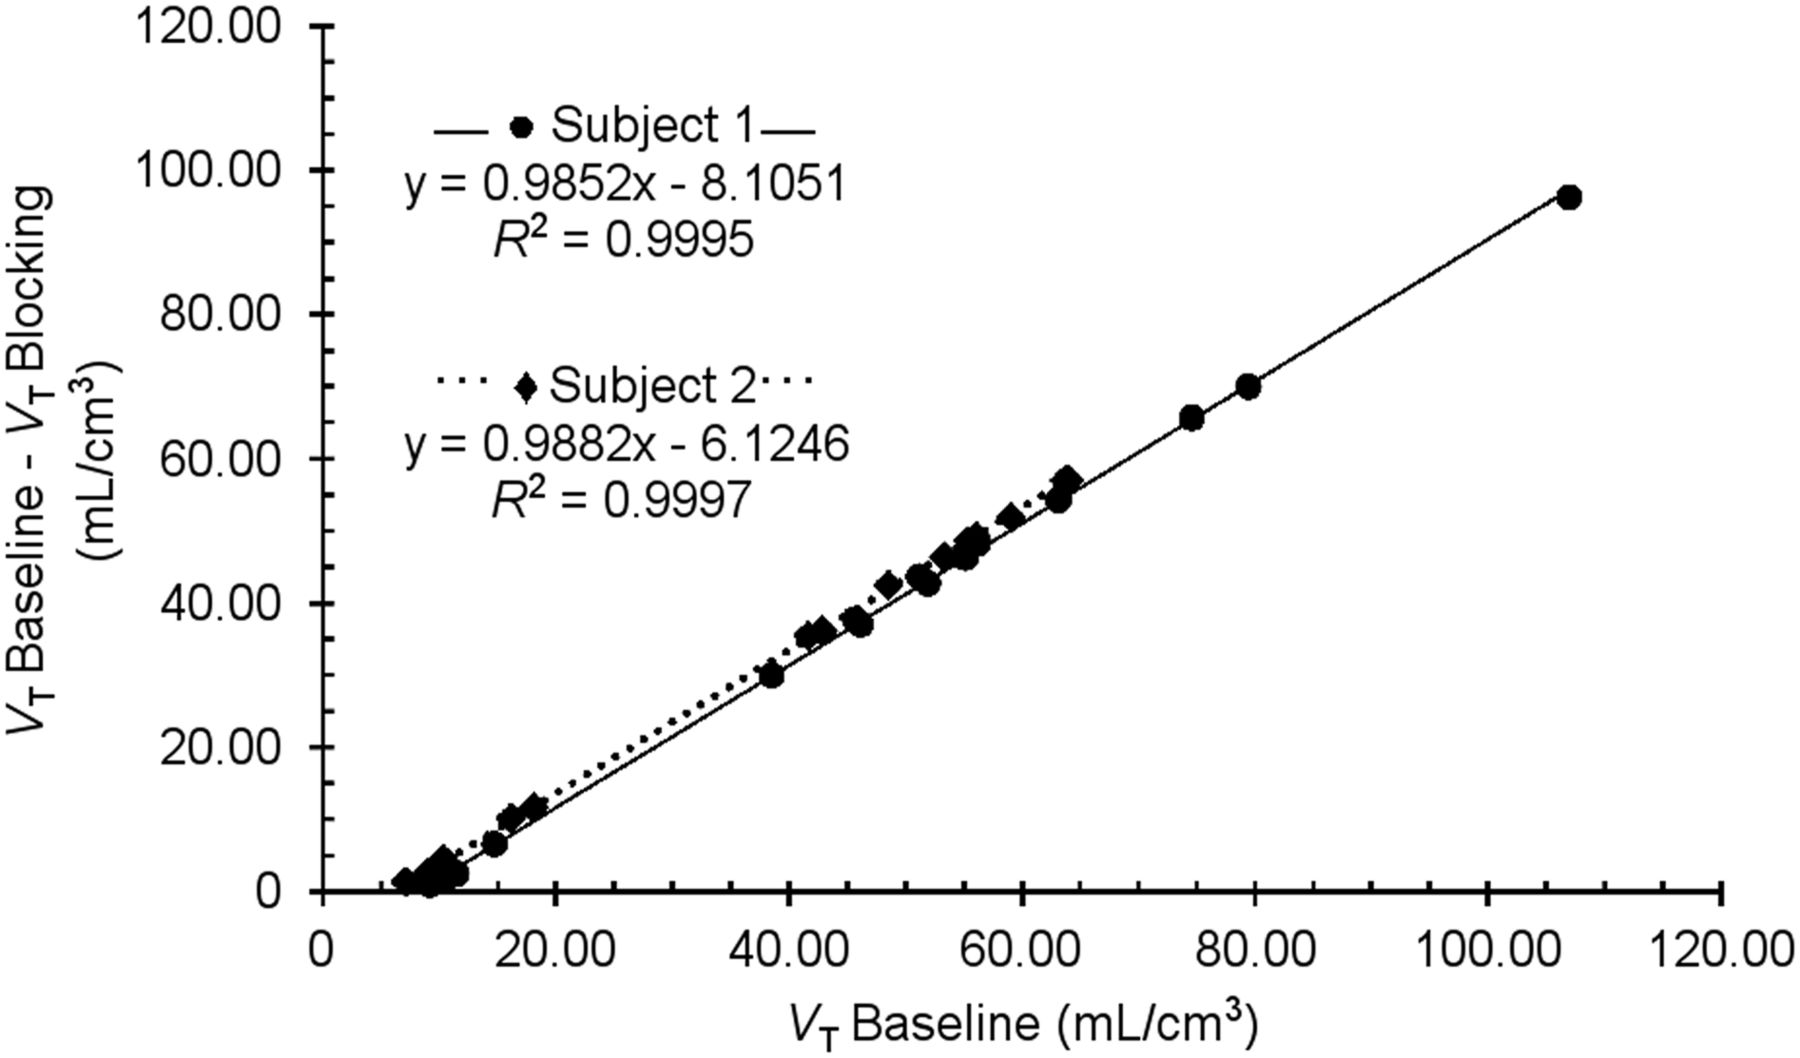
Table 1 presents regional VT values derived from MA1. VT values are higher in the striatal (putamen, nucleus accumbens, and caudate) and cortical areas; moderate in the hippocampus, amygdala, and globus pallidus; and lower in other regions. Dramatic reduction in regional VT was seen with administration of scopolamine (50 μg/kg). Likewise, preblocking with 2 doses of AZD6088 resulted in a clear and dose-dependent reduction in regional VT. Regions with low VT estimates (pons, brain stem, and cerebellum) displayed negligible changes. The average receptor occupancy calculated from the occupancy plot was 98.6% by 50 μg of scopolamine per kilogram (Fig. 7). Occupancies of 68% and 89% were found with 0.67 and 2 mg/kg of AZD6088, respectively. The average VND in the blocking scans with scopolamine and with the 2 doses of AZD6088 was calculated to be 6.3 ± 0.8 mL/cm3.
Regional Binding Parameters for 11C-LSN3172176 at Baseline and After Preblocking with Scopolamine and AZD6088

Occupancy plots for 11C-LSN3172176 preblocking scans with scopolamine (50 μg/kg, n = 2).
Regional BPND values were calculated from the MA1 VT values using the cerebellum as the reference region (Table 1). Note that the average VND value of 6.3 ± 0.8 mL/cm3 estimated from the blocking scans is in good agreement with the mean baseline VT value of 8.1 ± 1.3 mL/cm3 for the cerebellum, indicating the cerebellum may be a suitable reference region. In vitro studies showed no significant 3H-LSN3172176 binding to the cerebellum in monkey tissue and across other species (38). The minimal reduction in cerebellum VT caused by blockade may be due to partial-volume effects from the high uptake in gray matter regions.
Regional BPND values derived from the SRTM using the cerebellum as the reference region are also listed in Table 1. SRTM produced good fits of regional time–activity curves and reliable BPND estimates. The highest VT and BPND observed in the nucleus accumbens are consistent with autoradiographic study of M1 distribution in the human brain (53). In addition to the role of the nucleus accumbens in the reward circuit (54), it is reported to be important in spatial learning and memory as well (55). BPND values derived from the SRTM method were consistently lower by about 25% across all brain regions (Supplemental Fig. 3A). A scatterplot of SRTM and MA1 BPND (Supplemental Fig. 3B) for the same selected brain regions showed excellent correlation (r = 0.998), with slope of 0.746 and intercept close to zero (0.155). Lower SRTM-derived BPND values are not uncommon for many tracers, due to violation of SRTM assumptions (56).
The MA1-estimated BPND for the cortical tissue is noteworthy. The measured in vitro Bmax and KD for 3H-LSN3172176 binding in rhesus cortex are 843 ± 69 fmol/mg of protein (843 ± 69 nM) and 8 ± 3 nM (n = 3), respectively (38), yielding an in vitro BP (=Bmax/KD) value of 105.4. The average VND calculated from all 4 blocking scans (2 with scopolamine and 2 with AZD6088) in this study was 6.3 ± 0.8 mL/cm3, and fp was 0.41 ± 0.03. As BPND = fND*Bmax/KD and fND = fp/VND = 0.065, the in vitro BPND for rhesus cortex would be 6.86, which is in good agreement with the in vivo BPND values for the frontal (5.33), occipital (4.02), and temporal (5.01) cortices estimated with PET (Table 1).
DISCUSSION
We presented the synthesis and evaluation of a first M1 mAChR-selective PET radiotracer, 11C-LSN3172176. The ligand was discovered by Lilly (35,38) in ex vivo ligand binding assays using liquid chromatography–mass spectrometry (LC-MS/MS) (57–59). 11C-LSN3172176 was reliably produced in good radiochemical yield, high radiochemical and chemical purity, and high molar activity, using the palladium catalyzed C-11C Suzuki cross-coupling reaction (49) between 11C-methyl iodide and the 2-oxoindolin-6-yl boronic acid precursor.
11C-LSN3172176 displayed good pharmacokinetic and imaging characteristics in rhesus monkeys: high brain uptake, with an SUVpeak of 4–9.5 in the striatal and cortical tissues, and low uptake in the cerebellum, brain stem, and pons. Time–activity curves were well fitted by the MA1 (t* = 30) to produce stable measures of regional VT: highest in the basal ganglia, frontal cortex, and hippocampus, with low VT in the cerebellum. PET images were of high quality, and tissue kinetics were suitable for an 11C-labeled tracer, with high fp that can be measured reliably. As predicted from in vitro binding experiments (38), uptake in the monkey brain was seen in all M1 mAChR-rich brain regions similar to the known distribution reported for mouse, rat, and rhesus monkey (3,26,60). High specific binding was also reflected in the BPND estimates of 4–8.5. The specificity of 11C-LSN3172176 binding to mAChRs was demonstrated by pretreatment with scopolamine, which reduced 11C-LSN3172176 VT values to levels indistinguishable from the cerebellum, resulting in 98.5% occupancy. Selectivity for M1 mAChR was demonstrated by blocking of tracer uptake with the M1-selective partial agonist AZD6088 in a dose-dependent manner, reducing VT values across all brain regions to fairly homogeneous levels on preblocking with 2 mg/kg of AZD6088. The lowest VT was found in the cerebellum and brain stem, with baseline VT values of 8.1 and 7.7 mL/cm3, respectively. The average VND value of 6.3 ± 0.8 mL/cm3 derived from the blocking scans was in good agreement with the average baseline VT in the cerebellum, indicating that the cerebellum may be suitable as a reference region for 11C-LSN3172176. This is in line with previous reports that the cerebellum is devoid of mAChRs (51,52). The small difference in cerebellum between baseline and blocking scans is likely attributable to partial-volume averaging of cortical uptake into the cerebellum region in the baseline scan. To confirm this, we created a region of interest in the inferior portion of the cerebellum and measured the VT values in control and blocking scans. In this inferior region, we found no difference between baseline VT (6.3 ± 1.3) and postblocking VT (6.8 ± 1.0) values, further supporting the utility of the cerebellum as a reference region.
CONCLUSION
We have performed the synthesis and preclinical evaluation of the novel M1 mAChR-selective radioligand 11C-LSN3172176 and demonstrated its suitability as a PET tracer for quantifying central M1 mAChR in nonhuman primates. 11C-LSN3172176 displays high levels of regional uptake and appropriate kinetics in rhesus monkey brain, as well as high regional specific binding signals. Therefore 11C-LSN3172176 was advanced to human studies for further evaluation.
DISCLOSURE
Research support was provided by Eli Lilly and Co. At the time this work was conducted, Nancy Kant and Cynthia Jesudason were employees of Eli Lilly. No other potential conflict of interest relevant to this article was reported.
Acknowledgments
We thank the staff of the Yale PET Center for their expert assistance.
Footnotes
Published online Feb. 7, 2019.
- © 2019 by the Society of Nuclear Medicine and Molecular Imaging.
REFERENCES
- Received for publication October 17, 2018.
- Accepted for publication December 29, 2018.


Jump to section
Related Articles
Cited By...
- No citing articles found.