


Abstract
The purpose of this study was to assess image quality and quantitative brain PET across a multicenter consortium. Methods: All academic centers and children’s hospitals in the Pediatric Brain Tumor Consortium (PBTC) scanned a phantom developed by the Society of Nuclear Medicine and Molecular Imaging Clinical Trials Network (SNMMI CTN) for the validation of brain PET studies associated with clinical trials. The phantom comprises 2 separate, fillable sections: a resolution/uniformity section and a clinical simulation section. The resolution/uniformity section is a cylinder 12.7 cm long and 20 cm in diameter; spatial resolution is evaluated subjectively with 2 sets of rods (hot and cold) of varying diameter (4.0, 5.0, 6.25, 7.81, 9.67, and 12.2 mm) and spacing (twice the rod diameter). The clinical simulation section simulates a transverse section of midbrain with ventricles and gray and white matter compartments. If properly filled, hot rods have a 4:1 target-to-background ratio, and gray–to–white matter sections have a 4:1 ratio. Uniformity and image quality were evaluated using the SUV in a small volume of interest as well as subjectively by 2 independent observers using a 4-point scale. Results: Eleven PBTC sites scanned the phantom on 13 PET scanners. The phantom’s complexity led to suboptimal filling, particularly of the hot rod section, in 5 sites. The SUV in the uniformity section was within 10% of unity on only 5 of 13 scanners, although 12 of 13 were subjectively judged to have very good to excellent uniformity. Four of 6 hot rods were discernable by all 13 scanners, whereas 3 of 6 cold rods were discernable by only 5 scanners. Four of 13 scanners had a gray–to–white matter ratio between 3.0 and 5.0 (4.0 is truth); however, 11 of 13 scanners were subjectively judged to have very good or excellent image quality. Conclusion: Eleven sites were able to image a powerful phantom developed by the SNMMI CTN that evaluated image uniformity, spatial resolution, and image quality of brain PET. There was considerable variation in PET data across the PBTC sites, possibly resulting from variations in scanning across the sites due to challenges in filling the phantom.
Clinical trials using 18F-FDG PET/CT can be challenging in the pediatric population since small numbers of eligible patients make it difficult to obtain sufficient data for robust statistical analysis. Multicenter trials help to mitigate this issue. Formed by the National Cancer Institute in 1999, the Pediatric Brain Tumor Consortium (PBTC) encompasses a group of 11 North American children’s hospitals and academic centers involved in the treatment of primary brain tumors in children (1). Imaging data acquired at participating institutions are electronically transferred to the PBTC Operations, Biostatistics, and Data Management Core and then to the PBTC Neuroimaging Center for analysis (2). To compare these images effectively, it is important to understand the variability in PET metrics across multicenter clinical trials.
PET metrics are sensitive to several technical and patient-related factors (3,4). To address this variability, all sites are instructed to follow standardized operating procedures. These protocols provide guidance on patient preparation, 18F-FDG administration, image acquisition and processing parameters, and other considerations depending on the particular goals and design of each particular study (5–7). Consistency of PET data is maintained by adherence to a quality assurance program, which includes daily scans of a uniform radioactive source as well as quarterly normalization, calibration, and preventive maintenance. Within the PBTC, there have been several standardization initiatives beyond routine PET quality control. Initially, a uniformity phantom was used to ensure consistent background quantitation. In 2008, the use of an American College of Radiology–type PET phantom with 68Ge/68Ga hot features was pioneered, and the results were reported (8).
To provide a standardized means of assessing image quality and consistency between sites within multicenter trials, the Clinical Trials Network (CTN) of the Society of Nuclear Medicine and Molecular Imaging (SMMMI) introduced a phantom imaging program in 2005. The imaging of standardized phantoms was used, in part, to validate clinical sites for inclusion in multicenter trials using 18F-FDG PET/CT. More recently, a PET brain qualification phantom was developed.
The aim of this study was to evaluate the variability in PET metrics across sites within the PBTC. We performed this evaluation using the SNMMI CTN brain qualification phantom specifically developed for the validation of clinical sites acquiring brain PET studies associated with clinical trials.
MATERIALS AND METHODS
Phantom Description
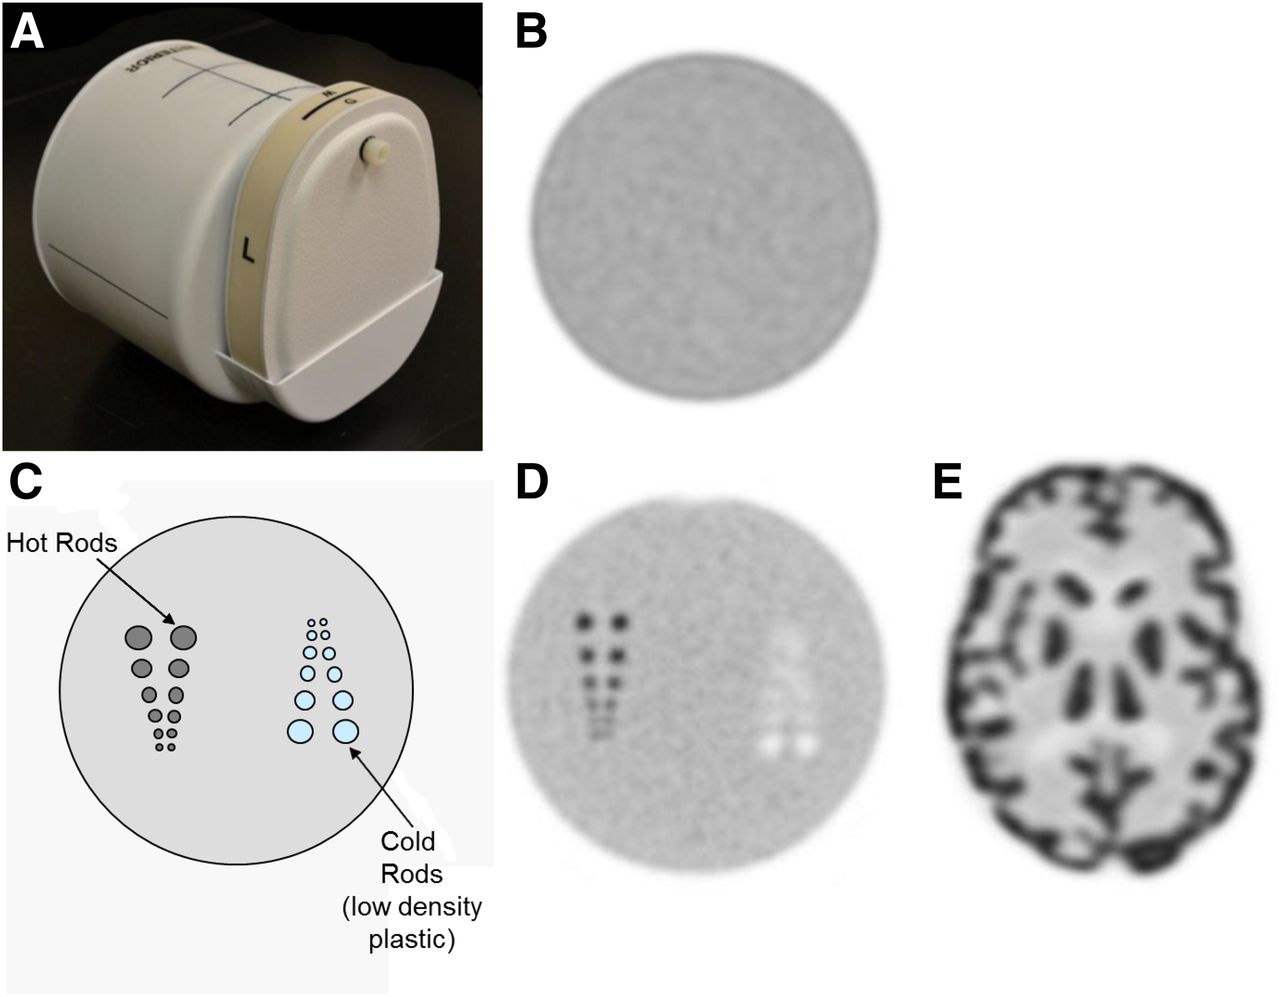
The phantom comprised 2 separate, fillable sections: a resolution/uniformity section and a 2-dimensional clinical simulation section mimicking a midbrain transverse section. The resolution/uniformity section was a cylinder (12.7 cm long, 20 cm in diameter, Fig. 1A). The resolution portion was 6.4 cm long, and the remainder provided a uniform portion to evaluate potential artifacts and quantify uniformity as measured by the average SUV (SUVave) of the background (Fig. 1B). Spatial resolution was evaluated subjectively with 2 sets of rods (hot and cold, Figs. 1C and 1D). The pairs of rods had diameters of 4.00, 5.00, 6.25, 7.81, 9.67, and 12.20 mm, with center-to-center spacing equal to twice the rod diameter. If properly filled, the hot rods had a 4:1 target-to-background ratio. The smallest hot and cold rod pairs discernable as separate were recorded as a measure of spatial resolution.

SNMMI CTN qualification phantom for PET brain imaging. (A) Exterior of phantom with uniformity/resolution section to left and clinical simulation section to right. (B) Image from uniformity section. (C) Schematic of resolution section. (D) Image of resolution section. (E) Image of clinical simulation section.
The clinical simulation section (Fig. 1E) was modeled using a patient MRI scan and consisted of simulated gray matter including the cerebral cortex and central brain, white matter, and ventricles. The phantom was designed such that the gray matter appeared 4 times hotter than the white matter, with no activity in the ventricles.
The compartments of the phantom were filled with 18F-FDG in concentrations that, at the time of imaging, provided the uniformity and white matter sections of the phantom with 5.18 kBq/cm3 (0.14 μCi/cm3) and the gray matter and hot rod sections of the phantom with 4 times that concentration, or 20.72 kBq/cm3 (0.56 μCi/cm3), creating a 4:1 hot rod–to–background ratio and a 4:1 gray–to–white matter ratio.
Image Acquisition
One of 2 identical SNMMI CTN PET brain qualification phantoms was sent to each PBTC site with PET capability along with a handbook (Supplemental Appendix 1; supplemental materials are available at http://jnm.snmjournals.org) that described the filling, imaging, and emptying of the various parts of the phantom. After filling the phantom with 18F-FDG, the sites obtained 2 acquisitions: a first acquisition for 6 min, the time used by each site for PBTC brain 18F-FDG PET/CT studies, and a second for 30 min. Other than the duration of the scan, the 2 acquisitions were identical, using the CT and PET acquisition parameters routinely used by the site for research 18F-FDG PET/CT brain studies. The sites were instructed to reconstruct the phantom data just as they would a PBTC research 18F-FDG PET/CT brain study. For the clinical investigations within the PBTC, sites are instructed to acquire, process, and reconstruct FDG PET brain scans according to their clinical practice, including the application of standard corrections for scatter, random coincidences, and count rate losses as recommended by the manufacturer of their specific scanner. Standard quality control of the dose calibrator and cross-calibration to the scanner were confirmed for each site. On completion of the study, the sites submitted a scanner equipment questionnaire (Supplemental Appendix 1) describing the scanner and the dose calibrator used for the studies. The sites were also asked to report whether the 18F calibration factor for the dose calibrator had been adjusted. A phantom imaging form was also sent that defined the acquisition concentrations used to fill the phantom as well as the CT and PET acquisition parameters (for both PET acquisitions). The resultant reconstructed images were sent to the PBTC Operations, Biostatistics, and Data Management Core and forwarded to the Neuroimaging Center. The phantom was then emptied as instructed, packaged, and shipped to the next PBTC site.
Evaluation of Phantom Data
A central analysis of the objective image parameters was performed. For the uniformity section, this included calculating the SUVave over a 1- to 2-cm area, the coefficient of variation (COV, SD normalized by the mean of the pixel values as a percentage) across 9 slices, and the maximum slice deviation. For the resolution section, this included a measure of the rod contrast. For the clinical simulation section, this included a measure of the SUVmax in the gray matter, SUVave in the white matter, and the gray–to–white matter ratio. Placement of the regions of interest (ROIs) for these assessments is shown in Figure 2.
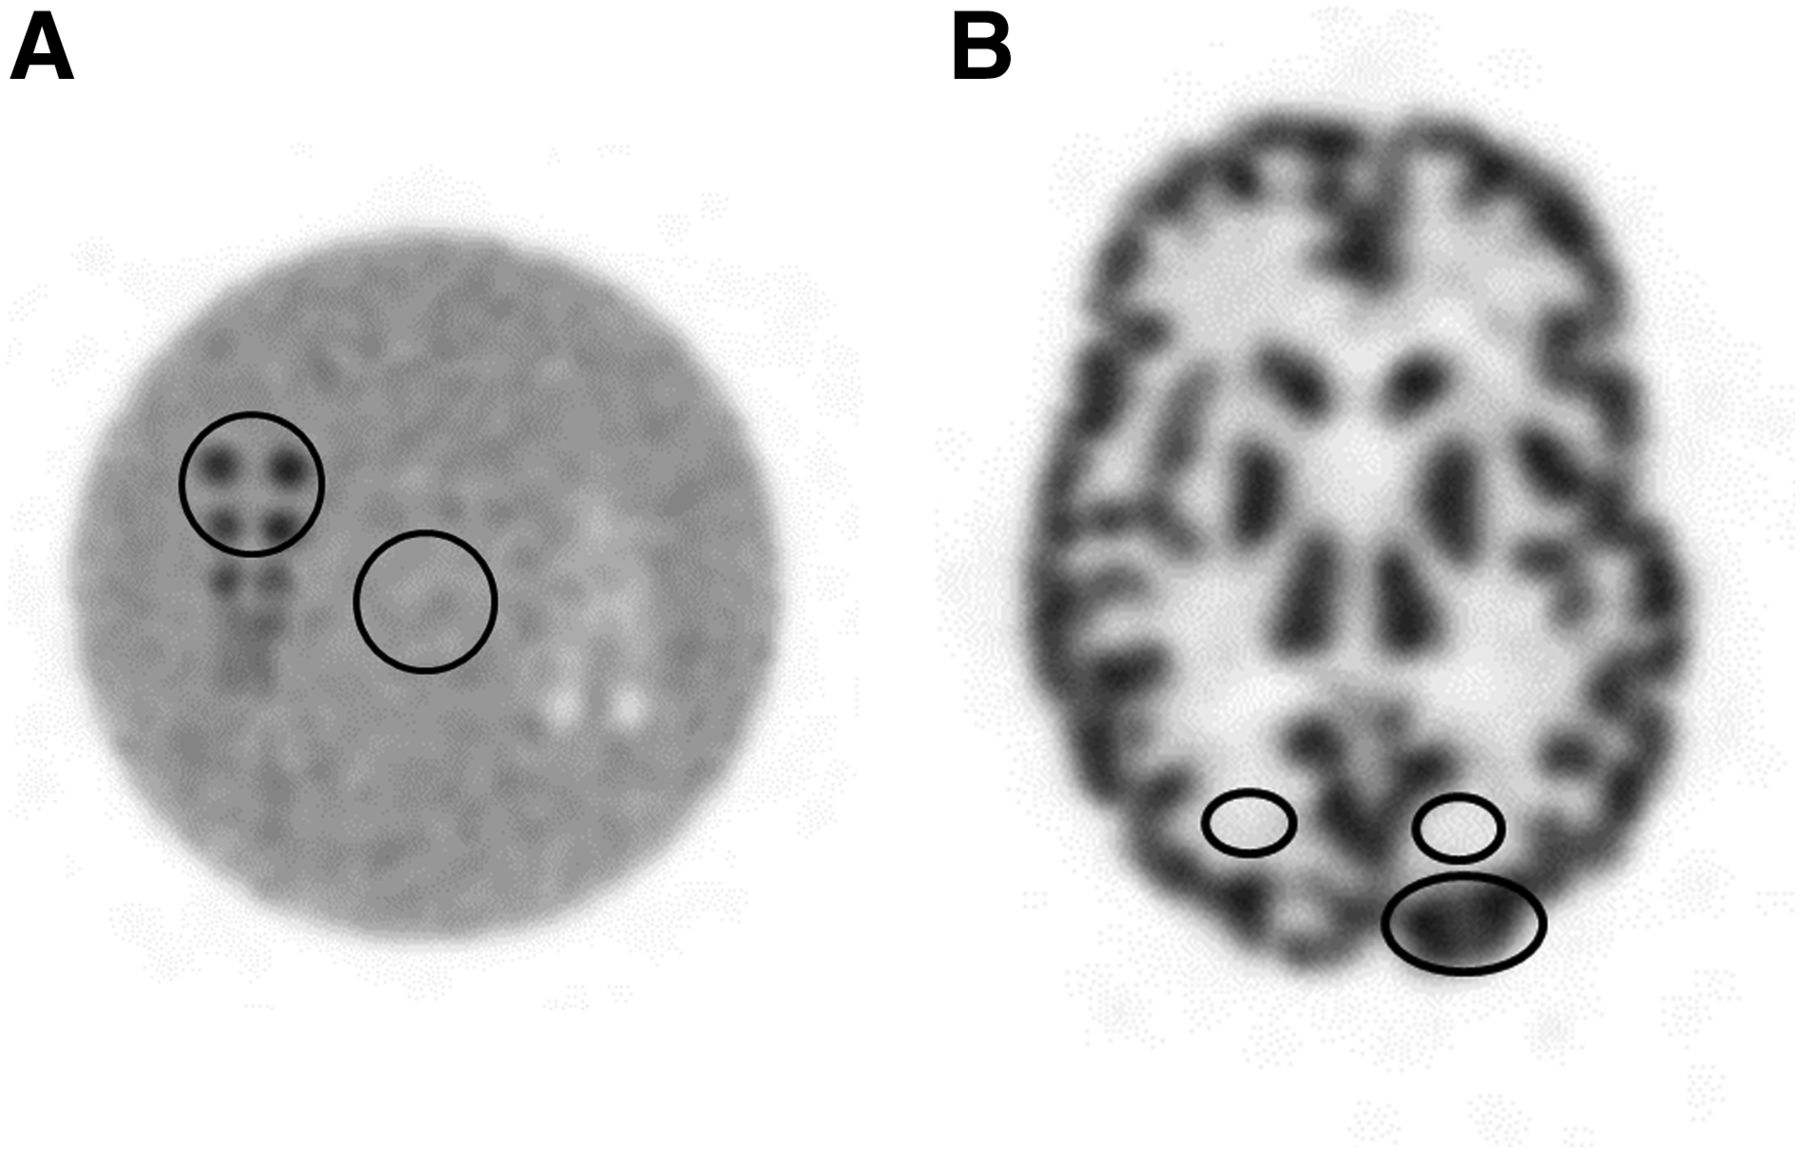
Resolution and clinical simulation phantom with ROIs drawn. (A) Resolution section. (B) Clinical simulation section.
The image quality of the phantom was judged subjectively by 2 independent observers using a 4-point scale (1, excellent, to 4, unacceptable), and the results were then averaged. This included grading of the uniformity for the 30-min acquisition, the numbers of cold and hot rods discerned as separate, and the subjective image quality of the clinical simulation section for both the 6-min and the 30-min acquisitions.
RESULTS
The phantom was imaged under controlled conditions on 13 PET scanners at 11 PBTC sites (Table 1). The vendors and models of the scanners are listed in Table 2. Since this project involved phantom rather than patient imaging, it did not require Internal Review Board approval at any of the sites. The phantom was relatively complex in design and challenging to fill correctly given it had 4 ports to be filled with 3 different activity concentrations. For the resolution/uniformity section there was 1 filling port for hot rods and 1 for background. Several sites had difficulty filling the hot rods appropriately, leading to only a portion of the rods having activity. For the clinical simulation section there was 1 filling port for gray matter and 1 for white matter. This complexity led to suboptimal filling in 5 of the 11 sites. The fact that several sites had difficulty led us to believe that the complexity of the phantom contributed to the high percentage of cases of suboptimal filling.
Participating Institutions of PBTC at Time of Phantom Experiment
Camera Models
Uniformity Section
The uniformity section was judged both objectively and subjectively (Table 3). The SUVave across 9 slices in the uniformity section ranged from 0.75 to 1.84 with a mean of 1.14. This value should be unity. Only 5 of the 13 scanners had an SUVave within 10% of unity.
Evaluation of Uniformity Section
However, 12 of the 13 scanners were subjectively judged to demonstrate very good or excellent uniformity. The COV across 9 slices ranged from 3.38% to 7.32% with a mean of 5.3%. All 13 scanners had a COV value below 10%, and 5 of 13 were below 5%. Eleven of the 13 scanners demonstrated a maximum slice deviation less than 5%. Figure 3 shows a uniform slice from 2 scanners, 1 judged to have excellent uniformity and the other judged to be good.
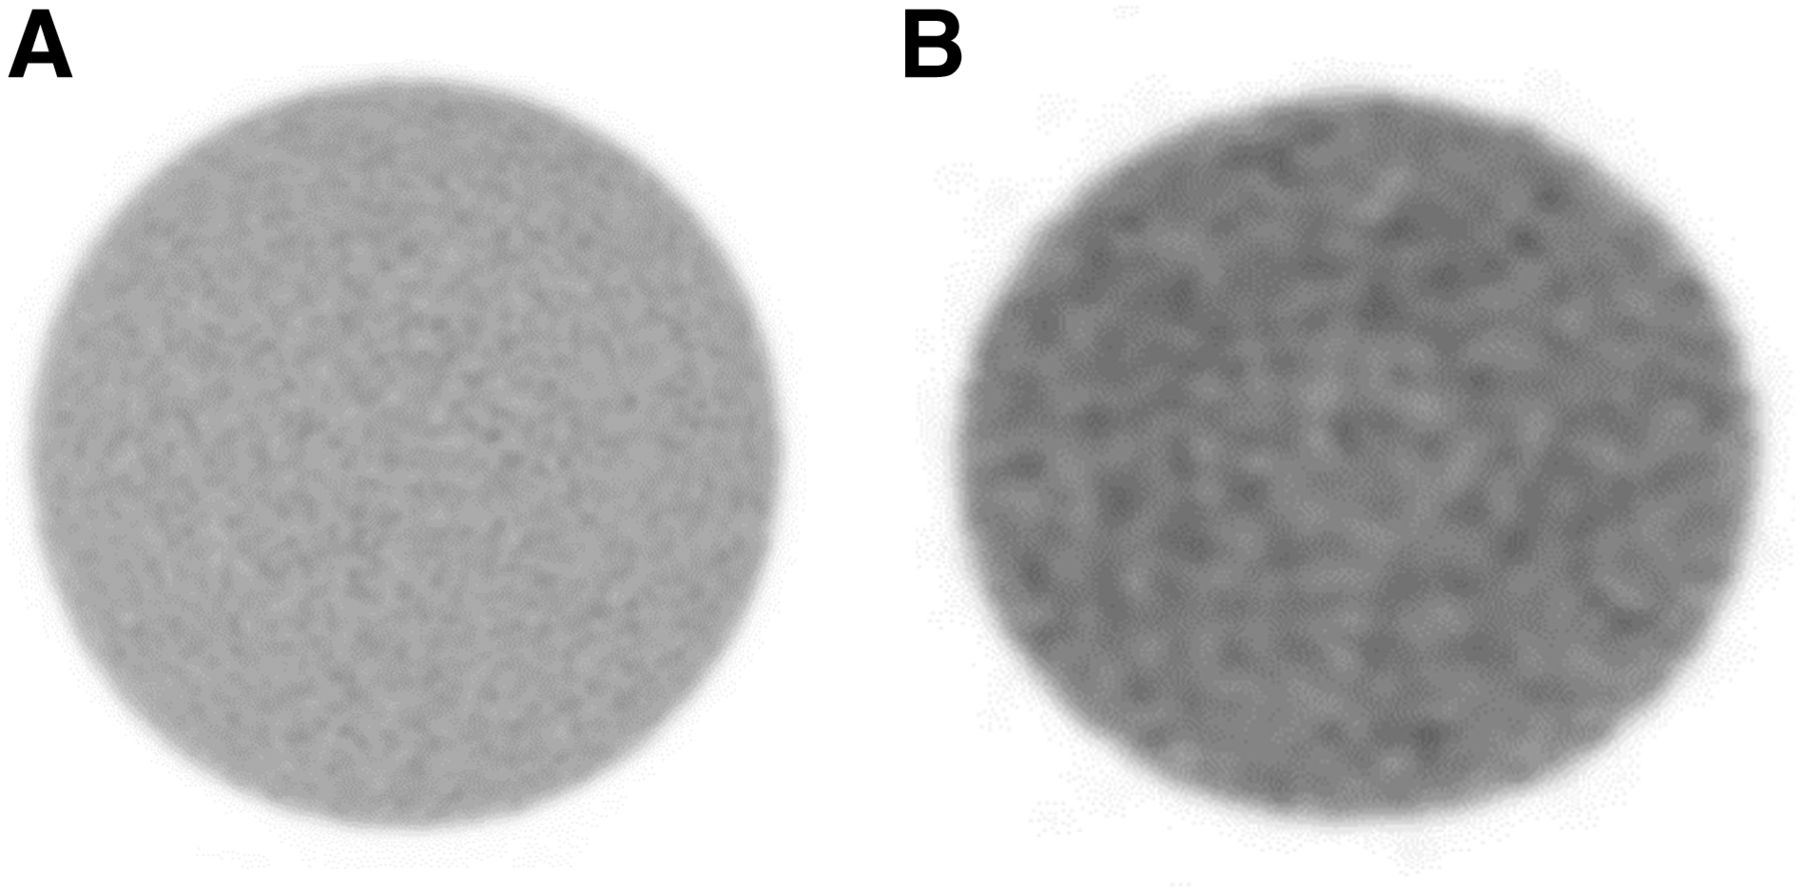
Images from uniformity section. (A) Imaged judged excellent. (B) Image judged good.
Resolution Section
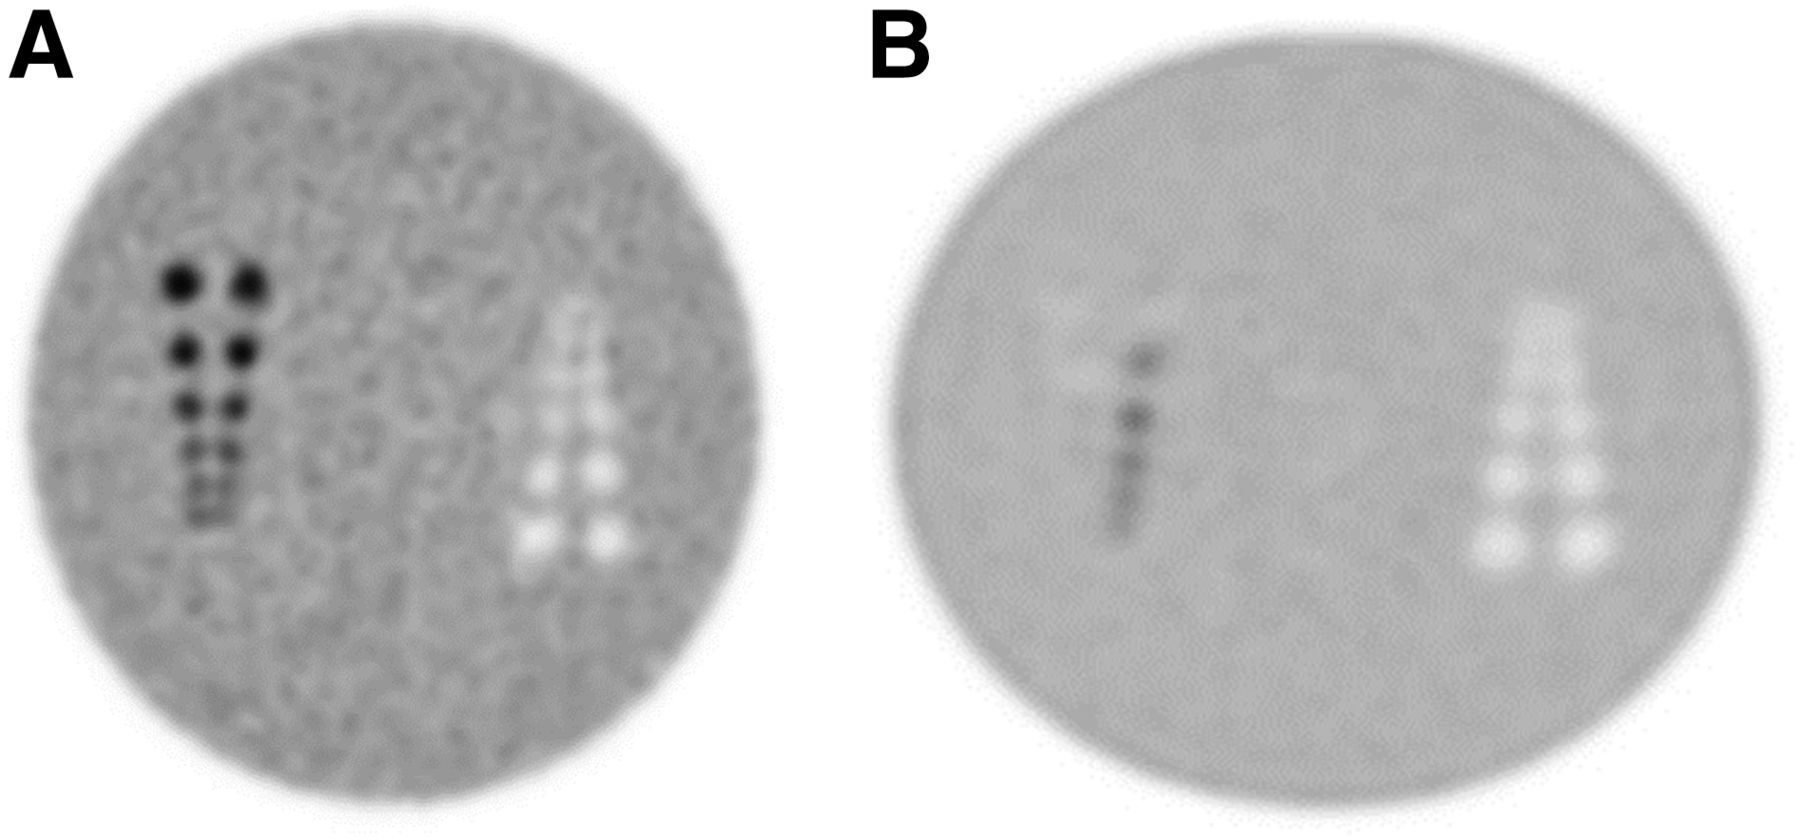
The suboptimal filling described above was most notable in the resolution section, where only a portion of the hot rod section was filled in several instances (Fig. 4). The subjective grading of the resolution section is presented in Table 4. In all 13 scanners, at least 1 of the 2 observers could discern 4 of the 6 hot rods, whereas in only 5 scanners could 5 of the 6 hot rods be seen. Four of the 13 scanners could discern at least 3 of the 6 cold rods. The rod contrast could not be calculated in 1 case due to suboptimal filling. In 10 of the remaining 12 scanners, the rod contrast was measured to be greater than 2.5.

Images from resolution section. (A) Image with proper filling. (B) Image with improper filling.
Evaluation of Resolution Section
Clinical Simulation Section
The objective and subjective rankings of the clinical simulation section are shown in Table 5. The SUVmax of the gray matter had a range from 3.06 to 8.25 with a mean of 4.50. This value should be 4.00. All 13 scanners had a gray matter SUVmax greater than 3.00. The SUVave in the white matter had a range of 0.28 to 2.57, with a mean of 1.13 (should be unity). Only 1 of the scanners demonstrated a white matter value between 0.90 and 1.10, with all other values being outside this range. There was considerable variability between scanners regarding the gray–to–white matter ratio, with a range of 1.75 to 15.39 and a mean of 5.60 (should be 4.00). The COVs for the gray matter SUVmax, white matter SUVave, and gray–to–white matter ratio are 28.8%, 60.4%, and 68.0%, respectively. Thus, the bulk of the variation in the gray–to–white matter ratio results from variability of the white matter activity.
Evaluation of Clinical Simulation Section
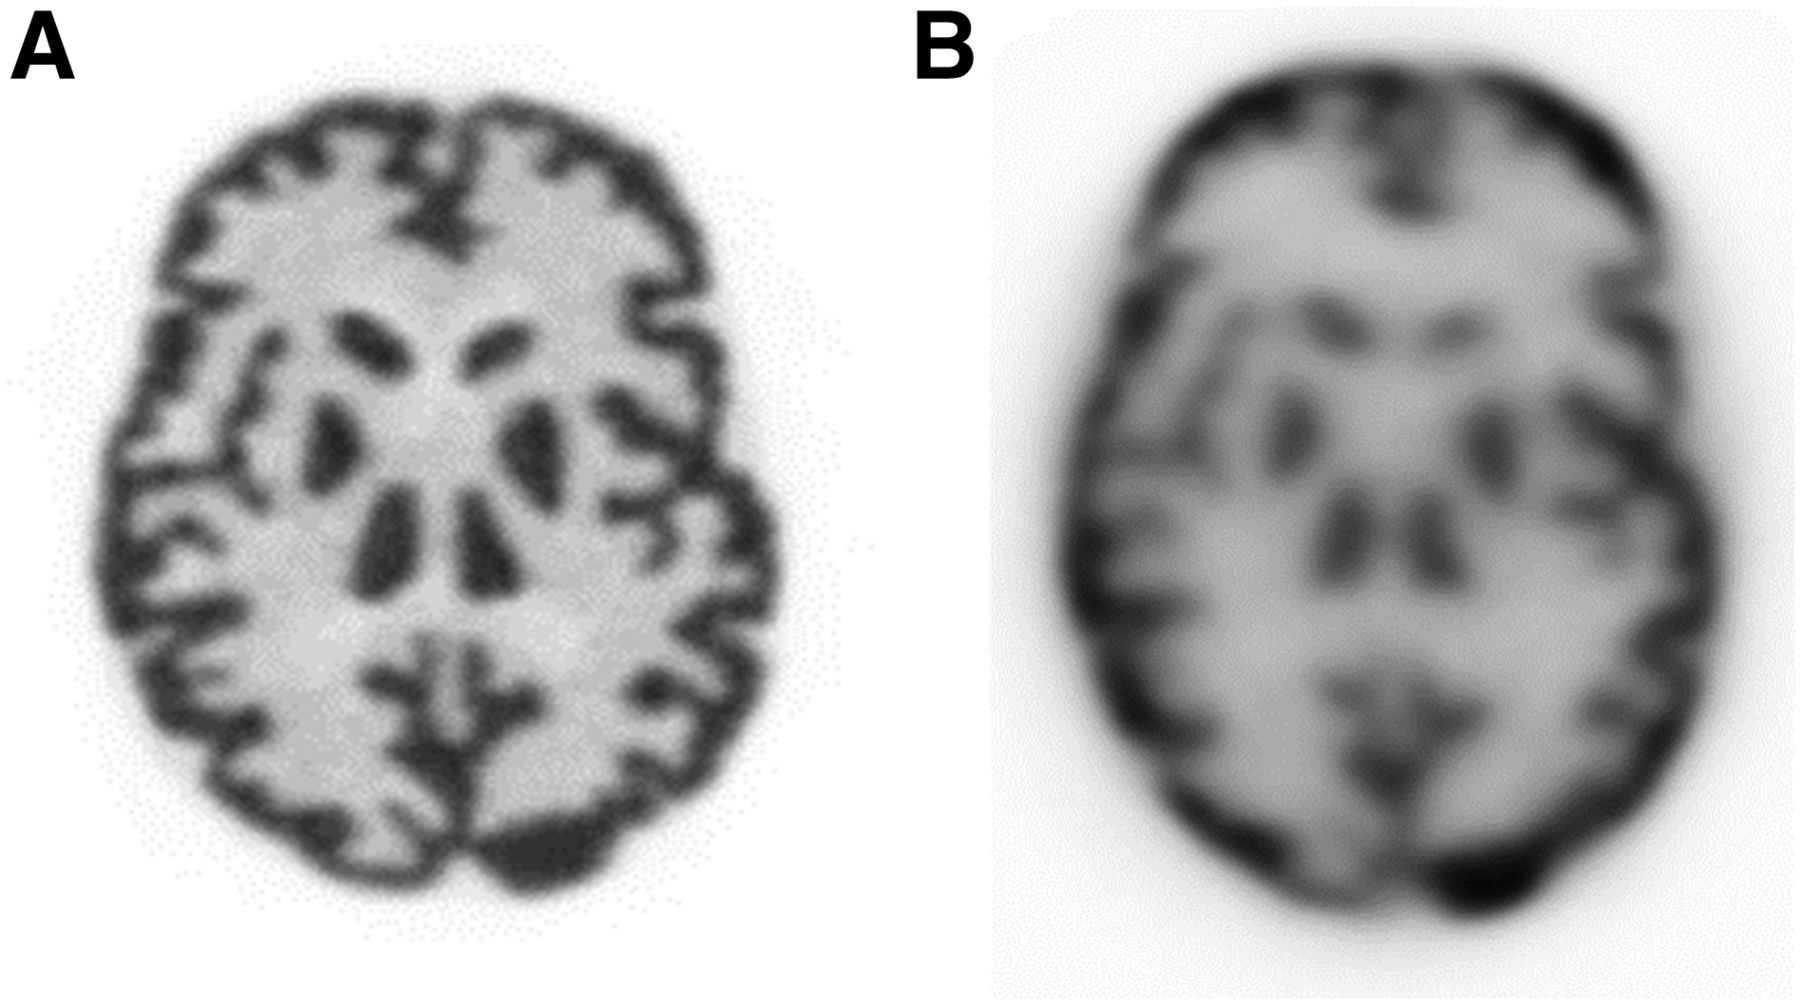
The subjective image quality was rated separately for the 6-min and 30-min acquisitions. For both the 6-min and the 30-min image quality, images from 11 of 13 scanners were deemed to be very good or excellent by at least 1 of the observers. For the 6-min images, 1 of the observers judged the images to be good in 6 cases and unacceptable in 1 case. For the 30-min images, 11 of 13 were judged to be very good to excellent, 1 was judged to be good, and 1 was deemed unacceptable. Example 30-min images are presented in Figure 5.

Images from clinical simulation section. (A) Imaged judged excellent. (B) Image judged unacceptable.
DISCUSSION
18F-FDG PET/CT studies are often evaluated both subjectively by visual inspection and objectively using quantitative parameters. Images that are interpreted visually may require less stringent reconstruction standardization across institutions than what is required when quantitative PET analyses are performed. Ultimately, different levels of standardization are needed depending on the intended analyses.
Quantitative PET analyses, commonly performed in clinical studies today, are based on the SUV, a metric of 18F-FDG uptake within a tumor normalized by the radiotracer administered activity and patient body weight after a certain uptake time. The SUV is significantly affected by many factors, both physiologic and technical, including scan acquisition, image reconstruction, and uptake time (3). Some of these factors may be mitigated using a relative SUV or ratio of uptake between different ROIs. However, in cases where an absolute SUV is desired, these factors can become significant. For example, image reconstruction parameters alone have been shown to have an effect of up to 30% on the SUV (9–13). The need for standardization in PET has been recognized as key in this situation, particularly regarding image acquisition, reconstruction, and quality control of the instrumentation (5–7). Takashi et al. showed that standardized protocols reduced the variation in the SUV between different scanners from 47% to 23% (14), whereas Boellard et al. observed this could be reduced as low as 10% (15). Our earlier work within the PBTC indicated that a central analysis of the SUV data reduced the variable range by at least a factor of 2 (from 29.9%–42.8% to 7.7%–23.2%) (8). Several more recent studies have confirmed variability in quantitative parameters on the order of 10%–15% (16–18).
Differences in scanner performance and the reconstruction algorithms between sites are difficult to eliminate as these are often specific to the scanner hardware and software that is available. Recently, insight into these technical limitations was provided using the National Electrical Manufacturers Association NU-2 Image Quality phantom and the 3-dimensional Hoffman anthropomorphic brain phantom (19). In multicenter clinical trials it is important for image resolution to be matched as closely as possible across sites since it is difficult to correct for these differences after the fact. Fortunately, harmonization across different PET scanners has been well studied (20–23). To this end, the make and model of scanners in multicenter clinical trials need to be recorded (24–26). Daily quality control routines and cross calibration of the PET scanner with the dose calibrator is also necessary.
Further, all scanners in the trial should undergo a qualification process by the same mechanism before scanning the first patient and throughout the trial. Therefore, standardized phantom experiments are needed so that differences between scanners can be ascertained and corrected for (27–29).
We found variation in precision of quantitative PET metrics across the PBTC sites. The phantom we used was unique. With 1 acquisition, spatial resolution, quantitative accuracy, uniformity, and clinical image quality could be evaluated. However, as discussed in the Results section, the phantom was also relatively more complex in design and filling instructions than the conventional American College of Radiology PET phantom or even the 3-dimensional Hoffman brain phantom. In our phantom, 4 ports needed to be filled with 3 different activity concentrations. This complexity led to the phantoms being suboptimally filled in several instances and likely contributed, at least in part, to the variability in results. Indeed, there was considerable variability in quantitation, both in the background region uniformity and with respect to the gray and white matter contrast and gray–to–white matter ratio. Since several sites had filling difficulties, we concluded that the phantom’s complexity contributed to the suboptimal filling. In the context of standardization for a clinical investigation, it is essential that the phantom be prepared in a consistent manner, which was not the case with this phantom. We considered resending the phantom to those sites with suboptimal filling. However, it took nearly a year to circulate the phantom through the 11 sites and there was concern that further delay would compromise the comparability of the results.
Less than 40% of the scanners had an SUVave within 10% of unity. The SUVmax of the gray matter had a range from 3.06 to 8.25, almost a 3-fold variation across 13 scanners. Less than 10% of scanners demonstrated a white matter SUVave within 10% of the expected value, and the COV for the gray matter SUVmax, white matter SUVave, and gray–to–white matter ratio was 28.8%, 60.4%, and 68.0%, respectively. However, 12 of the 13 scanners were subjectively judged to demonstrate very good or excellent uniformity. Further, the overall visual inspection of image quality of the clinical simulation section was very good to excellent, although there were several examples of lower image quality. As might be expected, standardization can be more relaxed with subjective visual assessment than with absolute quantitation.
A limitation of our study is that we could not distinguish variability quantitation resulting from suboptimal phantom filling, inadequate scanner calibration, or improper data acquisition/processing. A simpler phantom may have made these differences easier to discern but may have required the acquisition of multiple phantoms to attain the same data. The use of multiple phantoms is certainly challenging within the context of a multicenter trial. Variations in performance within multicenter clinical trials can be substantial. The use of phantoms can help to highlight the extent of the differences between sites and potentially allow for compensation for these differences. If a more complex phantom is to be used, considerable training regarding correct phantom preparation is essential.
CONCLUSION
This was a powerful phantom that could evaluate uniformity, resolution quantitative accuracy, and clinical image quality with a single acquisition. However, the phantom was complex in design and filling instructions, leading to suboptimal filling in several instances. There was considerable variability in quantitation in several aspects of the phantom, and it was difficult to determine whether this variability resulted from suboptimal filling, inadequate scanner calibration, or poor image quality.
DISCLOSURE
This work was supported by the SNMMI CTN and PBTC grant (U01 CA 81457-18, Ira Dunkel of Memorial Sloan Kettering Cancer Center and Arzu Onar-Thomas of St. Jude Children’s Research Hospital, principal investigators). No other potential conflict of interest relevant to this article was reported.
Acknowledgments
We thank Keith Bigham of Medical Designs, Inc., for his work to design, construct, and test this innovative phantom. We also recognize the individuals at the sites within the PBTC that acquired the phantom study and submitted the results for this study: Steven Laffin, Boston Children’s Hospital; Christina Sammet, Ann & Robert H. Lurie Children’s Hospital of Chicago; Daryl Graham, Children’s Hospital Los Angeles; Timothy Turkington, Duke University; Sam Brady, St. Jude Children’s Research Hospital; Craig Barker, National Institutes of Health Clinical Center; Jayesh Patel, Lucile Packard Children’s Hospital at Stanford; Michael Czachowski, UPMC Children’s Hospital of Pittsburgh; Ken Elliott, Texas Children’s Hospital; Lisa Lemen, Cincinnati Children’s Hospital Medical Center; and C. Ross Schmidtlein, Memorial Sloan Kettering Cancer Center. Lastly, we thank Ira Dunkel, MD, of Memorial Sloan Kettering Cancer Center and the Principal Investigator of the PBTC for his support during this project.
Footnotes
Published online Dec. 7, 2018.
- © 2019 by the Society of Nuclear Medicine and Molecular Imaging.
REFERENCES
- Received for publication September 5, 2018.
- Accepted for publication November 14, 2018.


