


Abstract
The prognosis of patients with esophageal carcinoma remains dismal despite ongoing efforts to improve treatment options. For locally advanced tumors, several randomized trials have shown the benefit of neoadjuvant chemoradiation followed by surgery compared with surgery alone. The aim of this exploratory study was to evaluate the prognostic value of different baseline PET parameters and their potentially additional prognostic impact at the end of neoadjuvant radiochemotherapy. Furthermore, the standardized uptake ratio (SUR) as a new parameter for quantification of tumor metabolism was compared with the conventional PET parameters metabolically active tumor volume (MTV), total lesion glycolysis (TLG), and SUV, taking into account known basic parameters. Methods: 18F-FDG PET/CT was performed on 76 consecutive patients (60 ± 10 y old, 71 men) with newly diagnosed esophageal cancer before and during the last week of neoadjuvant radiochemotherapy. MTV of the primary tumor was delineated with an adaptive threshold method. The blood SUV was determined by manually delineating the aorta in the low-dose CT scan. SURs were computed as the scan time–corrected ratio of tumor SUVmax and mean blood SUV. Univariate Cox regression and Kaplan–Meier analysis with respect to locoregional control (LRC), freedom from distant metastases (FFDM), and overall survival (OS) was performed. Additionally, the independence of PET parameters from standard clinical factors was analyzed with multivariate Cox regression. Results: In multivariate analysis, 2 parameters showed a significant correlation with all endpoints: restaging MTV and restaging SUR. Furthermore, restaging TLG was prognostic for LRC and FFDM. For all endpoints, the largest effect size was found for restaging SUR. The only basic factors remaining significant in multivariate analyses were histology for OS and FFDM and age for LRC. Conclusion: PET provides independent prognostic information for OS, LRC, and FFDM in addition to standard clinical parameters in this patient cohort. Our results suggest that the prognostic value of tracer uptake can be improved when characterized by SUR rather than by SUV. Overall, our investigation revealed a higher prognostic value for restaging parameters than for baseline PET; therapy adjustments would still be possible at that time. Further investigations are required to confirm these hypothesis-generating results.
The prognosis for patients with esophageal carcinoma remains poor despite ongoing efforts to improve treatment options. In early-stage disease, surgical resection is the mainstay of therapy. For locally advanced esophageal carcinoma, randomized trials have shown the benefit of neoadjuvant radiochemotherapy followed by surgery, compared with surgery alone (1,2).
Although this improvement is clinically highly important, the magnitude of the effect of neoadjuvant treatment has been modest, suggesting heterogeneity of response in individual patients. Therapy outcome prediction based on basic clinical parameters alone is not convincing in individual patients with esophageal carcinoma. One potential route for predictive improvement is to combine optimized quantitative assessment of the additional functional information provided by 18F-FDG PET with proven basic parameters (3).
The most frequently used PET parameter for prognostic investigations is the SUV. Some studies have shown that pretherapeutic SUV has the potential to provide prognostic information in addition to other parameters (e.g., histology, grading, T- and N-stage, and age) in patients with esophageal carcinoma treated with neoadjuvant radiochemotherapy followed by surgery (4). In contrast, other studies have been published showing only a trend for significance of SUV or even no prognostic impact on overall survival (OS) or other clinical endpoints (5). One possible explanation for the unsatisfactory performance of SUV so far might be the adverse effects of well-known shortcomings of SUV quantification, especially in the clinical setting. The scan time dependence of this parameter, interstudy variability of the arterial input function, and susceptibility to errors in scanner calibration (6–8) confound the reliability of the SUV as a surrogate of the metabolic uptake rate Km of the tumor’s 18F-FDG accumulation (and thus its glucose consumption). Therefore, the tumor-to-blood standardized uptake ratio (SUR) has been investigated as a new, promising parameter during the last few years. This ratio of tumor SUV to blood SUV has been shown to correlate better with Km (derived via Patlak analysis of dynamic PET scans) than does SUV alone (9). In addition, a reliable correction of SUR for the variability of the uptake time is possible by converting the measured uptake values to a preselected fixed scanning time point (10). This scan-time–normalized SUR removes several of the shortcomings of SUV, decreased test–retest variability (11), and provided independent prognostic information in patients with esophageal carcinoma treated with definitive radiochemotherapy (12).
Hence, various questions arise for patients with esophageal carcinoma undergoing trimodality treatment. For example, what is the prognostic value of the different baseline PET parameters, particularly metabolically active tumor volume (MTV), which is theoretically the most important radiobiological parameter (also considering the difficulties of CT-based delineation in the case of esophageal carcinoma)? Furthermore, what additional prognostic value is to be expected of these parameters at the end of neoadjuvant radiochemotherapy? At that point, changes in therapeutic concepts are still possible, such as avoiding a highly risky surgery in a patient with a poor prognosis, which would have significant clinical consequences. Therefore, all baseline PET parameters, restaging measurements, and fractional differences were investigated in the present study.
A further aim of this exploratory study was to evaluate the prognostic value of SUR as a new parameter for quantification of tumor metabolism in comparison to the conventional PET parameters MTV, total lesion glycolysis (TLG), and SUV. Finally, the determination of specific scores and their prognostic value for therapy outcome in patients with esophageal carcinoma receiving neoadjuvant radiochemotherapy followed by surgery was investigated.
MATERIALS AND METHODS
Patient Characteristics
In total, 541 patients with esophageal carcinoma underwent 18F-FDG PET/CT imaging for staging from October 2005 to December 2014 at our institution. Among them, 298 patients were treated with palliative intent because of distant metastases or a synchronous second cancer diagnosed by PET; 116 received curative, definitive radiochemotherapy; and 51 had primary resection without other therapy. The remaining 76 consecutive patients with 18F-FDG PET/CT–staged esophageal carcinoma who received curative neoadjuvant radiochemotherapy were retrospectively analyzed.
Evaluation of the data was approved by the Institutional Ethics Committee, and before starting treatment, all subjects provided written informed consent to the use of their data for research.
Inclusion criteria were age greater than 18 y, histologically confirmed esophageal carcinoma, 18F-FDG PET/CT before and at the end (during the last week) of radiochemotherapy, no distant metastases, curative treatment intention, and a minimum follow-up of 2 y.
The median age of the patients was 58 y (range, 40–80 y), and most were male (93%). Table 1 summarizes the patient and tumor characteristics.
Patient and Tumor Characteristics
Treatment
The patients underwent 3-dimensional CT-planned conformal radiotherapy, receiving a total dose of 40 Gy applied as 2-Gy fractions, with a dose distribution compliant with report 50 of the International Commission on Radiation Units and Measurements (95%–107%). Gross tumor volume was defined as primary tumor and any supect lymph nodes on CT (short axis > 1 cm) or avid on 18F-FDG PET. The clinical target volume was obtained by expanding this volume using a margin of 1.5 cm (2–5 cm craniocaudally) and, after adjusting for anatomic boundaries, adding the elective lymph node stations. Thereafter, the volume was expanded to a planning target volume using institutional margins of 6–7 mm.
Irradiation started concurrently with the first chemotherapy cycle. For all patients, the chemotherapy consisted of 5-fluorouracil (intravenous administration of 3,000 mg/m2 over 96 h) and cisplatin (intravenous administration of 70 mg/m2 on day 1) in weeks 1 and 4 of the treatment. Seventy-five patients received both chemotherapy cycles; in 1 patient, only 1 cycle was applied.
All patients underwent surgery after neoadjuvant radiochemotherapy. In 64 patients, a complete resection was done; in 12 patients, surgery had to be discontinued for various reasons (e.g., aortic infiltration or cardiac arrhythmias).
18F-FDG PET/CT Protocol
All patients underwent a hybrid 18F-FDG PET/CT scan before treatment. A second scan was performed during the last week of radiochemotherapy. Scans (3-dimensional PET acquisition, 3-min emission per bed position) were performed with a Biograph 16 (Siemens Medical Solutions Inc.).
Data acquisition started 79.8 ± 22.8 min (range, 47–148 min) after injection of 177–406 MBq of 18F-FDG. All patients had fasted for at least 6 h before 18F-FDG injection. The serum glucose concentration measured before injection was 5.8 μmol/mL on average (range, 3.4–9.5 μmol/mL). Tomographic images were reconstructed using attenuation-weighted ordered-subset expectation maximization (4 iterations, 8 subsets, and a Gaussian filter of 5 mm in full width at half maximum).
PET Data Analysis
Region-of-interest (ROI) definition and ROI analyses was performed using ROVER software, version 3.0.29 (ABX). Here, we use ROI synonymously for VOI to denote a 3-dimensional volume of interest.
The MTV of the primary tumor was delineated in the PET data by an automatic algorithm based on adaptive thresholding considering the local background (13,14). The resulting delineation was inspected visually by an experienced observer masked to patient outcome. Lesions were corrected manually in 5 of 76 cases with low diffuse tracer accumulation. In 12 further cases, the primary tumor was not visible in the second PET scan. In these cases, a small ROI (<1 mL) was manually placed in the esophagus at the location depicted by CT and/or based on information from endoscopy. For the delineated ROIs, we computed SUVmax, MTV, and TLG (TLG = MTV × SUVmean).
The arterial blood SUV for computation of SURs was determined as described in the supplemental material (15,16) (supplemental materials are available at http://jnm.snmjournals.org).
Lesion SURmax was computed as the uptake time–corrected ratio of lesion SUVmax and blood SUV (BSUV). Uptake time correction to T0 = 75 min after injection was performed as described previously (10). A value of zero for the apparent volume of distribution was assumed (i.e., Vr = 0 was used in the correction formula) for the reasons discussed elsewhere (17). The uptake time–corrected SUR is then given by Eq. 1
Eq. 1
where T is the actual time of measurement in the respective scan. In the following, we omit the index “max” when denoting SUVmax/SURmax, because maximum values of these quantities were considered throughout.
Two SUV variants were evaluated, namely normalization of injected dose to whole-body mass and to lean body mass (18). Because the latter variant yielded slightly superior performance (supplemental materials), it was selected for all further statistical analysis and comparison to other parameters. Therefore, in the following, “SUV” denotes lean body mass–corrected values everywhere.
For the 4 PET parameters determined in baseline PET (MTV, TLG, SUV, and SUR) and in restaging PET (rMTV, rTLG, rSUV, and rSUR), their prognostic value of 3 clinical endpoints (described below) was analyzed. Additionally, the fractional difference in these parameters between the first and second scans was investigated. For SUV, this difference reads Eq. 2
Eq. 2
where the 1 and 2 refer to the pretherapeutic and restaging PET, respectively. The fractional differences in the other 3 PET parameters were computed accordingly. A summary of all investigated PET parameters is shown in Supplemental Table 1.
Clinical Endpoints and Statistical Analysis
The 3 clinical endpoints of this study were locoregional control (LRC), freedom from distant metastases (FFDM), and OS measured from the start of radiotherapy to death or event. Patients who did not keep follow-up appointments and for whom information on survival or tumor status therefore was unavailable were censored at the date of last follow-up.
The association of OS, LRC, and FFDM with clinically relevant parameters (age, histology, T-stage, N-stage, and UICC stage) and with quantitative PET parameters was analyzed using univariate Cox proportional hazards regression in which the PET parameters were included as binarized parameters. The cutoffs used for binarization were calculated by performing a univariate Cox regression for each measured value. The value leading to the hazard ratio (HR) with the highest significance was used as the cutoff. To avoid group sizes that were too small, only values within the interquartile range were considered as potential cutoffs. The cutoffs were separately computed for OS, LRC, and FFDM. The stability of optimal cutoffs was tested using the bootstrap method (random resampling with replacement, 105 samples). For each sample, a univariate Cox regression was performed in which the same cutoff as in the original data was used to define high- and low-risk groups. Mean (sample-averaged) HR and P value were computed. The fractions of samples yielding P values of less than 0.05 and less than 0.1, respectively, were determined. Considering parameters with a mean P value of less than 0.1, the range of cutoffs for which univariate analysis leads to a P value of less than 0.1 was determined (supplemental materials).
The prognostic independence of PET parameters from clinically relevant parameters was analyzed in multivariate Cox regression. Those parameters with at least a trend for significance according to bootstrap analysis (P < 0.1) were included. Each PET parameter was analyzed separately together with the respective clinical parameters. The HRs and the P values of the basic parameters were averaged over all analyses. HRs were compared using the bootstrap method (105 samples) to determine the statistical distribution of (HR1 − HR2), from which the relevant P value then was derived. The added value offered by using the PET parameters was illustrated by combined Kaplan–Meier curves.
Statistical significance was assumed at a P value of less than 0.05. Statistical analysis was performed with R, a language and environment for statistical computing, version 3.3.2 (19).
RESULTS
The 2-, 3-, and 5-y OS rates were 51%, 38%, and 33%, respectively. These values are in line with data from the literature (20). Overall, 63% of patients died during the observation period (last follow-up, January 2017). The median OS was 15 mo. In our study, LRC was 57% and FFDM was 45% among the survivors at 5 y.
Prognostic Factors for LRC
Univariate Cox regression with respect to LRC revealed a significant correlation for age, MTV, rMTV, rTLG, ∆TLG, rSUV, and rSUR (HR range, 2.58–4.78), whereas ∆MTV, TLG, and ∆SUR showed a trend for significance (HR range, 1.99–2.18). Corresponding Kaplan–Meier curves are shown in Supplemental Figure 1. Only MTV, rMTV, rTLG, rSUV, and rSUR passed the stability test (Supplemental Table 2).
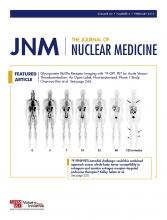
In multivariate analysis, all included parameters were independent prognostic factors for LRC (HR range, 2.65–4.75; Table 2). The HR of rSUR was significantly larger than that of rSUV (P = 0.048). No other HRs differed significantly. The best prognostic score for this endpoint was achieved by combining age, rMTV, and rSUR; the corresponding Kaplan–Meier curves are shown in Figure 1.
Univariate and Multivariate Cox Regression with Respect to LRC

Prognostic stratification for LRC is shown as combined Kaplan–Meier curves for age alone (A), combination of age and baseline MTV (B), and combination of age, rMTV, and rSUR (C). In combined curves, high risk was defined as simultaneous high risk according to all included risk factors (Table 2 shows cutoffs). Bottom x-axis depicts time from start of radiotherapy to event or censorship. Top x-axis depicts corresponding remaining group sizes.
Prognostic Factors for FFDM
None of the baseline PET parameters was prognostic for FFDM. Only MTV showed a trend for significance in univariate Cox regression (HR, 1.94). Nevertheless, all restaging parameters and fractional differences were significant prognostic factors for FFDM (HR range, 2.24–3.38). Corresponding Kaplan–Meier curves are shown in Supplemental Figure 1. MTV did not pass the stability test. Cutoffs of all significant parameters were stable according to this test (Supplemental Table 2). Univariate analyses also revealed a significant prognostic impact of histology.
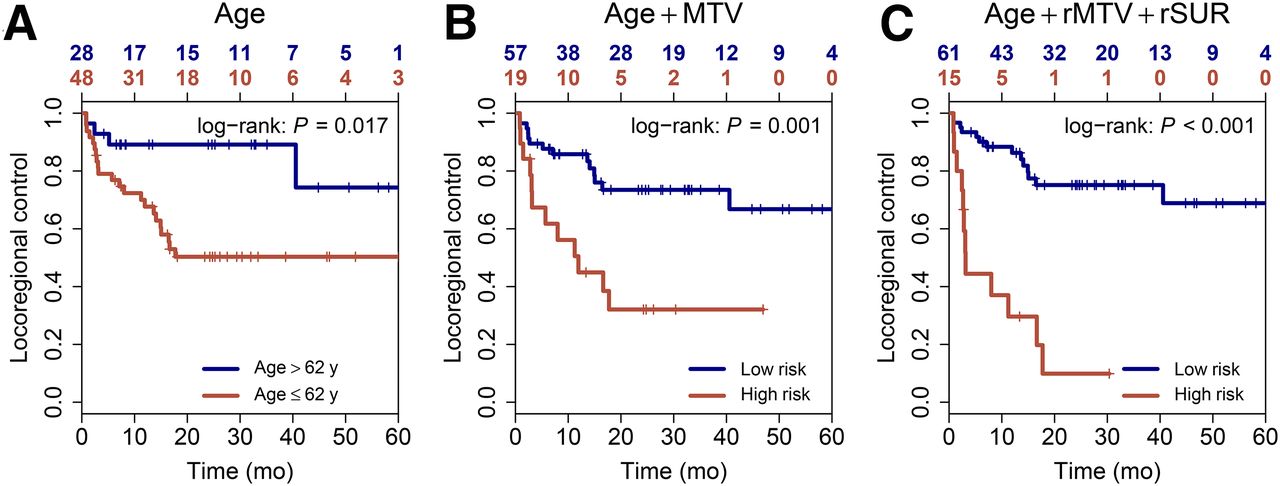
On multivariate analysis, significant effects were found for histology, rMTV, ∆MTV, rTLG, rSUV, ∆SUV, rSUR, and ∆SUR (HR range, 2.23–5.39; Supplemental Table 3). Differences in the HRs for rSUV and rSUR and for rSUV and rTLG were significant (P = 0.043 and 0.029, respectively). No other HRs differed significantly. Combined Kaplan–Meier curves with respect to FFDM are shown in Figure 2.

Prognostic stratification for FFDM is shown as combined Kaplan–Meier curves for histology alone (A), combination of histology and rMTV (B), and combination of histology and rSUR (C). In combined curves, high risk was defined as simultaneous high risk according to all included risk factors (Supplemental Table 3 shows cutoffs). Bottom x-axis depicts time from start of radiotherapy to event or censorship. Top x-axis depicts corresponding remaining group sizes.
Prognostic Factors for OS
According to univariate Cox regression, OS was significantly associated with the PET parameters MTV, rMTV, TLG, rTLG, rSUV, and rSUR (HR range, 1.8–2.75). ∆SUR showed a trend for significance (HR, 1.85). The corresponding Kaplan–Meier curves are shown in Supplemental Figure 1. The stability test was passed by MTV, rMTV, rTLG, and rSUR (Supplemental Table 2).
Histology was a significant prognostic factor for OS in favor of adenocarcinomas (HR, 2.58). In univariate Cox regression, UICC stage also showed a trend for significance (HR, 2.07). These 2 parameters and the PET parameters were included in the multivariate Cox regression. Histology, MTV, rMTV, and rSUR were multivariate significant prognostic factors for OS, and rTLG showed a trend for significance (Supplemental Table 4). HRs (range, 2.06–3.19) did not differ significantly. Combined Kaplan–Meier curves with respect to OS are shown in Figure 3.
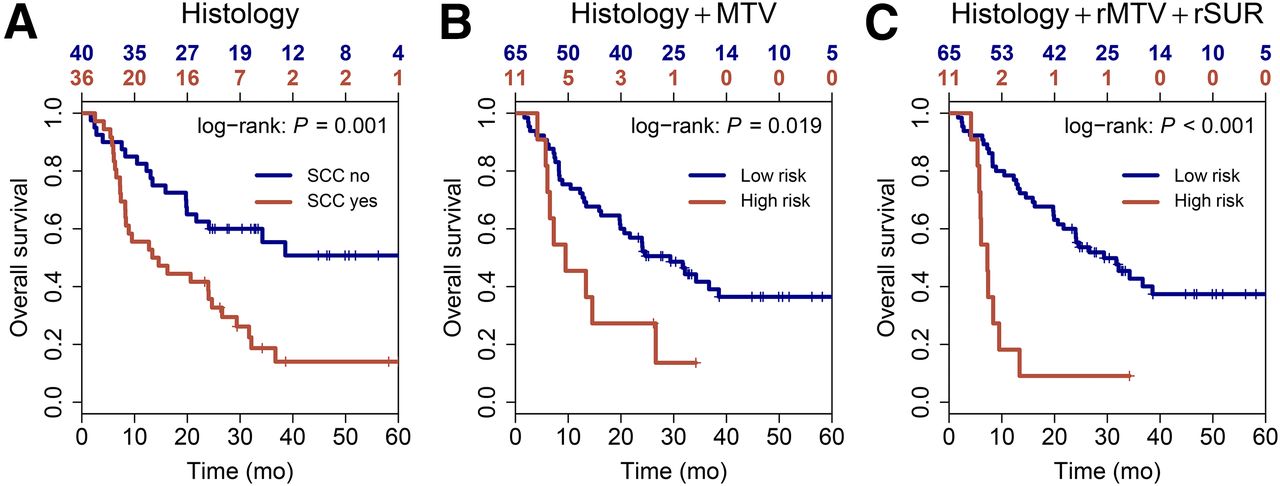
Prognostic stratification for OS is shown as combined Kaplan–Meier curves for histology alone (A), combination of histology and baseline MTV (B), and combination of histology, rMTV, and rSUR (C). In combined curves, high risk was defined as simultaneous high risk according to all included risk factors (Supplemental Table 4 shows cutoffs). Bottom x-axis depicts time from start of radiotherapy to event or censorship. Top x-axis depicts corresponding remaining group sizes.
DISCUSSION
In this exploratory study, we investigated the prognostic value of different baseline PET parameters and their potentially additional value at the end of neoadjuvant radiochemotherapy in patients with esophageal carcinoma. Moreover, the aim of this exploratory study was to evaluate the prognostic impact of SUR as a new parameter for quantification of tumor metabolism in comparison to the conventional PET parameters MTV, TLG, and SUV, taking into account known basic prognostic parameters in this patient cohort.
Our investigation revealed several PET parameters to be independent prognostic factors for the different clinical endpoints. Two parameters showed a significant correlation with all endpoints on multivariate analyses: rMTV and rSUR. Furthermore, baseline MTV was prognostic for OS and LRC, and rTLG was prognostic for LRC and FFDM. The only basic clinical factors remaining significant on multivariate analyses performed together with the PET parameters were histology for OS and FFDM, in favor of adenocarcinomas, and age for LRC.
Our findings on histology are in line with other studies supporting better OS rates for an adenocarcinoma subtype of esophageal carcinoma than for squamous cell carcinoma (21).
The fact that neither T- and N-stage nor UICC stage was significantly correlated with the investigated endpoints can probably be explained by the homogeneity of our patient cohort. Most of our patients had T3 and N1 tumors and therefore represented a comparably narrow range of tumor burden undergoing a homogeneous treatment, making it difficult to identify prognostic factors in the sample reported here.
Overall, our investigation revealed a higher prognostic value for the restaging PET parameters than for baseline PET for patient outcome after trimodality treatment in esophageal carcinoma. This finding is in line with a retrospective study by Mamede et al. in which the highest prognostic value for progression-free survival was found for body-weight–normalized rSUV (22). This finding also agrees with a study by Lomas et al in which body-weight–normalized rSUV was the only remaining prognostic factor for OS on multivariate analysis (23).
Furthermore, the restaging PET parameters alone have significantly higher prognostic impact than the corresponding relative changes in the respective parameters between the 2 PET examinations. For a prognostic score on patient outcome, the PET-based volume parameter rMTV was combined with the uptake parameter rSUR and histology. This score significantly improved outcome prediction for patients with esophageal carcinoma treated with neoadjuvant radiochemotherapy followed by surgery for all investigated clinical endpoints, with the largest effect being for LRC (Figs. 1–3). By determination of such a prognostic score, a therapy adjustment would be feasible since within our protocol the second PET/CT is performed at a time when changes in therapeutic concepts are still possible—for example, avoidance of risky surgery in patients with a poor prognosis, or intensification of chemotherapy in patient with a high risk for metastatic spread.
In our study, baseline SUV was not prognostic for any of the investigated endpoints (independent of weight normalization; supplemental materials), as agrees with most published investigations in similar patient groups (22,24,25). Also, the use of SUR instead of SUV as the baseline parameter did not improve the prognostic value of uptake parameters in our patient cohort, as agrees with a recent publication by Arnett et al. that found no significant correlation between baseline SUR and OS or histopathologic response (24). This suggests that pretherapeutic uptake metabolism per se is not prognostic or has only a low effect in patients with esophageal carcinoma receiving neoadjuvant radiochemotherapy. For ∆SUV, we did not find any significant effect on OS, as agrees with some studies (22,24,26–28) but disagrees with others (20,29–31). Also, the use of ∆SUR apparently did not improve the correlation with our clinical endpoints. Only for FFDM—not for OS and LRC—we found a significant effect in our study. Regarding OS, this finding agrees with the results of Arnett et al. (24). Taken together, these ambiguous results might indicate a limited prognostic value or clinically irrelevant effect of changes in uptake metabolism in this patient cohort.
For all endpoints, the largest effect size (HR) of all PET parameters was found for rSUR, with the HR difference between rSUR and rSUV, respectively, being significant for LRC and FFDM, which further indicates that SUR has the potential to increase the prognostic value compared with SUV. In contrast, the HRs for rSUR and volume-based parameters (MTV, TLG) did not differ significantly. Therefore, the question of whether rSUR is also superior to these parameters cannot be finally answered on the basis of our results. It is important to note that for each parameter, the optimal cutoff was used for the analysis, resulting in an explorative analysis. The robustness of these cutoffs must be tested in a validation cohort and finally confirmed in a prospective multicenter trial.
As to why SUR outperforms SUV, it is relevant to note that, contrary to SUV, SUR is (approximately) proportional to the tumors’ 18F-FDG uptake rate, Km, across different investigations, even in the presence of interindividual uptake time and BSUV variability (9,10,17). Assuming glucose metabolism is prognostic of treatment outcome, SUR can be expected to have a higher prognostic value than SUV. Although uptake time correction of SUV is possible (10), it suffers from specific uncertainties and does not suffice in the present study to improve the performance of SUV (supplemental materials). Omitting uptake time correction from SUR computation (and thus reducing it to SUV normalization to BSUV) is not an option because uptake time correlates with BSUV (BSUV decreases over time). It is only the combined correction which makes SUR proportional to Km to a rather good approximation. Notwithstanding, it is conceivable that part of the improvement achieved by SUR will be related not to compensation of true intersubject BSUV variability but to elimination of the usual factors adversely affecting SUV quantitation (scanner calibration, dose, and weight uncertainties, for example). SUR shares this advantage with other ratio methods (e.g., the tumor-to-liver ratio) but offers further benefits by eliminating the influence of physiologic BSUV and uptake time variability. In our view, existing data indicate that intersubject BSUV variability is, in fact, much larger than what could be expected from inaccurate or erroneous SUV determination alone, but ultimate proof of this conjecture would require comparing image-derived BSUVs with blood samples in a dedicated prospective study. In any case, for practical application of SUR, it is not necessary to differentiate between true and spurious BSUV variability because both are simultaneously corrected (ensuring the said proportionality of SUR to Km).
Furthermore, our results demonstrate that the correlation of baseline MTV with LRC and OS, and of rMTV with all clinical endpoints, is significant. Other recent studies also suggest MTV to have prognostic value regarding OS and recurrence-free survival, for example (32). MTV has also been shown to correlate with pathologic response after neoadjuvant chemoradiation as a predictive marker for patient outcome (33), as is in line with the results reported here. From a radiobiologic point of view, tumor volume as a surrogate of the number of cancer stem cells is highly relevant because the number of cancer stem cells in a tumor correlated with both likelihood of local control and likelihood of metastases (34). The results of our study are in line with these expectations. Thus, on the basis of this investigation, the importance of tumor volume (or its metabolic active part) to patient outcome can be demonstrated in a further entity and extends previously published data on, for example, lung cancer or head and neck carcinomas (35–37). Because MTV and SUR are independent prognostic parameters in this study, it may be speculated that both the overall number of cancer stem cells and tumor metabolism/proliferation may play a major role in therapy outcome for this patient cohort.
It should be noted that in the present study, MTV was determined using an essentially fully automated delineation algorithm. Although several viable automated algorithms have been published (38–43), in many institutions MTV is still determined by manual delineation or by application of a fixed absolute or relative threshold, which suffers from well-known limitations such as intra- and interobserver variability as well as a possibly background-dependent bias. Therefore, the prognostic value of MTV may potentially be less convincing when the lesions are delineated manually in the usual fashion. In contrast, SURmax has the clear advantage of being quite insensitive to the details of tumor delineation (unambiguous determination of lesion SUVmax). SUR also is quite insensitive to details of the aorta ROI definition (used for computation of blood SUV), since it can be defined reliably in the attenuation CT scan (Supplemental Fig. 2). Residual ambiguity or variability of ROI position and delineation does not cause notable changes in derived blood SUV, because the applied substantial safety margin of 8 mm ensures that partial-volume effects do not become relevant.
The analysis of all baseline parameters revealed a combination of age and MTV to have the highest impact for a prognostic score in this patient cohort, but there was hardly any additional value over the prognostic power of the individual parameters alone (Figs. 1–3).
If the prognostic value can be confirmed in a validation cohort, the predictive value of the described PET parameters and combined scores needs to be addressed in prospective stratification studies or intervention studies.
CONCLUSION
PET provides independent prognostic information for OS, LRC, and FFDM in addition to standard clinical parameters in patients with esophageal carcinoma treated with neoadjuvant radiochemotherapy followed by surgery. Among the investigated uptake-based parameters, SUV and SUR determined in the restaging PET were independent prognostic factors for all investigated clinical endpoints. In all cases, the effect size was larger for SUR than for SUV. These results suggest that the prognostic value of tracer uptake can be improved when characterized by SUR rather than by SUV.
Furthermore, a significant impact of MTV before and after neoadjuvant radiochemotherapy could be shown. Thus, the radiobiologic importance of the tumor volume for patient outcome was demonstrated in a further entity and adds to previously published data on other tumors.
Overall, our investigation revealed the restaging PET parameters to be more prognostic than the baseline PET parameters for patient outcome after trimodality treatment of esophageal carcinoma. One important fact is that within our protocol, therapy adjustments would still be possible at that point in time. Further investigations are required to confirm these hypothesis-generating results.
DISCLOSURE
This work was supported in parts by the German Federal Ministry of Education and Research (BMBF contract 03ZIK041). No other potential conflict of interest relevant to this article was reported.
Footnotes
Published online Aug. 30, 2018.
- © 2019 by the Society of Nuclear Medicine and Molecular Imaging.
REFERENCES
- Received for publication January 3, 2018.
- Accepted for publication June 7, 2018.


Jump to section
Related Articles
Cited By...
- No citing articles found.