


Abstract
A limitation of using 68Ga-labeled prostate-specific membrane antigen (68Ga-PSMA) for detection and staging of prostate cancer is a frequently observed halo artifact around the urinary bladder caused by inaccurate scatter correction (SC) of PET data. The aim of this study was to investigate the impact of unrenormalized absolute SC on 68Ga-PSMA PET quantification in PET/MRI of the prostate in 100 patients. Methods: The PET data of 100 patients were reconstructed twice using standard SC and improved unrenormalized SC. The visual presence of the halo artifact was rated in each PET data reconstruction using 5 grades (0, no halo artifact; 4, severe halo artifact). The number of visible lesions in the pelvis was recorded. SUVmean and SUVmax were measured in the lesions, in the bladder, in the gluteus maximus, and within the halo margin. Furthermore, the signal-to-noise-ratio and image noise were measured in all PET data. Relative differences between standard and unrenormalized SC were calculated. Results: With standard SC, the average grade in the presence of the halo artifact was 2 (moderate halo artifact), whereas for unrenormalized SC, the average grade was 0.9 (slight halo artifact). The same number of congruent lesions (n = 74) was detected for both PET data reconstructions. Relative changes in PET signal-to-noise-ratio and image noise were not statistically significant (P > 0.05). The mean (±SD) increase in SUVmean using unrenormalized SC was 23.0% ± 9.2% in the gluteus maximus, 7.1% ± 4.5% in the bladder, 325.4% ± 748.5% in the halo margin, and 12.4% ± 16.8% in all 74 detected lesions. The mean increase using unrenormalized SC in SUVmean was 17.5% for lesions inside the halo margin (38 lesions) and 6.9% for lesions outside the halo margin (36 lesions). Conclusion: For PET/MRI of prostate cancer using 68Ga-PSMA, a proper SC is important to ensure the best possible diagnostic quality and PET quantification. Unrenormalized absolute SC significantly reduces the halo artifact around the bladder and improves PET/MRI of the prostate.
Since the introduction of 68Ga-labeled prostate-specific membrane antigen (68Ga-PSMA) ligand as a PET tracer (1), several studies have shown promising results for the detection and staging of prostate cancer with PET/CT (2–4) and, more recently, PET/MRI (5–9).
A potential challenge of using 68Ga-PSMA for detection and staging of prostate cancer is a frequently observed photopenic artifact in PET images, known as the halo artifact. PSMA barely accumulates in abdominal fat and soft tissue. Most 68Ga-PSMA is excreted by the urine and thus concentrated within the urinary system. This results in extreme differences in activity concentration between the bladder/kidneys and surrounding background tissue and, thus, may lead to the halo artifact in PET/CT (10) but particularly in PET/MRI (5,8). The halo artifact causes reduced signal intensity around the urinary bladder and at the level of the kidneys in scatter- and attenuation-corrected PET images (Fig. 1) (5,11,12). Because of this artificial PET signal extinction, tumor manifestations and lesions in these regions may be nondetectable by PET or may show distorted SUVs, hampering quantification of lesion activity. In addition to the high specificity of PSMA, 68Ga decay causes further physical challenges. In 68Ga decay, prompt γ-rays are emitted simultaneously with positron emission. These γ-rays have an energy of 1,077 keV. When the γ-rays are scattered before detection, their energy may fall into the energy window of the PET system (e.g., 430–610 keV for the Biograph mMR; Siemens Healthcare GmbH). A coincidence between prompt γ-rays and annihilation photons cannot be differentiated from true coincidences and thus affects PET overall quantification and image quality.

PET images reconstructed using SP1 and SP2 and relative-difference image between the 2 methods. In SP1 PET image, severe halo artifact (grade 4) is observable (arrows), whereas SP2 image shows no artifact (grade 0) (arrows). Relative differences in PET activity up to 100% in this example are maximal in halo margin; differences between SP1 and SP2 in bladder and surrounding tissue are minor.
The halo artifact is often caused by inaccurate scatter correction (SC) (5,8,12). For this reason, optimized SC is needed to minimize the adverse effect of the halo artifact on the diagnostic accuracy of PET/MRI for prostate cancer. The most commonly used SC method in clinical PET imaging is based on the single-scatter-simulation algorithm (13,14). The absolute scaling of single-scatter simulation for highly specific PET tracers such as 68Ga-PSMA seems to be less prone to the halo artifact than relative scaling (12). Heußer et al. (12) also demonstrated that a reduction in the maximum scatter fraction from 75% to 40% can suppress the halo artifact in 68Ga-PSMA prostate PET/MRI. An improved SC method for the Biograph mMR uses unrenormalized absolute SC. PET SC typically uses a single–Compton scatter simulation to compute a scatter sinogram, which is scaled to the emission data to account for multiple and possible external scatter from outside the scanner field of view (FOV). Eliminating the sometimes problematic renormalizing (rescaling) of the PET emission image during the SC calculations for tracers such as 68Ga-PSMA can minimize the appearance of the halo artifact and, therefore, improve diagnostic image quality and PET quantification.
Not correcting the prompt γ-rays may lead to a scatter overestimation when applying relative single-scatter simulation (15). Therefore, a prompt γ-correction might be beneficial in some cases combined with relative single-scatter simulation shown by Heußer et al. (12). Especially in PET/CT imaging, the prompt γ-correction seems to reduce the halo artifact around the kidneys (16). Nevertheless, Noto et al. (9) and Heußer et al. (12) both revealed that prompt γ-rays had a limited effect on the appearance of the halo artifact in 68Ga-PSMA PET/MRI. Potential reasons why prompt γ-correction is more effective in PET/CT than PET/MRI might be the arm position (arms up in PET/CT, arms down in PET/MRI) and the often longer postinjection times in PET/MRI (often patients first undergo PET/CT and then PET/MRI without further tracer injection). A prompt γ-correction has been shown to inherently improve PET quantification using isotopes such as 82Rb with a much higher branching fraction than 68Ga (15). However, the prompt γ-branching fraction for 68Ga is 3%, and only a fraction of these will be detected in coincidence with the annihilation radiation. In other words, the prompt γ-background is low and does not have a significant impact on the absolute scatter.
Although prompt γ-correction seems to have negligible impact on 68Ga-PSMA PET/MRI and the appearance of the halo artifact (9,12), new multiscatter methods show promising results (17). Yet under development, the double-scatter simulation in addition to single-scatter simulation seems to be a good approximation of total scatter and therefore might further improve 68Ga-PSMA PET/MRI.
Another method of improved SC has been presented by Wangerin et al. (18), who demonstrated a significant reduction in the halo artifact. The single-scatter estimation was improved through optimization of the subsampling methodology that is used to limit the computation time. The scatter-scaling step was improved by incorporating an additive offset factor into the model. Both optimization steps led to promising results, reducing the appearance of the halo artifact and improving diagnostic PET image quality in 68Ga-PSMA PET/MRI (18).
Because of the high interest in 68Ga-PSMA PET for staging, therapy, and follow-up of prostate cancer (19–21), the frequent occurrence of the halo artifact in conjunction with this radiotracer presents a challenge for diagnostic image interpretation. To improve the clinical diagnostic and scientific evaluation of 68Ga-PSMA PET/MRI and PET/CT images, a robust SC method is needed to reduce the halo artifact. The aim of this study was to investigate the qualitative and quantitative impact of unrenormalized absolute SC on 68Ga-PSMA PET quantification in PET/MRI of the prostate in 100 patients.
MATERIALS AND METHODS
Patient Population
This retrospective study included 100 patients who underwent a pelvic 68Ga-PSMA PET/MRI examination. The patient population (mean age ± SD, 69.3 ± 7.8 y [interquartile range, 12.6 y]; mean body mass index, 27.1 ± 3.5 kg/m2 [interquartile range, 4.0 kg/m2]) was administered an average radiotracer dose of 117.2 ± 29.7 MBq (interquartile range, 52.3 MBq). The PET/MRI measurement started 138 ± 69 min after injection (interquartile range, 111 min). Patients received 20 mg of furosemide 15 min after injection. Patients were referred for pelvic 68Ga-PSMA PET/MRI because of either suspected primary prostate carcinoma or biochemical recurrence. The institutional review board (Ethics Commission of the Medical Faculty of the University Duisburg–Essen) approved this study (study 11-4822-BO), and all subjects gave written informed consent.
Image Acquisition and Reconstruction
PET/MRI measurements were performed on an integrated 3-T whole-body PET/MRI system (Biograph mMR). All patients were asked to void their bladder directly before the PET acquisition. PET data of the pelvis were acquired for 10–40 min, followed by a whole-body PET examination (3–5 bed positions, 4 min/bed position). The arms were positioned alongside the body. The latest methods were used for MRI-based attenuation correction (AC) and SC: a standard Dixon–volumetric interpolated breath-hold examination (VIBE) supplemented with MRI-based B0 homogenization using gradient enhancement information from an extended FOV (22) and segmented bone information (23). All PET data were reconstructed with e7 tools (Siemens Molecular Imaging) using ordinary Poisson ordered-subsets expectation maximization with 3 iterations, 21 subsets, and a 4-mm gaussian filter. Random correction, decay correction, and SC were applied for all PET emission data. For comparability reasons, for each patient a 10-min interval from the start of the PET measurement was obtained from the list-mode data for the pelvis only. To validate the impact of SC on 68Ga-PSMA PET/MRI, all PET data (pelvis only) from all 100 patients were reconstructed twice using standard SC (software version VE11 SP1) serving as the reference standard and unrenormalized SC (software version VE11 SP2). The vendor-based implementation of the single-scatter-simulation algorithm was used for scatter estimation with an absolute scaling of the estimated scatter. Both methods of SC—SP1 and SP2—were based on absolute single-scatter simulation. SP2 just omits the last scaling step. Default parameters were used and kept constant for all reconstructions (number of iterations, 2; maximum scatter fraction, 75%; scale factor, 1.0). To evaluate the potential impact of PET acquisition time on PET image quality and lesion detection, for a subset of 2 patients with lesions inside the halo margin, a 4-min interval from the start of the PET measurement was obtained from the list-mode data for the pelvis and compared with the standard 10-min intervals. As for the 10-min PET data, the 4-min PET data were reconstructed with both SC methods (SP1 and SP2).
Image Analysis
The margins of the halo artifact were mostly inhomogeneous, and thus, accurate measurement of the halo volume was not feasible (5). Therefore, the presence and visibility of the halo were rated in 5 grades as follows: 0, no halo artifact; 1, slight halo artifact; 2, moderate halo artifact; 3, strong halo artifact; and 4, severe halo artifact. For quantitative evaluation of PET image quality, SUVmean, SUVmax, and SUVSD were measured in the bladder, the halo margin, and the gluteus maximus. All PET/MRI datasets were analyzed for lesion detectability, applying a lesion detectability score (9). The 4-point detectability score was defined as follows: 0, not detectable; 1, equivocal; 2, discernible; and 3, clearly visible. To quantify lesion detectability, SUVmean, SUVmax, and SUVSD were obtained for all recorded lesions in each patient and for each of the 2 PET data reconstructions. All regions of interest and volumes of interest were copied in identical planes and positions in each reconstructed dataset for each patient. Relative differences between SP1 and SP2 were calculated. Signal-to-noise ratio (SNR), image noise, and orbit-to-background ratio (OBR) were generated. For statistical analysis, SPSS software was used (version 22; IBM). Statistical analysis (t test, χ2 test) was performed to compare the 2 SC methods, with P values of less than 0.05 being considered statistically significant.
RESULTS
Table 1 shows the halo artifact grades for 100 patients. With SP1, the mean grade was 2 (moderate halo artifact), whereas for SP2, the mean grade was reduced to 0.9 (slight halo artifact). With SP1, in only 1 patient dataset was no halo artifact (grade 0) detected, whereas 3 PET datasets showed a severe halo artifact (grade 4). With SP2, in 23 patients no halo artifact (grade 0) was visible, and no PET dataset had a severe halo artifact (grade 4). The calculated P value from a χ2 test is less than 0.01, and therefore the grade of the halo artifact is dependent on the SC method used.
Grading of Halo Artifacts on SP1 and SP2 Images
In all 100 patients, the same number of congruent lesions (n = 74) was detected for both PET data reconstructions. Thus, no lesion was completely missed because of the halo artifact, independent of the SC method used. The lesion detectability score showed no differences between SP1 and SP2. The lesions were rated as 2.5 ± 0.6 (discernible to clearly visible) in both reconstructions, regardless of the halo artifact.
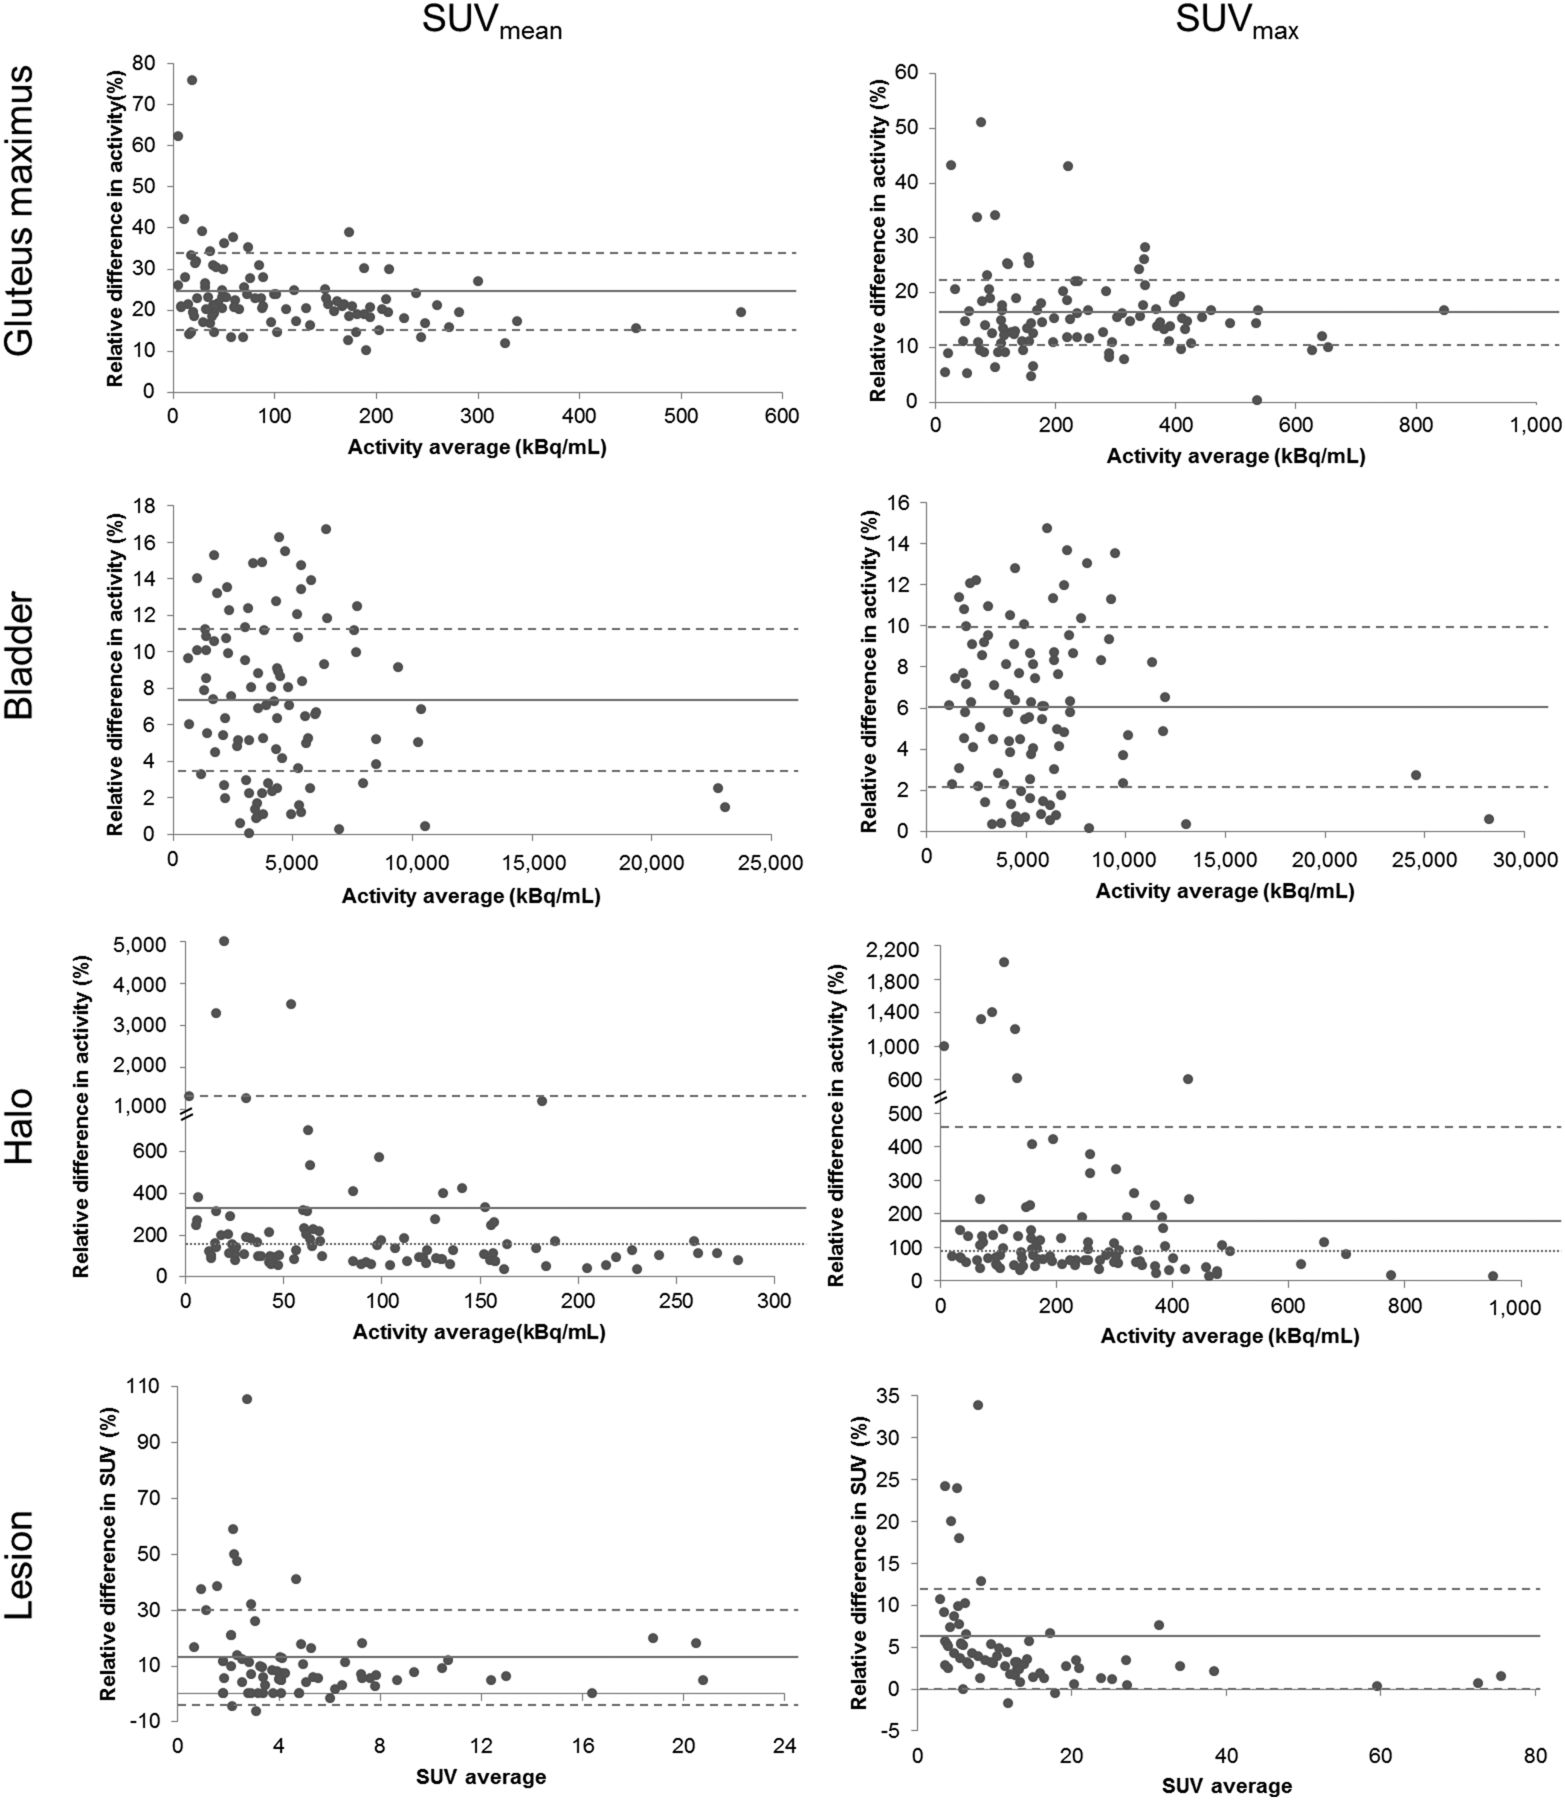
The calculated P values from the t test were used to clarify whether differences in various parameters between SP1 and SP2 were statistically significant. The Bland–Altman plots in Figure 2 show the relative difference in measured SUVmean and SUVmax in the gluteus maximus, the bladder, the halo margin, and all detected lesions using SP1 and SP2. One can see an overall gain in SUVmean and SUVmax due to SP2. A remarkable gain in SUV was measured within the halo margin. Considering all 100 patients, the mean increase in SUVmean in the gluteus maximus using SP2, compared with SP1, was 23.0% ± 9.2%. The total range for SUVmean was 9.9%–75.7%. The mean increase in SUVmax in the gluteus maximus using SP2 was 15.8% ± 7.9%. The total range was 0.2%–50.9%. The changes in both SUVmean and SUVmax in the gluteus maximus were statistically significant (P < 0.05). The mean increase over 100 patients in SUVmean in the bladder using SP2, compared with SP1, was 7.1% ± 4.5%. The total range was 0%–16.7%. The mean increase in SUVmax in the bladder using SP2 was 5.9% ± 3.8%. The total range was 0.1%–14.7%. The changes in both SUVmean and SUVmax in the bladder were statistically significant (P < 0.05). Considering all 100 patients, the mean increase in SUVmean within the halo margin using SP2, compared with SP1, was 325.4% ± 748.5%, with a median of 127.3%. The total range was 35.5%–5,463.4%. The mean increase in SUVmax in the halo margin using SP2 was 163.0% ± 250.5%, with a median of 77.3%. The total range was 12.6%–1,327.4%. The changes in both SUVmean and SUVmax in the halo margin were statistically highly significant (P < 0.01). Considering all 74 detected lesions, the mean increase in SUVmean using SP2, compared with SP1, was 12.4% ± 16.8%, with a median of 7.4%. The total range was −6.3%–105.6%. The mean increase in SUVmax in all detected lesions using SP2 was 5.5% ± 6.1%. The total range was −1.7%–33.8%. The changes in SUVmean and SUVmax in the lesions were statistically significant (P < 0.05).

Bland–Altman plots show relative difference in measured SUVmean and SUVmax in gluteus maximus, bladder, halo margin, and all 74 detected lesions using SP1 and SP2. Solid lines mark mean value, dashed lines represent limits of agreement (SD), and dotted lines mark median. Note overall gain in SUVs due to SP2, especially with considerable gain in SUV within halo margin.
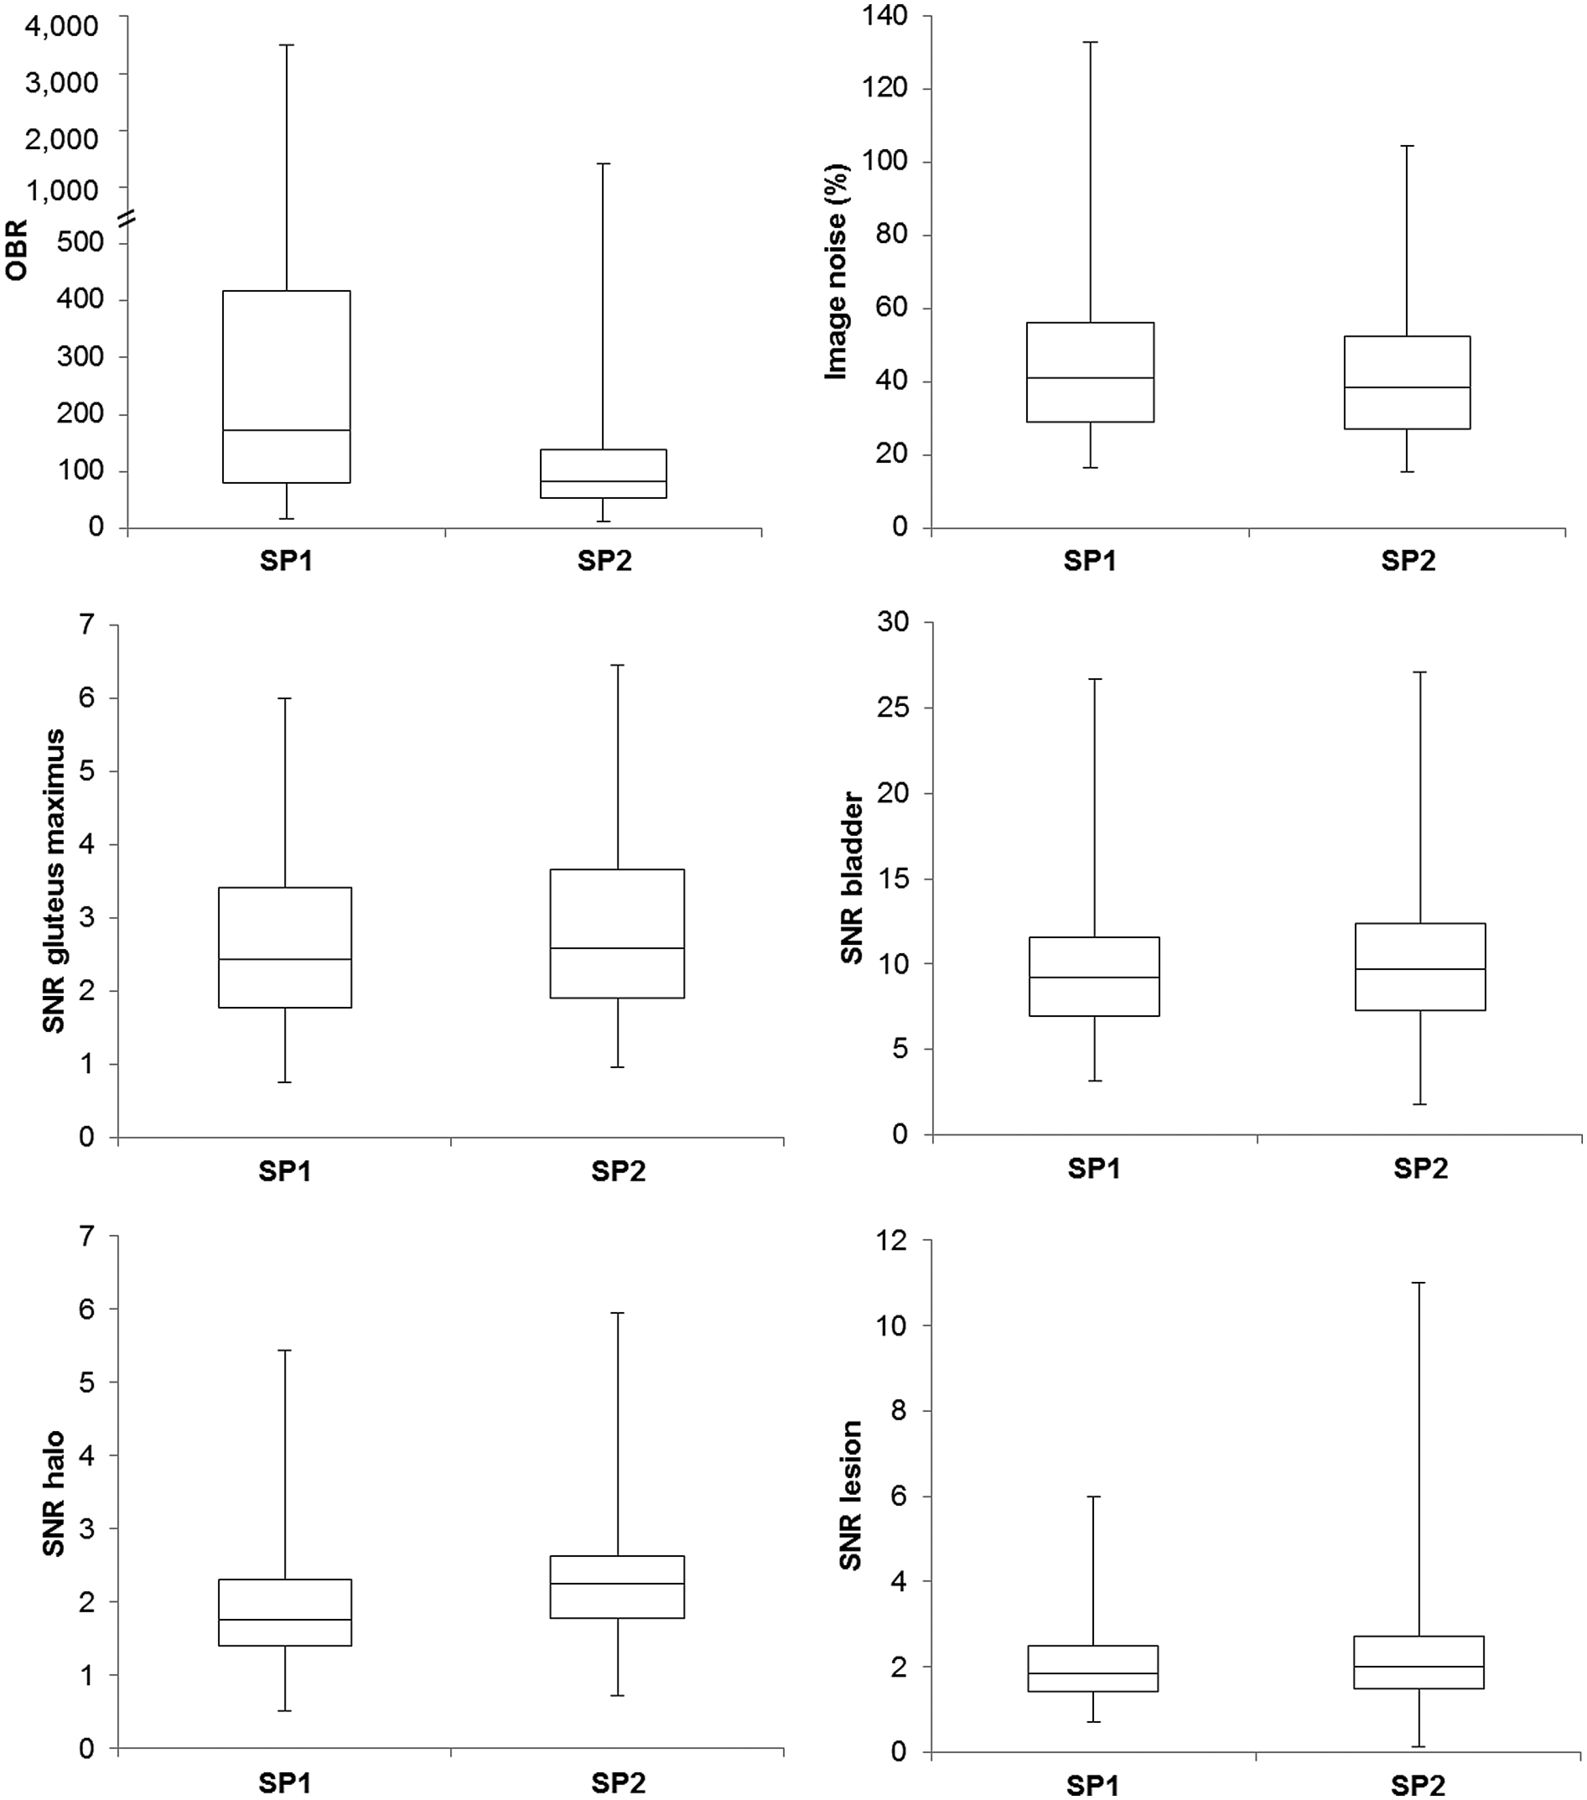
Figure 3 shows box plots of the OBR, image noise, and SNR in the gluteus maximus, bladder, halo margin, and detected lesions using SP1 in comparison to SP2. With SP2, OBR and image noise decreased, whereas SNR slightly increased. The mean OBR decreased from 434.0 ± 698.3 using SP1 to 137.9 ± 182.3 using SP2. The median OBR decreased from 171.6 to 82.6 with SP2. The changes in OBR were statistically highly significant (P < 0.01). The mean image noise also decreased with SP2 from 46.6% ± 22.9% to 43.1% ± 20.2%. The mean SNR in the gluteus maximus increased with SP2 from 2.6 ± 1.1 to 2.8 ± 1.2. The mean SNR in the bladder increased with SP2 from 9.6 ± 3.9 to 10.2 ± 4.1. The mean SNR in the halo margin increased with SP2 from 1.8 ± 0.8 to 2.3 ± 0.8. The mean SNR in the lesions increased with SP2 from 2.0 ± 0.9 to 2.4 ± 1.7. The changes in image noise and SNR in each region were not significant (P > 0.05).

Box plots of OBR, image noise, and SNR in gluteus maximus, bladder, halo margin, and all 74 detected lesions using SP1 in comparison to SP2. OBR and image noise decrease with SP2, whereas SNR slightly increases.
Relative differences in SUVmean and SUVmax between SP1 and SP2 were calculated. The lesions were categorized as detected inside (38 lesions) or outside (36 lesions) the halo margin. For SP2, the mean increase in SUVmean was 17.5% ± 20.5% for lesions inside the margin and 6.9% ± 8.7% for lesions outside, and the mean increase in SUVmax was 7.4% ± 7.4% inside and 3.5% ± 3.1% outside.
Figure 4 shows a patient example with relative difference map, PET data corrected with SP1 and SP2, MRI data, and fused PET/MR images. Three lesions could be detected with SP1 and SP2. The halo artifact was reduced from severe (grade 4) to none (grade 0) using SP2. The relative differences in lesion SUVmean were 47.4% for the lesion at the right ischium, 32.0% for the lesion at the right pubis, and 50.0% for the lesion at the left pubis.
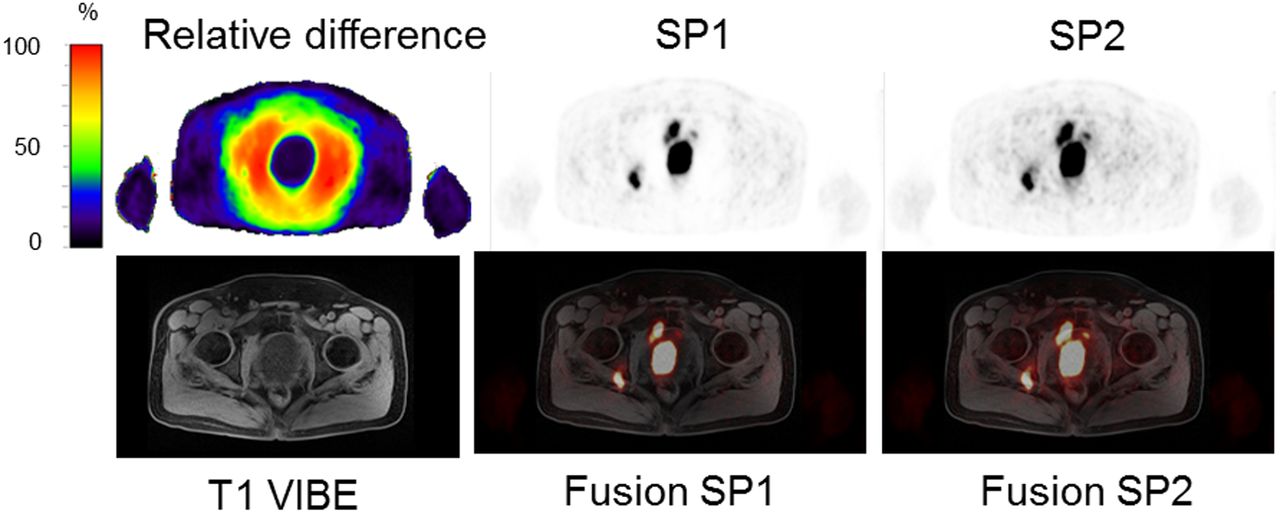
Patient example with 3 detected lesions in PET data, axial T1-weighted VIBE, and fusion images with PET data. Relative difference between SP1 and SP2 shows artifact-reducing impact of SP2. Halo artifact was reduced from severe (grade 4) to none (grade 0) using SP2. Relative differences of up to 50% in SUVmean in lesions were calculated.
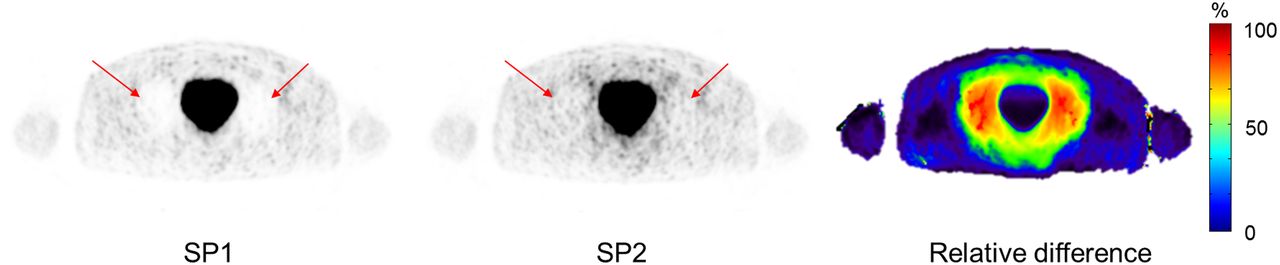
Figure 5 shows a patient example with relative difference map, PET data corrected with SP1 and SP2, MRI data, and fused PET/MR images. One lesion inside the halo margin could be detected with SP1 and SP2. The halo artifact was reduced from strong (grade 3) to none (grade 0) using SP2. The relative difference in lesion SUVmean was 105.6%.

Patient example with 1 detected lesion in PET data, axial T1-weighted turbo spin echo, and fusion images with PET data. Relative difference between SP1 and SP2 shows impact of SP2. Halo artifact was reduced from strong (grade 3) to none (grade 0) using SP2. Relative difference of up to 105% in SUVmean in lesion was calculated.
Figure 6 shows 2 patient examples of axial PET images obtained at 4- and 10-min intervals and corrected with SP1 and SP2. At both intervals for both patients, the halo artifact could be reduced with SP2. Comparing the visibility of 1 lesion in each patient (arrows) at the 4-min interval, the lesion is fainter in the image with SP1 than with SP2, with the visibility score decreasing from discernible to equivocal in example 1 and from clearly visible to discernible in example 2. All lesions in all patients could be detected in all reconstructions.
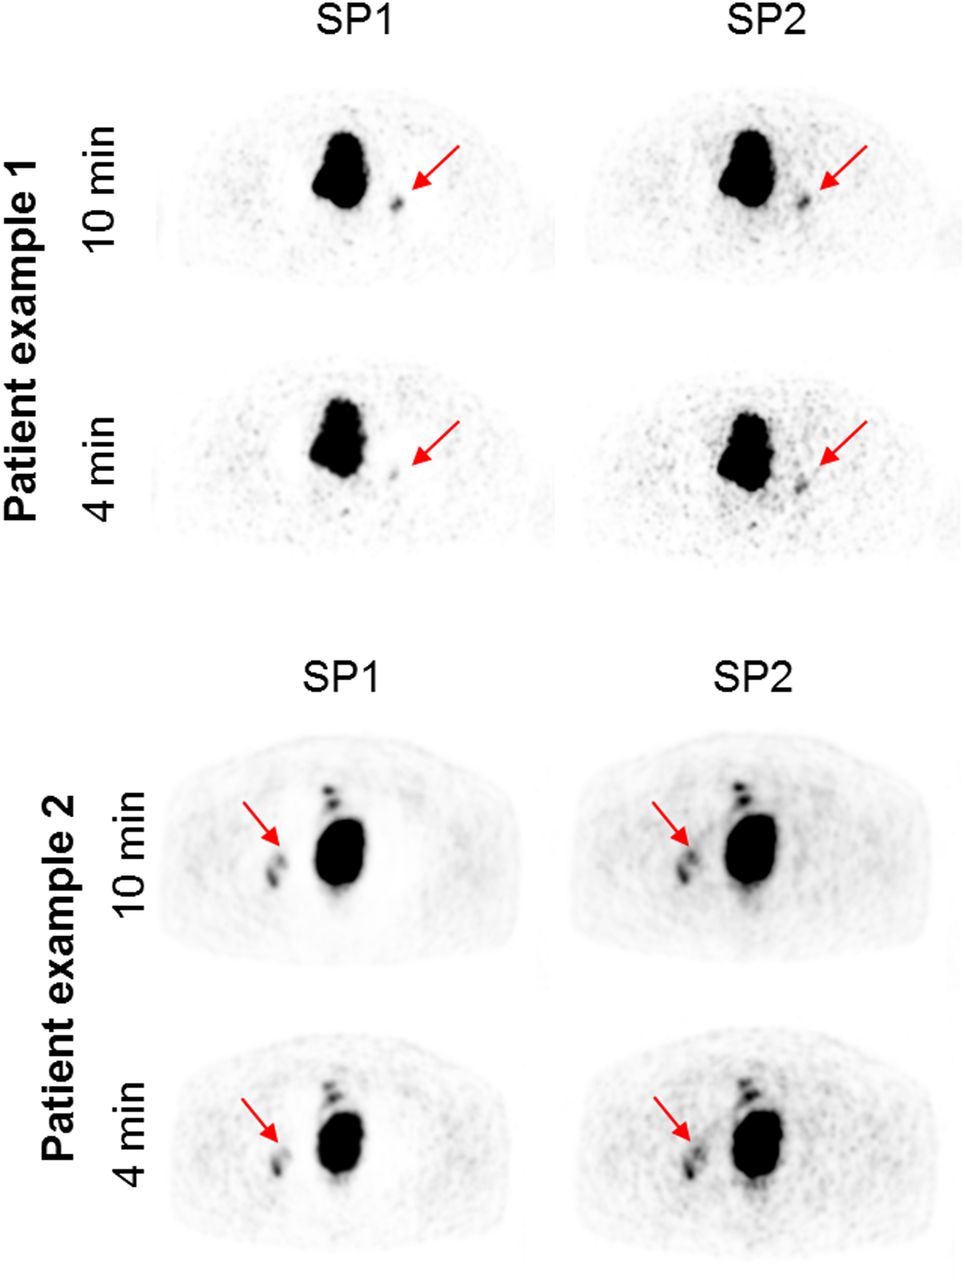
Impact of PET acquisition time on lesion visibility. Axial PET images are shown for 2 patient examples with lesions present in halo artifact margin. For each patient, 4- and 10-min PET intervals were reconstructed using SP1 and SP2. In both intervals for both patients, halo artifact was significantly reduced with SP2. Although all lesions could be detected in all reconstructions, in 4-min interval visibility of marked lesions (arrow) decreased in SP1 image compared with SP2 image and compared with 10-min interval.
DISCUSSION
Inaccurate SC is a significant factor in the origin and extent of the halo artifact (5,12). By turning off the SC, the halo can be virtually omitted. However, assessing non–scatter-corrected PET images runs the risk of missing prostate cancer lesions, and no quantification of the uptake is possible. Another strategy to reduce the halo artifact is to void the bladder before PET acquisitions. Neither strategy showed a relevant effect on the presence of the halo artifact (11). To ensure the best possible diagnostic quality and PET quantification in PET/MRI, an improved SC is needed. In this study, the latest SC method for the Biograph mMR PET/MRI system, SP2, was used to evaluate its improved effect on the halo artifact in 68Ga-PSMA PET/MRI of 100 patients with prostate cancer.
SC algorithms in PET/MRI rely on an accurate AC map of the patient tissues. In particular, the frequently occurring truncations along the arms in the AC map due to a limited MRI FOV seem to be an important factor in the occurrence of the halo artifact (9,11). Inaccurate AC due to a limited MRI FOV and, therefore, truncation along patients’ arms in the AC map leads to an increased appearance of the halo artifact (9,11). The state of the art of AC in PET/MRI is a segmentation approach based on a Dixon-VIBE MRI sequence, which divides the MR image into 4 tissue classes (background air, lung, fat, and soft tissue) and assigns predefined linear attenuation coefficients to the segmented tissue regions (24). The latest methods of AC extend the standard Dixon AC map including a bone model approach (25,26) and an MRI-based FOV extension method called B0 homogenization using gradient enhancement, which optimizes the readout gradient to locally compensate for the B0 inhomogeneities and thus the truncations along the arms in the standard Dixon-VIBE AC map (22,27,28). In this study, the latest MRI-based AC methods—SP1 and SP2—were used for both PET data reconstructions to further reduce the halo artifact.
SP2 inherently reduces the presence of the halo artifact from moderate–strong (grade 2–3) to slight–none (grade 0–1). Average SUVs within the halo margin increase by around 325% and, therefore, considerably affect the quantitative assessment of prostate cancer in PET/MRI. Lesions inside the halo margin especially benefit from SP2, with average relative differences of 17.5% being calculated. In this patient cohort, all congruent lesions could be detected in both reconstructions (SP1 vs. SP2) with equivalent visibility ratings. Thus, no lesion was completely missed because of the halo artifact, independent of the SC method used. The average SNR and image noise were not affected by SP2.
The main limitation of this study is that although the improved effects of absolute scaling and SP2 indeed inherently reduce the presence of the halo artifact and improve overall PET image quality, there was no effect on lesion detection in this study population. Because this study was retrospective, postinjection tracer accumulation times showed a larger variation (138 ± 69 min after injection) across the study population. Ideally, the postinjection time should be less variant within the study population. Choosing only patients with confirmed (e.g., by biopsy) prostate carcinoma, as in other studies (8,11,12), potentially could have increased the overall number of detected lesions and case studies and provided a better clinical assessment of the effect of SP2 on lesion detection and quantification. Additionally, the lesions detected in this study may not have been on the detection threshold (not small or faint enough or close enough to the bladder) to be affected by the halo artifact. Nevertheless, the benefit of SP2 on image quality and PET quantification in 68Ga-PSMA PET/MRI is evident. Improved SC is an important precondition to ensure the best possible clinical assessment and diagnostic quality and to increase diagnostic confidence in 68Ga-PSMA PET/MRI of the prostate.
One factor that may have an impact on lesion detection is the duration of the PET data acquisition window. In contrast to previous studies (9,10,12), in which the occurrence and extent of the halo artifact were found to be linked to impaired lesion detection, in the present study all lesions could be detected in all reconstructions, with or without the halo artifact present. In this context, different PET acquisition intervals and associated count statistics may have an impact on lesion detection. The PET acquisition time in the previous studies was 4 min per bed position, but in the present study the PET data of the pelvis were acquired for 10 min or even longer. The prolonged MRI protocol consisting of multiple sequences (e.g., T1, T2, and diffusion-weighted imaging) to generate a choice of soft-tissue contrasts allowed for extended PET data acquisition in this study. The longer PET acquisition times and associated improved count statistics in the present study may have supported the detection of all lesions, even small or faint ones, in the pelvis despite the presence of the halo artifact.
Figure 6 illustrates the potential dependence of lesion visibility on PET acquisition time. In the 10-min interval, all lesions are visible equally despite the halo artifact around the bladder. Like the 10-min interval, the 4-min interval shows better PET image quality and lesion visibility with SP2 than with SP1. However, the 4-min interval shows inherently reduced count statistics, as is to be expected. The overall visibility of the lesions is decreased when compared with the 10-min interval and especially when applying only SP1. Detection of faint lesions within the halo artifact margin may be limited when using short PET acquisition times in combination with nonoptimized SC.
The proposed SC in this study inherently reduces the halo artifact, independent of the PET acquisition time. This is an important aspect for optimized and shorter 68Ga-PSMA PET/MRI protocols aiming at improved patient comfort and throughput. Such a short 68Ga-PSMA PET/MRI protocol, with a 4-min PET acquisition per bed position, is now implemented on the Biograph mMR PET/MRI system, and SP2 will also be tested in this scenario in further studies to ensure the best possible lesion detectability with a reduced halo artifact.
The interest in 68Ga-PSMA PET for staging, therapy, and follow-up of prostate cancer is high (19–21), but the frequent occurrence of the halo artifact presents a challenge. In former 68Ga-PSMA PET/MRI studies, lesions were missed because of the presence of the halo artifact (8,9,11,12). Therefore, an improved SC and reduction of the halo artifact are essential and represent a precondition to ensuring the best possible image quality and clinical assessment in prostate PET/MRI. Quantitative 68Ga-PSMA PET including SUV measurements is not yet fully established for clinical lesion quantification and treatment response assessment. However, the PET signal correlates with the absolute PSMA expression level. Several groups have recently proposed standardized interpretation criteria and lesion follow-up. Thus, reliable SUV measurements may become a critical part of future interpretation systems and clinical assessment (29–31). The reduction or even elimination of the halo artifact is an important precondition for accurate quantification and standardization in this context.
The potential of 68Ga-PSMA PET/MRI of the pelvis and abdomen was demonstrated in several studies (5–7), as this modality combines the excellent diagnostic performance of 68Ga-PSMA PET (e.g., for lymph node metastases) with the soft-tissue contrast and high spatial resolution of MRI, with less radiation exposure than PET/CT. Nevertheless, PET/CT is still referred to as the gold standard (5,7). The halo artifact may occur in both hybrid modalities but particularly in PET/MRI, mostly related to the method of SC. The improved SC version with unrenormalized absolute scaling could inherently reduce the halo artifact in this PET/MRI study. Applying SC with unrenormalized absolute scaling may also be relevant for PET/CT to further reduce the halo artifact.
Although our study found that high uptake in lesions usually is detectable even with a halo artifact present, other studies have found that faint uptake in pathologic structures may be masked by the halo artifact (8,11,12). To avoid false-negative diagnoses and a bias in PET quantification, artifact-free PET images are mandatory independent of the clinical workflow (e.g., sufficient patient hydration and tracer accumulation times). To ensure the visualization of all lesions, we recommend a careful analysis of both scatter-corrected and noncorrected PET images. The vendor-based implementation of the single-scatter-simulation algorithm with absolute scaling and unrenormalized estimated scatter is a robust SC method relevant for 68Ga-PSMA PET/MRI and PET/CT. Further improvements are to be expected with multiple-scatter methods, which are currently under development (17) and will help with scientific evaluation and clinical assessment.
CONCLUSION
For quantitative PET/MRI of prostate cancer using 68Ga-PSMA, proper SC is important to ensure the best possible diagnostic quality and PET quantification. SP2 significantly reduces the halo artifact around the bladder and therefore improves PET/MRI of the prostate. SUVs in the halo margin increased by an average of around 3-fold, therefore considerably affecting the quantitative assessment of prostate cancer in PET/MRI.
DISCLOSURE
The current implementation of the scatter correction was provided by Siemens Healthcare GmbH, Erlangen, Germany. This work was supported by a research agreement between the University Hospital Essen and Siemens Healthcare GmbH. Bjoern Jacoby, PhD, is an employee of Siemens Healthcare GmbH. No other potential conflict of interest relevant to this article was reported.
KEY POINTS
QUESTION: The study purpose was to investigate the impact of SP2 on 68Ga-PSMA PET image quality and quantification in PET/MRI of the prostate in 100 patients.
PERTINENT FINDINGS: SP2 significantly reduced the frequently observed halo artifact around the bladder, thus improving PET image quality and PET quantification in 68Ga-PSMA PET/MRI of the prostate.
IMPLICATIONS FOR PATIENT CARE: The latest SC methods in PET/MRI help to improve diagnostic evaluation of prostate cancer in otherwise frequently artifact-hampered pelvic regions.
Footnotes
Published online Apr. 12, 2019.
- © 2019 by the Society of Nuclear Medicine and Molecular Imaging.
REFERENCES
- Received for publication November 29, 2018.
- Accepted for publication March 18, 2019.


Jump to section
Related Articles
Cited By...
- No citing articles found.