


Article Figures & Data
Figures
- FIGURE 1.
Method for polar map representation of LV myocardial perfusion distribution. (A) Circumferential count profiles are extracted from each short-axis slice from apex to base, depicted here as dashed circles (only 4 shown). (B) Circumferential profiles extracted from each LV short-axis slice plotted as normalized percentage counts extracted vs. angle around short axis for patient with hypoperfused septum. (C) Mapping of individual count profiles into rings, creating polar map.
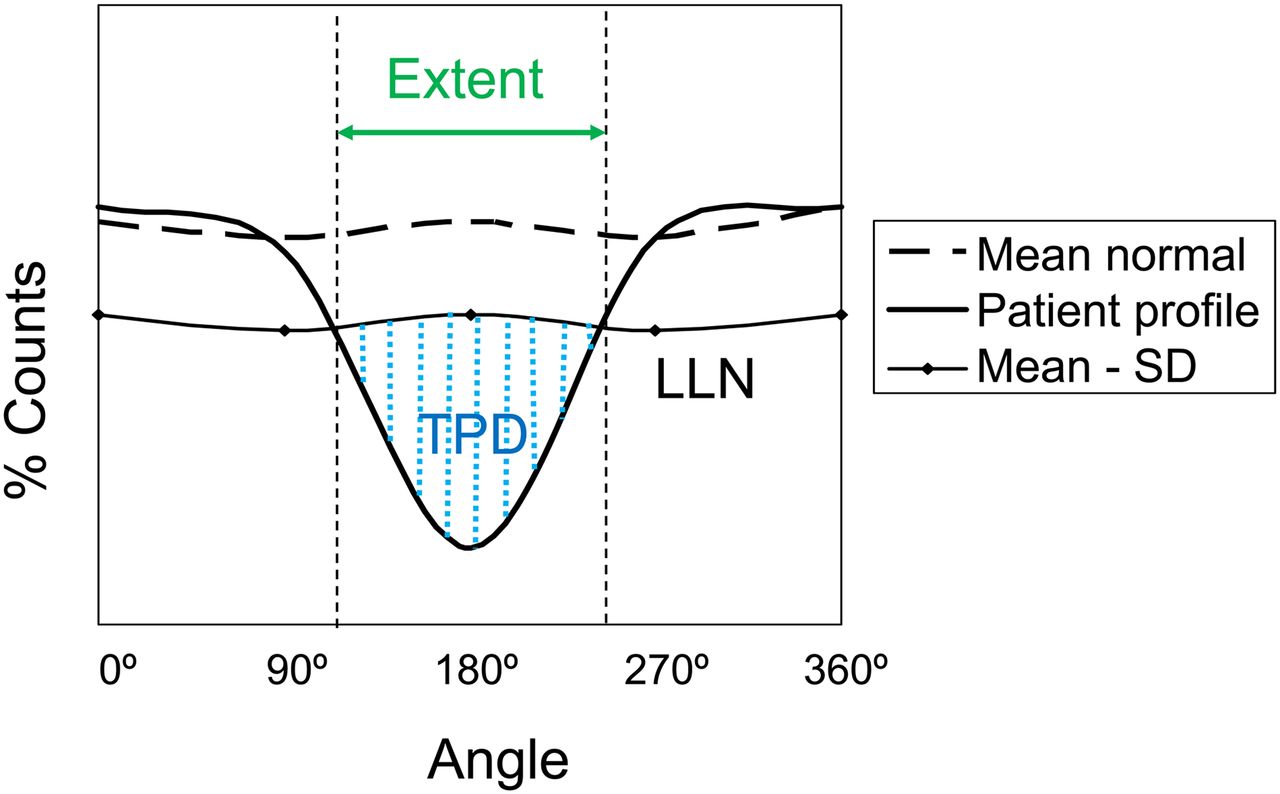
- FIGURE 2.
Methods for detecting and measuring degree of hypoperfusion. Plot depicts how circumferential count profile is tested for abnormality. Patient’s normalized count profile (solid line) is compared against lower limit of normal (LLN) profile calculated as mean normal count response profile minus set number of SDs (usually 2–2.5). Extent of defect is given by angular range of count profile falling below LLN. Severity of deficit may be measured as sum of SD below mean normal profile for all abnormal angular samples. Total perfusion deficit (TPD) is marker of defect severity similar to SSS but measured for each sampled voxel, where each sample is scored from 0 (normal) to 4 (no uptake). Normal polar map generates TPD of 0, and maximally abnormal polar map (no myocardial uptake) would result in TPD of 100%.
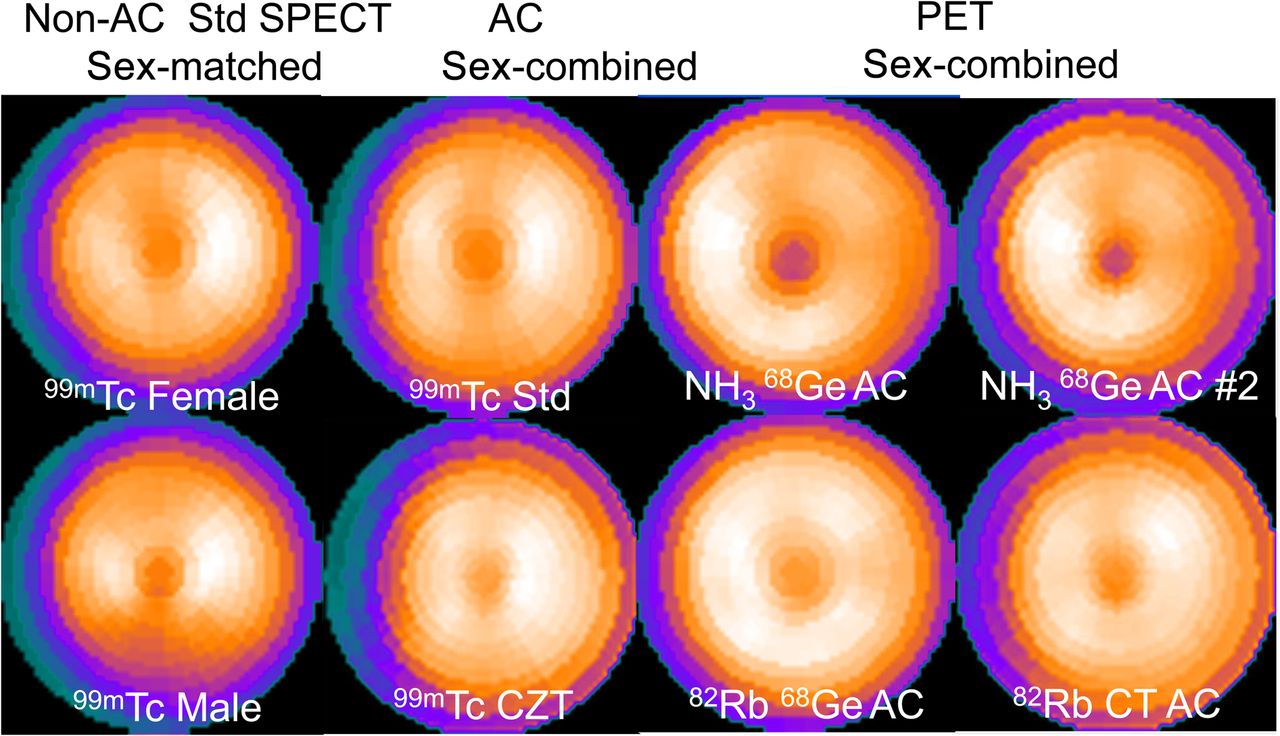
- FIGURE 3.
Comparison of different normal perfusion polar map patterns. Each of the 8 polar maps shown was generated from different patients with low likelihood of CAD as mean normal polar map relative response. Each normal pattern visually differs from the others. For example, attenuation-corrected (AC) normal pattern shows increased relative counts in inferior wall, compared with normal polar map from noncorrected perfusion studies. CZT = cadmium zinc telluride; Std = standard SPECT.
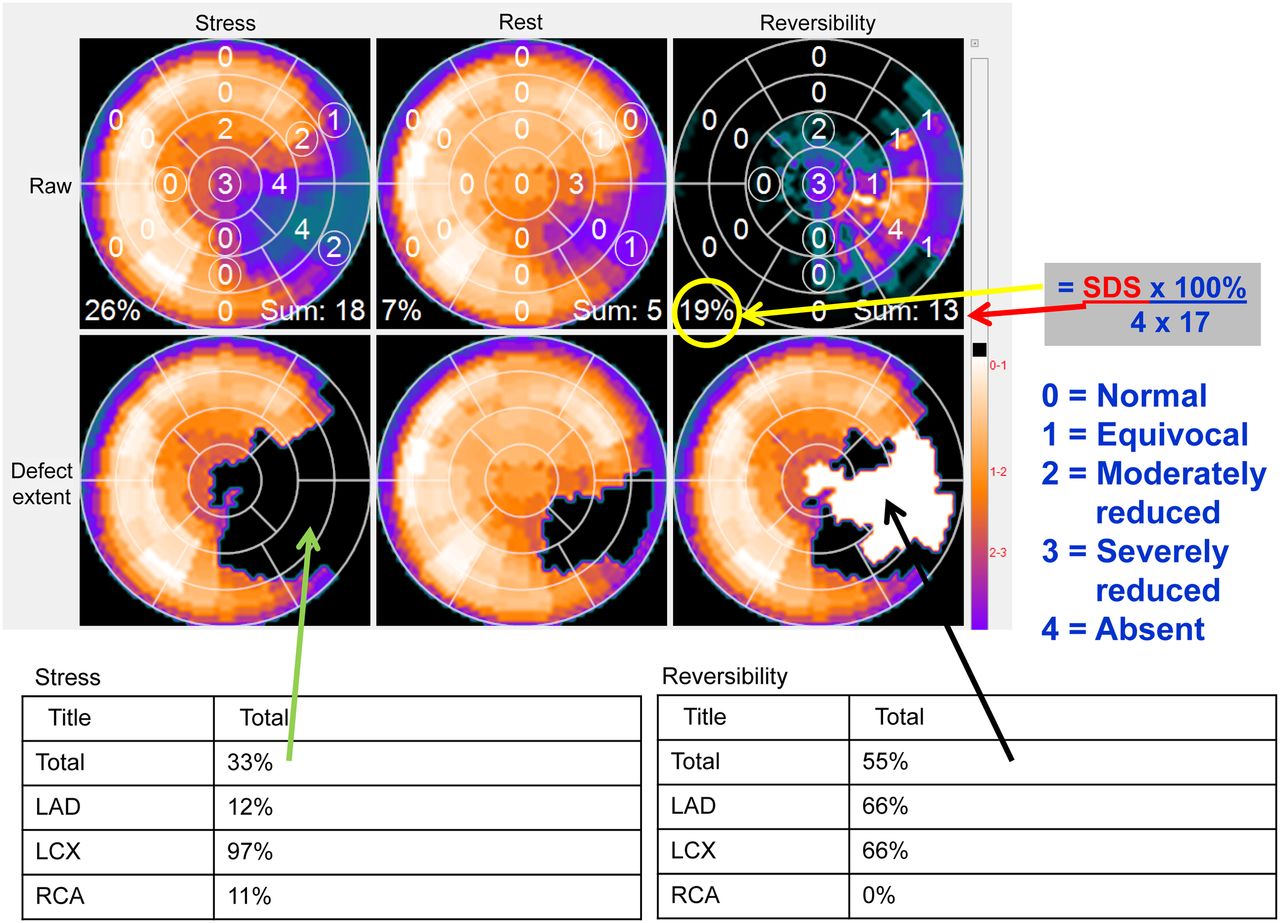
- FIGURE 4.
Methods for measuring degree of ischemic burden. Top row shows stress, rest, and reversibility polar maps scored (0–4) by computer algorithm using 17-segment model and their respective SSS, summed rest score, and SDS. SSS of 18 translates to 26% hypoperfused LV [=100% × 18/(4 × 17)]. SDS of 13 translates to 19% LV ischemic burden, which is greater than 10% threshold for patient benefiting from revascularization and thus candidate for catheterization. Second row shows same polar maps after they have been compared with traditional normal databases explained in Figure 2. Tables below show that defect extent (blackout polar map) is 33% of LV and that 97% of left circumflex (LCX) vascular territory is abnormal, as well as 12% of left anterior descending (LAD) and 11% of right coronary artery (RCA) territories. Reversibility polar map (whiteout) shows that 55% of stress perfusion defect improves at rest.
- FIGURE 5.
Method for detecting and measuring degree of defect reversibility. Plot depicts how circumferential reversibility profile is tested for improvement. Reversibility patient profile is generated by subtracting normalized stress count profile from resting count profile. Angular range that improves in relative perfusion from stress to rest is shown by increasing reversibility above zero. Mean normal reversibility profile hovers around zero since in healthy patients no relative perfusion change is expected between stress and rest. Angular extent of significant reversibility is depicted as portion of reversibility profile that jumps above upper limit of normal reversibility given by mean normal plus statistically determined number of SDs.
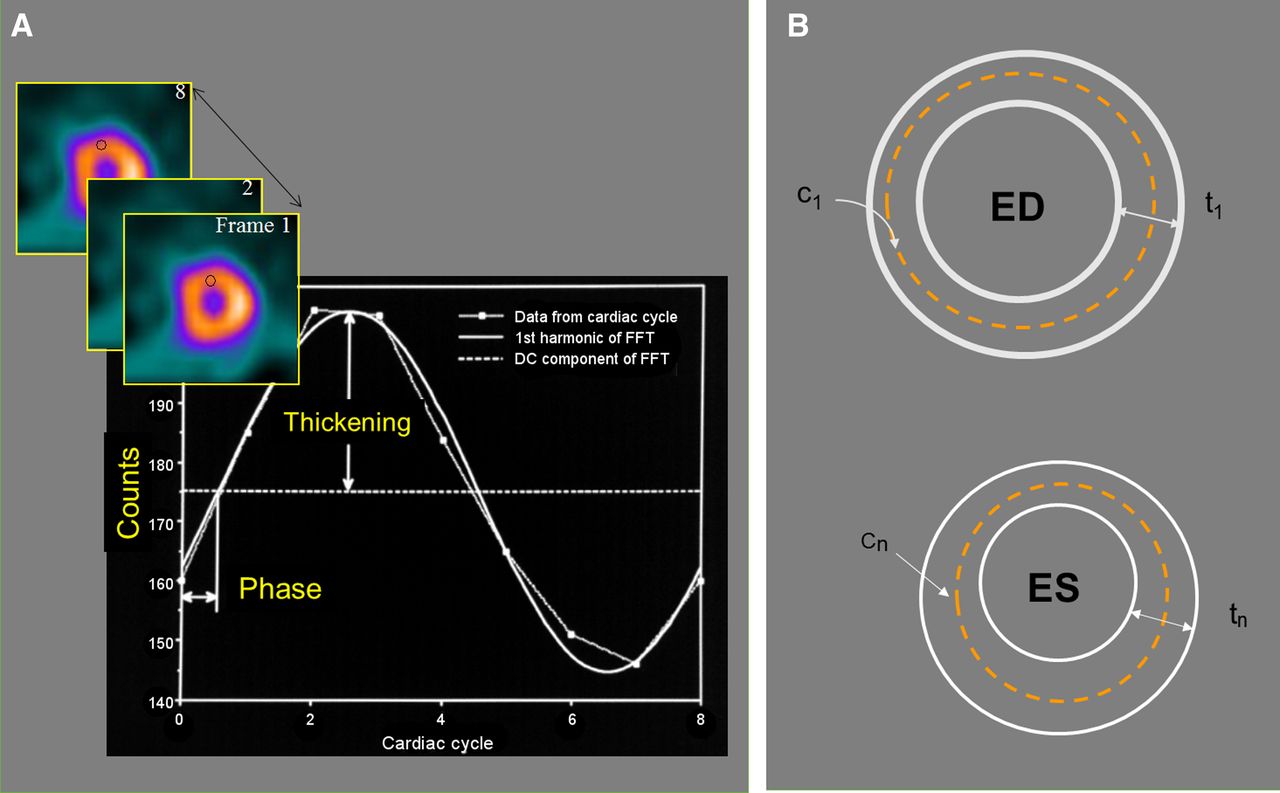
- FIGURE 6.
Method of detecting endocardial and epicardial LV boundaries for measuring global and regional function. (A) Maximal-count 3-dimensional sampling (c) of same LV myocardial region throughout cardiac cycle can be plotted as function of time (frame number) to extract percentage thickening throughout cardiac cycle. (B) Once end-diastolic (ED) 3-dimensional thickness (t) is determined (measured or assumed) to define endocardial and epicardial contours, change in maximal counts from ED is usually used to model how these contours move throughout cardiac cycle. These contours at ED and at end-systole (ES) are used to measure global LVEF, end-diastolic volume, and end-systolic volume. These same contour movements throughout cardiac cycle are used to measure mass, wall motion, and wall thickening, as well as diastolic function parameters. DC = average thickening for segment; FFT = Fast Fourier Transform.
- FIGURE 7.
Method for detecting TID. (Top) TID due to change in LV cavity size dilated during stress as compared with smaller cavity size at rest. Blue ellipses depict hypothetical cavity size (in actuality done in 3 dimensions) to demonstrate difference between TID and transient subendocardial ischemia (TSI) and are not meant to be true detection of endocardial LV border. (Bottom) TID due to subendocardial ischemia during stress that normalizes at rest. Actual size of LV epicardium does not change from stress to rest. This is perhaps better named transient subendocardial ischemia. Cavity volumes at stress and rest are calculated in 3 dimensions from endocardial contours determined by computer algorithm.


Tables
Parameter Threshold Measured Reported References Global (LV) Defect extent (%LV) 3%–5% Always Frequently 36–39 No. of SDs below mean normal 2.5 Always Seldom 36–39 Defect severity (%LV) 3%–5% Always Seldom 24 17-segment model SSS 4 Always Frequently 24 Ischemic burden (%LV) 10%–12% Frequently Frequently 25 Viability (%LV) 7%–20% Frequently Frequently 35 Vascular territory Defect extent (% territory) 3%–12% Always Frequently 36–39 Defect/territory Stress-to-rest improvement 2%–10% Always Frequently 36–39 17-segment model SDS 2 Always Frequently 26 Ranges in thresholds are due to differences in protocols or software used. Potential for measuring the listed quantitative parameters depends on the specific software used, which also includes version number associated with age of algorithms.
Threshold abnormal Parameter Males Females Measured Reported References Systolic/global LVEF (%) <43–52 <51–60 Always Always 36–39,45 End-diastolic volume (mL) >149–197 >102–122 Always Frequently 36–39,45 End-systolic volume (mL) >70–82 >42–46 Always Frequently 36–39,45 LV mass (g) >208 >158 Frequently Seldom 36 Summed thickening score >3 >3 Frequently Seldom 64 Summed wall motion score >3 >3 Frequently Seldom 64 TID 1.14–1.36 1.14–1.36 Always Frequently 55–59,60 Diastolic/global PFR (end-diastolic volume/s) <1.7 Frequently Seldom 46 Time to PFR (ms) >208 Frequently Seldom 46 Note that potential for measuring the listed quantitative parameters depends on the specific software used, which also includes version number associated with age of algorithms.


Jump to section
Related Articles
Cited By...
- No citing articles found.