


Abstract
To improve prostate-specific membrane antigen (PSMA)–targeted theranostic approaches, robust murine models of prostate cancer are needed. However, important characteristics of preclinical PSMA imaging—that is, the reproducibility of the imaging signal and the relationship between quantitative cell surface PSMA expression and lesion detectability with small-animal PET/CT—have not been defined yet. Methods: Murine prostate cancer RM1 sublines (ras myc transformed cells of C57BL/6 prostate origin) expressing varying levels of human PSMA were injected into the shoulder of C57BL/6 mice on day 0. 68Ga-PSMA11 PET/CT was performed on days 7 and 8 and interpreted by 2 masked readers to determine interday and interreader reproducibility. PSMA expression was quantified on days 7 and 8 by flow cytometry of fine-needle aspiration tumor biopsy samples. Cell surface PSMA expression was correlated with PET signal. The threshold for PET positivity was based on the clinical Prostate Cancer Molecular Imaging Standardized Evaluation (PROMISE) criteria. Results: The maximum and average percentages of injected 68Ga-PSMA11 activity per gram of tissue (%IA/g) correlated nearly perfectly as determined by 2 independent readers and on 2 separate days (intraclass correlation coefficient, 1.00/0.89 and 0.95/0.88, respectively). The number of PSMA molecules per cell increased from the RM1-yellow fluorescent protein subline (PSMA−; 2,000/cell) to the RM1-low subline (PSMA+; 17,000/cell), the RM1-medium subline (PSMA++; 22,000/cell), and the RM1-PGLS subline (PSMA-positive, green fluorescent protein–positive, and luciferase-positive; PSMA+++; 45,000/cell). Expression levels correlated with the visual positivity rate on 68Ga-PSMA11 PET and with the PSMA PET %IA/g. The PSMA threshold for PET positivity was approximately 20,000 per cell. Signal correlation was close at lower PSMA levels (RM1-low to RM1-medium; 10–23 %IA/g) but was lost at higher PSMA levels (RM1-medium to RM1-PGLS; 23–27 %IA/g). Conclusion: The in vivo relationship between 68Ga-PSMA11 PET/CT and PSMA expression level in a murine model of prostate cancer was robust for lower cell surface PSMA expression levels (≤22,000/cell). Thus, preclinical 68Ga-PSMA11 PET/CT can be used as an imaging biomarker to test PSMA-targeted interventions in murine models.
Prostate-specific membrane antigen (PSMA)–targeted radioligand therapy (RLT) has recently emerged as a new treatment option for patients with metastatic castration-resistant prostate cancer (1). In this theranostic approach, 68Ga-PSMA11 PET/CT is used to measure PSMA expression on tumor cells. Positive imaging findings are used to stratify patients toward RLT with 177Lu- or 225Ac-labeled PSMA ligands (2,3).
PSMA RLT effectively reduces serum prostate-specific antigen levels, delays disease progression, and improves bone pain in metastatic castration-resistant prostate cancer patients (4–9). However, the disease invariably relapses after an initial significant response.
Robust preclinical models that provide a controlled environment for optimizing PSMA RLT and for developing and testing effective combination therapies are urgently needed. To demonstrate robustness, the characteristics of PSMA-targeted imaging need to be established.
Here, we aimed to, first, determine in a murine model the reproducibility of 68Ga-PSMA11 PET measurements and, second, elucidate whether the degree of 68Ga-PSMA11 tumor uptake can serve as an imaging biomarker of cell surface PSMA expression.
MATERIALS AND METHODS
Cell Culture
RM1 parental cells and RM1 cells stably transduced with human PSMA and SFG-Egfp/Luc (RM1-PGLS; PSMA-positive, green fluorescent protein–positive, and luciferase-positive [PSMA+++]) were provided by Dr. Michel Sadelain (Memorial Sloan-Kettering Cancer Center). Generation of the RM1-yellow fluorescent protein subline (RM1-YFP; YFP only, no PSMA transgene insert [PSMA−]), the RM1-low subline (PSMA+), and the RM1-medium subline (PSMA++) was previously described (10).
PSMA levels on the isogenic murine lines were compared with PSMA expression on the established human prostate cancer cell lines LNCaP (ATCC CRL 1740), C4-2 (ATCC CRL 3314), and 22Rv1 (ATCC CRL 2505). These human cell lines are frequently used in prostate cancer research and express high levels of PSMA. All cell lines were maintained in RPMI 1640 medium supplemented with 10% fetal bovine serum (Omega Scientific) and were grown at 37°C, 20% O2, and 5% CO2.
Mice
Male C57BL/6 mice (6–8 wk old) were housed under pathogen-free conditions and were treated in accordance with the UCLA Animal Research Committee protocol guidelines (protocol 2005-090). Food and water were available ad libitum. On day 0, 0.1 × 10⁶ tumor cells were injected subcutaneously into the shoulder region of C57BL/6 mice. Tumor growth was monitored by caliper measurements in a masked manner. Tumors were resected after the last PET/CT scan and biopsy or on reaching a termination criterion (tumor volume > 1,000 mm3, skin ulcerations, other symptoms of deteriorating mouse condition; 0/20 mice).
Fine-Needle Aspiration (FNA) Biopsy of Subcutaneous Tumors
To correlate the 68Ga-PSMA11 PET signal with cell surface PSMA expression as assessed by flow cytometry, tumor biopsies were taken by FNA on days 7 (all mice) and 8 (RM1-low and RM1-PGLS mice) after tumor induction. A syringe was filled with 0.5 mL of 0.9% sodium citrate/phosphate-buffered saline, and a 25-gauge needle was attached. For tissue harvesting, the needle was inserted into the tumor and a slight negative pressure was applied on the plunger of the syringe. To account for potential tumor heterogeneity, 3 separate locations within a single tumor were sampled and pooled to form a single combined sample per tumor at each time point.
Flow Cytometry
Absolute cell surface PSMA was quantified by flow cytometry based on mean fluorescence intensity using Quantum Simply Cellular antihuman IgG quantification beads (Bangs Laboratory) according to the manufacturer’s instructions. The cells were stained with a monoclonal APC-labeled antihuman PSMA antibody (1:5, clone REA408; Miltenyi Biotec) for 30 min at 4°C. Data were acquired on a 5-laser LSR II cytometer (BD) and analyzed using FlowJo (Three Star) software.
PET/CT Image Acquisition
68Ga-PSMA11 (5 μg of precursor) was obtained from the UCLA Biomedical Cyclotron Facility (10). PET/CT was performed on days 7 (all mice) and 8 (RM1-low and RM1-PGLS mice) after tumor induction (Fig. 1B). Acquisition of static 10-min PET images started 60 min after tracer administration using a preclinical PET/CT scanner (Genisys 8 PET/CT [Sofie Biosciences]; successor of Genisys 4 (11)). Approximately 1.1 MBq of 68Ga-PSMA11 were injected into the tail vein. With a specific 68Ga-PSMA11 activity of 144.3 GBq (3.9 Ci)/μmol at the end of synthesis, this injection corresponded to a mean (±SD) of 27 ± 20 ng of peptide (range, 6–82 ng), or 28 ± 21 pmol (range, 7–86 pmol), per mouse. Images were corrected for photon attenuation, and maximum-likelihood expectation maximization with 60 iterations was used for PET image reconstruction. The CT acquisition parameters were 40 kVp and 190 mA.
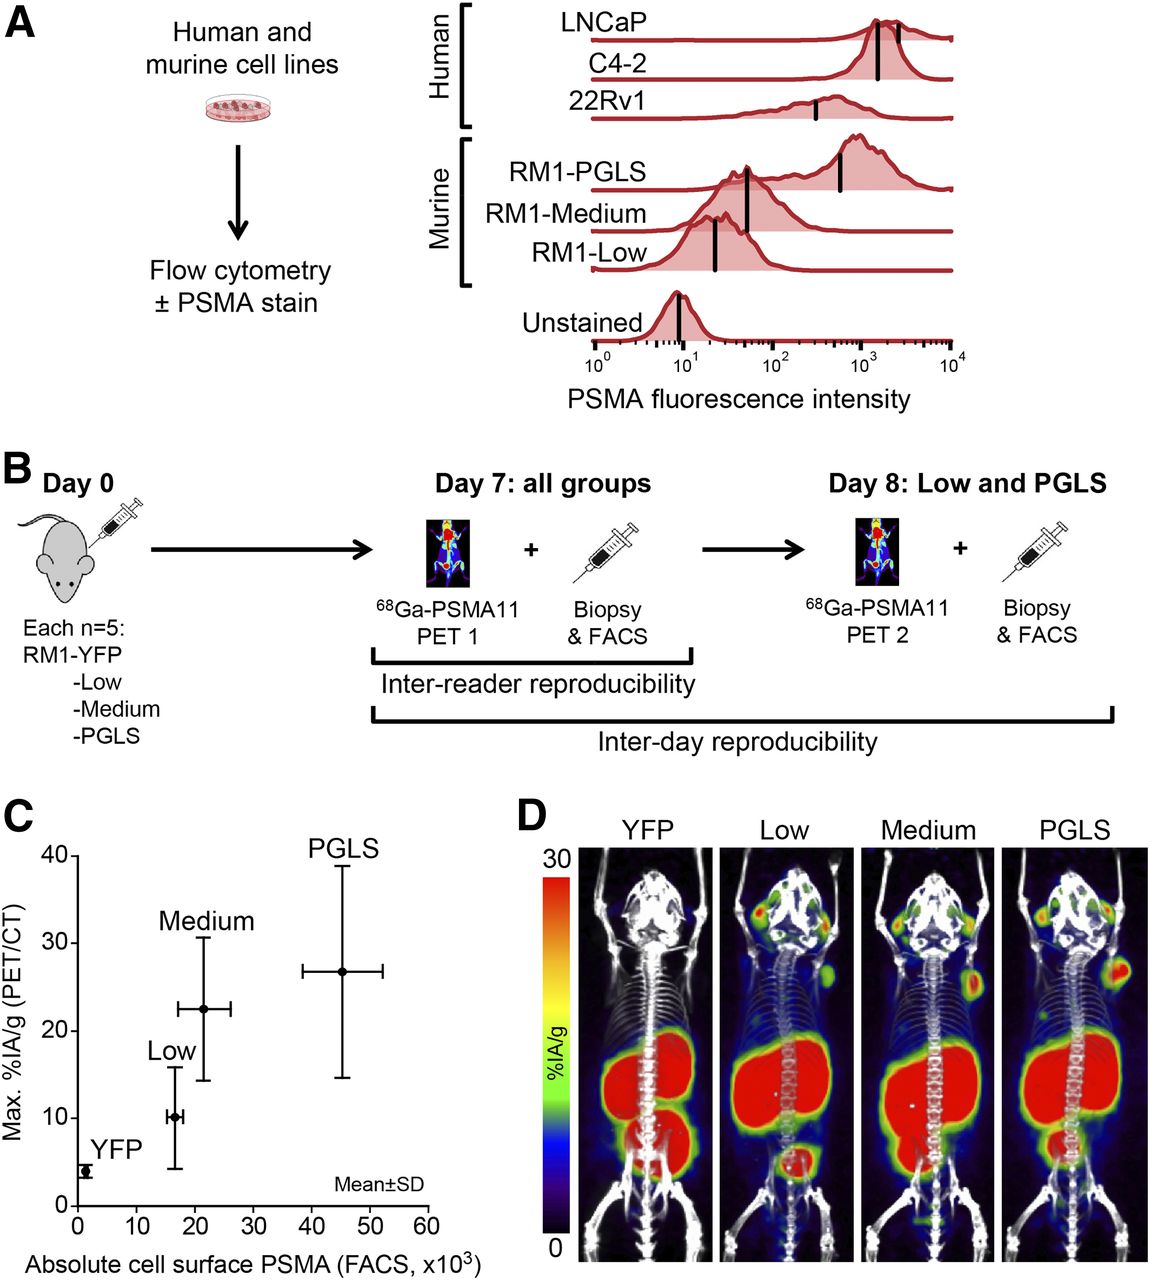
68Ga-PSMA11 PET as a function of absolute cell surface PSMA. (A) PSMA expression as determined in vitro by flow cytometry for an array of human and mouse prostate cancer cell lines. Histograms of fluorescence intensity are shown. Mean fluorescence intensity per cell line is indicated by vertical bars. “Unstained” indicates background level. (B) Experimental design. (C) Mean ± SD for PET maximum %IA/g vs. FACS cell surface PSMA for RM1 cell lines. Data represent 2 independent experiments (n = 5/group, except RM1-YFP [n = 4]). (D) Representative 68Ga-PSMA11 PET/CT maximum-intensity projections. FACS = fluorescence-activated cell sorting.
PET/CT Image Analysis
The PET/CT images were analyzed using OsiriX imaging software (version 3.9.3; Pixmeo SARL). For PET/CT measurements, entire tumors were delineated visually on 7 or more axial slices of the CT scan for each time point. Diameter, volume, and mean and maximum percentage injected activity per gram of tissue (%IA/g) were calculated using the compute-volume function together with an in-house %IA/g plug-in for the OsiriX software. Visual PSMA expression was scored by comparing uptake in tumor and respective reference organs (mediastinal blood pool, liver/gut, salivary glands), as adapted from the clinical Prostate Cancer Molecular Imaging Standardized Evaluation (PROMISE) criteria (Fig. 2A) (12). Average %IA/g was determined for mediastinal blood pool, liver, and muscle (right adductor muscles of the hip) by drawing an 8-mm-diameter circular region of interest in the center of each region. All datasets were analyzed by masked reader 1. For analysis of agreement, RM1-low and RM1-PGLS datasets (days 7 and 8) were analyzed separately by masked readers 1 and 2. Both readers were experienced with 68Ga-PSMA11 PET/CT analysis (>300 preclinical and >3,000 clinical prior reads).

Reproducibility of 68Ga-PSMA11 PET uptake quantification between independent readers and separate time points. Correlation between masked readers 1 and 2 (A and B) and between days 7 (PET1) and 8 (PET2) (C and D) is shown for maximum and average %IA/g.
Study Design
Figure 1B provides an overview of the study design. RM1-YFP, RM1-low, RM1-medium, or RM1-PGLS was injected subcutaneously into 5 mice per group. In the RM1-YFP group, one mouse died before tumor formation (n = 4 remaining). Tumors were allowed to grow for 7 d to reach a diameter of 5 ± 2.2 mm.
On day 7, PSMA expression was analyzed in all mice by 68Ga-PSMA11 PET/CT and by flow cytometry of FNA biopsy samples.
To determine interday reproducibility, mice with RM1-low and RM1-PGLS tumors underwent a repeat 68Ga-PSMA11 PET/CT scan and a repeat FNA biopsy on day 8. Mice with RM1-YFP and RM1-medium tumors were sacrificed on day 7, and mice with RM1-low and RM1-PGLS tumors were sacrificed on day 8.
To validate FNA biopsy–based PSMA quantification, tumors were resected and PSMA expression was assessed in whole-tumor single-cell suspensions by flow cytometry for comparison to the respective FNA sample.
Statistical Analysis
Data are presented as single values or mean ± SD. Reproducibility (interday and interreader) was assessed by intraclass correlation coefficient (ICC, 2-way mixed model, absolute agreement, single measures) with corresponding 95% confidence interval. Interpretation of ICC was based on a reproducibility classification provided by Landis and Koch (13): 0.0, poor; 0.0–0.20, slight; 0.21–0.40, fair; 0.41–0.60, moderate; 0.61–0.80, substantial; 0.81–1.00, almost perfect.
Correlations were sought using Pearson ρ and linear regression tests. A normal distribution of baseline variables was rejected by the Shapiro–Wilk test, and the Mann–Whitney test was used for unpaired comparisons between subgroups. Significance was set at a P value of less than 0.05. The SPSS software package (version 15.0, SPSS, Inc.) was used for all statistical analysis.
RESULTS
Validation of Tumor Model and FNA Biopsy–Based PSMA Quantification
PSMA expression of the murine RM1 and human prostate cancer cell lines (LNCaP, C4-2, and 22Rv1; Fig. 1A) was measured in vitro by flow cytometry. Mean PSMA expression of the RM1-PGLS cells was within one order of magnitude of that of the LNCaP, C4-2, and 22Rv1 cells; all other RM1 sublines expressed at least 1 order of magnitude less PSMA than human cell lines. The PSMA staining intensity of RM1-low cells was barely above the background level (Fig. 1A).
On day 7 after inoculation, the CT volumes and diameters of RM1-YFP, RM1-low, RM1-medium, and RM1-PGLS xenografts did not differ significantly (Supplemental Figs. 1A and 1B; supplemental materials are available at http://jnm.snmjournals.org).
The reproducibility of absolute receptor counts from repeat FNA tumor biopsies on days 7 and 8 was almost perfect (ICC, 0.95; Supplemental Fig. 1C). Absolute PSMA counts from FNA and whole-tumor samples agreed nearly perfectly (Pearson ρ = 0.96; linear slope, 1.0; intercept, 1 × 10³; Supplemental Fig. 1D), validating the biopsy method.
Interreader Reproducibility of 68Ga-PSMA11 PET/CT
The reproducibility of 68Ga-PSMA11 PET/CT signals (%IA/g, tumor volume, and visual PSMA expression) was determined by 2 independent readers (Figs. 2A and 2B). Reproducibility was almost perfect for maximum and average %IA/g (ICC, 1.00 and 0.95, respectively; Table 1, Figs. 2A and 2B) and was substantial for tumor volume (ICC, 0.71) and visual PSMA expression score (ICC, 0.69). Readings of background activity in the blood pool (ICC, 0.56), liver (ICC, 0.51), and muscle (ICC, 0.68) varied. 68Ga-PSMA11 uptake was low, overall, in these organs (Supplemental Table 1; Figs. 1D and 3B).
Interreader Reproducibility

Rate of RM1-medium and RM1-PGLS tumors (≥20 × 103 PSMA receptors per cell surface) visually positive for prostate cancer on 68Ga-PSMA11 PET/CT. (A) PET images were rated by masked reference reader based on visual PSMA expression score adapted from PROMISE criteria (12). Patient and mouse maximum-intensity 68Ga-PSMA11 PET projections are shown. All mice bearing RM1-medium or RM1-PGLS tumors were scored as 2 or 3 (positive), whereas more than half of mice bearing RM1-low or RM1-YFP tumors were rated negatively. (B) Intraindividual comparison of RM1-low (single arrow) versus RM1-medium (doubled arrow) tumors in separate experiment.
Interday Reproducibility 68Ga-PSMA11 PET/CT
68Ga-PSMA11 PET/CT was repeated in mice bearing RM1-low and RM1-PGLS tumors. The PET/CT results for days 7 versus 8 revealed almost perfect reproducibility for maximum (ICC, 0.89) and average (ICC, 0.88) PET activity (Table 2; Figs. 2C and 2D). Reproducibility for tumor volume (ICC, 0.76) and visual PSMA expression score (ICC, 0.57) was substantial and moderate, respectively. PET uptake in the blood pool (ICC, 0.06), liver (ICC, 0.04), and muscle (ICC, 0.19) was slightly reproducible (compare Supplemental Table 1 for %IA/g).
Interday Reproducibility
68Ga-PSMA11 PET Signal as Function of Absolute Cell Surface PSMA Expression
On day 7, the mean tumor diameter was 5 ± 2.1 mm and the mean tumor volume was 76 ± 35 mm3. Although tumor size was comparable across groups, the PET signal (%IA/g) differed significantly (Supplemental Figs. 1A and 1B and Fig. 1C).
To characterize the 68Ga-PSMA11 PET signal, PET tumor activity (%IA/g) was plotted as a function of the number of PSMA molecules per cell (FNA biopsy samples). Both mean PSMA expression by flow cytometry and PET signal increased from RM1-YFP to RM1-low, RM1-medium, and RM1-PGLS (Table 3; Fig. 1C). PET signal and flow cytometric PSMA expression increased 2.2- and 1.3-fold, respectively, from RM1-low to RM1-medium (17,000 vs. 22,000/cell by flow cytometry). In contrast, doubling of PSMA expression in RM1-PGLS versus RM1-medium (45,000 vs. 22,000/cell) resulted in only a 1.2-fold increment of the PET signal (Fig. 1C). Representative 68Ga-PSMA11 PET/CT maximum-intensity projections for the different groups are shown in Figure 1D.
PSMA Expression In Vivo
Visual Image Analysis
Because biodistribution in the reference organs is visually similar, the recently proposed PROMISE criteria were applied to the murine model (Fig. 3A). These criteria guide the visual interpretation of PSMA-ligand PET/CT based on reference organ uptake (12). All mice (10/10, 100%) bearing RM1-medium or RM1-PGLS tumors were scored positively (score 2 or 3). In contrast, only 2 of 5 mice (40%) bearing RM1-low tumors, and none of the mice bearing RM1-YFP tumors (0/4; 0%), were scored positively (Fig. 3A).
In view of the significant increase in the positivity rate from RM1-low to RM1-medium tumors, we investigated the visual detection threshold for 68Ga-PSMA11 PET/CT in the current experimental setting and determined it to be about 20,000 PSMA molecules per cell.
For intraindividual comparison, RM1-low and RM1-medium tumors were induced in the opposing shoulders of 2 mice. The PET signal was visually positive for the RM1-medium tumors but negative for the RM1-low tumors (Fig. 3B).
DISCUSSION
Enthusiasm for PSMA as a theranostic target has risen in recent years. Reasons for this interest include the observation that PSMA is overexpressed in more than 90% of prostate cancers and in the neovasculature of other solid tumors (14), the high accuracy of PSMA-targeted PET/CT for staging PSMA-expressing prostate cancer (15–18), and the development of effective PSMA-targeted RLTs using 177Lu or 225Ac (3,4). However, although prospective data suggest that RLT is effective (9), cure has remained an elusive goal.
Developing effective and rational RLT-based combination therapies requires appropriate preclinical models. For instance, the imaging signal from PSMA small-animal PET/CT studies needs to be reproducible. Moreover, the imaging signal should faithfully reflect the degree of tumor target expression.
To test reproducibility and the relationship between target expression and imaging signal, we determined absolute cell surface PSMA expression from biopsy samples in a murine model of prostate cancer. In this model of monoclonal cell lines, PSMA expression was differential but tumor sizes comparable (∼5 mm in diameter).
We first showed that the reproducibility of the 68Ga-PSMA11 PET signal was almost perfect in RM1 tumors, both for independent readers and for separate time points. We then confirmed this reproducibility for tumors with high and low PSMA expression in our model. The somewhat lower repeatability of visual image interpretation might have been caused by overlap of kidney uptake with the reference organ (liver/gut), which confounds murine data to a greater degree than patient data (Fig. 2A). Likewise, the overall low PET signal (%IA/g) from the blood pool, liver, muscles, and background might have affected interreader and interday reproducibility for organ uptake. Both the high kidney uptake and the very low background, blood, liver, and muscle PET signals are in line with other studies reporting the biodistribution of 68Ga-PSMA11 in mice (19,20). From day to day and reader to reader, regions of interest could not be placed identically; rather, there was a slight variation in location and, thus, in %IA/g readings. Because absolute PET uptake was so low, these small differences resulted in nonproportionally large errors, reducing reproducibility. Thus, organ uptake data in small-animal 68Ga-PSMA11 PET/CT should be treated with caution. Our findings for interday reproducibility were consistent with previous studies on mice bearing PSMA+/− PC3 xenografts (20).
68Ga-PSMA11 small-animal PET/CT tumor uptake correlated with absolute cell surface PSMA expression at low expression levels (RM1-low vs. RM1-medium). In our model, approximately 20,000 PSMA molecules per tumor cell surface were identified as the threshold for positive PET readings. This threshold was about 10 times lower than the surface expression in the human prostate cancer cell lines LNCaP and C4-2 (∼190,000 and 240,000 receptors per cell, respectively). These findings suggest that the threshold for preclinical PET positivity is rather low. Although PSMA PET seems to detect small changes in PSMA molecules per cell at low expression levels, this sensitivity is lost at higher PSMA levels (1.2-fold PET signal increase between 22,000 and 45,000/cell).
The accuracy of quantitative PET depends on several scanner-dependent factors, including spatial and energy resolution, sensitivity, specific activity of the radioligand (i.e., the ratio of radiolabeled and cold ligand in the preparation), and biologic variables such as receptor saturation (21–23). Though conditions were constant across groups, one or more of these factors might have confounded the correlation between tumor 68Ga-PSMA11 uptake and PSMA expression measured via flow cytometry from biopsy samples.
Our study had some limitations. PET signal is a function of target expression per cell, the number of cells expressing that target, and the resolution of the imaging system. Thus, large tumors with very low PSMA expression per cell might still be detectable because of a high number of PSMA-positive tumor cells, whereas small tumors with high expression per cell might not be detectable because of the partial-volume effect. We addressed this limitation by imaging tumors of comparable size across groups—a size well above the spatial resolution of our Genisys 8 PET/CT system (24).
Furthermore, uptake of the radioligand may be influenced by target internalization, vascularization, and vascular permeability (10,25). PET signal is influenced by acquisition and reconstruction parameters (26,27). We tried to minimize these variables using a transduced monoclonal cell line and the same imaging settings for all groups. Our cell line has demonstrated internalization similar to that of the human prostate cancer line in vitro (10). However, there may be other, more important, confounding factors depending on cell lines, mouse strains, tumor models (e.g., subcutaneous vs. orthotopic or systemic), and PET protocol.
CONCLUSION
This study characterizing the use of 68Ga-PSMA11 PET/CT in a murine model of prostate cancer has demonstrated the reproducibility of image findings across readers and time points and has established a relationship between image signal and PSMA expression level, with a low expression threshold for PET positivity. We thus provide a reference for the use of 68Ga-PSMA11 PET/CT as an imaging biomarker to monitor cellular PSMA expression noninvasively in mice. Ongoing studies will investigate the value of 68Ga-PSMA11 signal for developing, planning, and evaluating PSMA-based therapies in animal models.
DISCLOSURE
This study was partially funded by the U.S. Department of Energy, Office of Science Award (DE-SC0012353), the UCLA SPORE in Prostate Cancer (P50 CA092131), and the Prostate Cancer Foundation (2017CHAL1953). Jeremie Calais is the recipient of grant SAE20160604150 from Fondation ARC Pour la Recherche Sur le Cancer. Wolfgang Fendler and Katharina Lückerath each received a scholarship from the German Research Foundation (Deutsche Forschungsgemeinschaft [DFG], grants 807122 and 807454, respectively). Matthias Eiber was supported by the SFB 824 (DFG Sonderforschungsbereich 824, project B11). Johannes Czernin and Caius Radu are cofounders and hold equity in Sofie Biosciences and Trethera Therapeutics. Intellectual property has been patented by the University of California and has been licensed to Sofie Biosciences and Trethera Therapeutics. No other potential conflict of interest relevant to this article was reported.
Acknowledgments
We thank Larry Pang for his assistance with PET/CT imaging studies. We acknowledge the UCLA Biomedical Cyclotron for producing the PET probes used in this study.
Footnotes
Guest Editor: Michael M. Graham, University of Iowa
Published online Mar. 30, 2018.
- © 2018 by the Society of Nuclear Medicine and Molecular Imaging.
REFERENCES
- Received for publication January 1, 2018.
- Accepted for publication March 19, 2018.


Jump to section
Related Articles
Cited By...
- 18F-PSMA Cerenkov Luminescence and Flexible Autoradiography Imaging in a Prostate Cancer Mouse Model and First Results of a Radical Prostatectomy Feasibility Study in Men
- PSMA-Directed Imaging and Therapy of Salivary Gland Tumors: A Single-Center Retrospective Study
- Administration Routes for SSTR-/PSMA- and FAP-Directed Theranostic Radioligands in Mice
- Preclinical Evaluation of 213Bi- and 225Ac-Labeled Low-Molecular-Weight Compounds for Radiopharmaceutical Therapy of Prostate Cancer
- The PSMA-targeting Half-life Extended BiTE Therapy AMG 160 has Potent Antitumor Activity in Preclinical Models of Metastatic Castration-resistant Prostate Cancer
- Improving 68Ga-PSMA PET/MRI of the Prostate with Unrenormalized Absolute Scatter Correction
- Novel Structured Reporting Systems for Theranostic Radiotracers