


Article Figures & Data
Figures
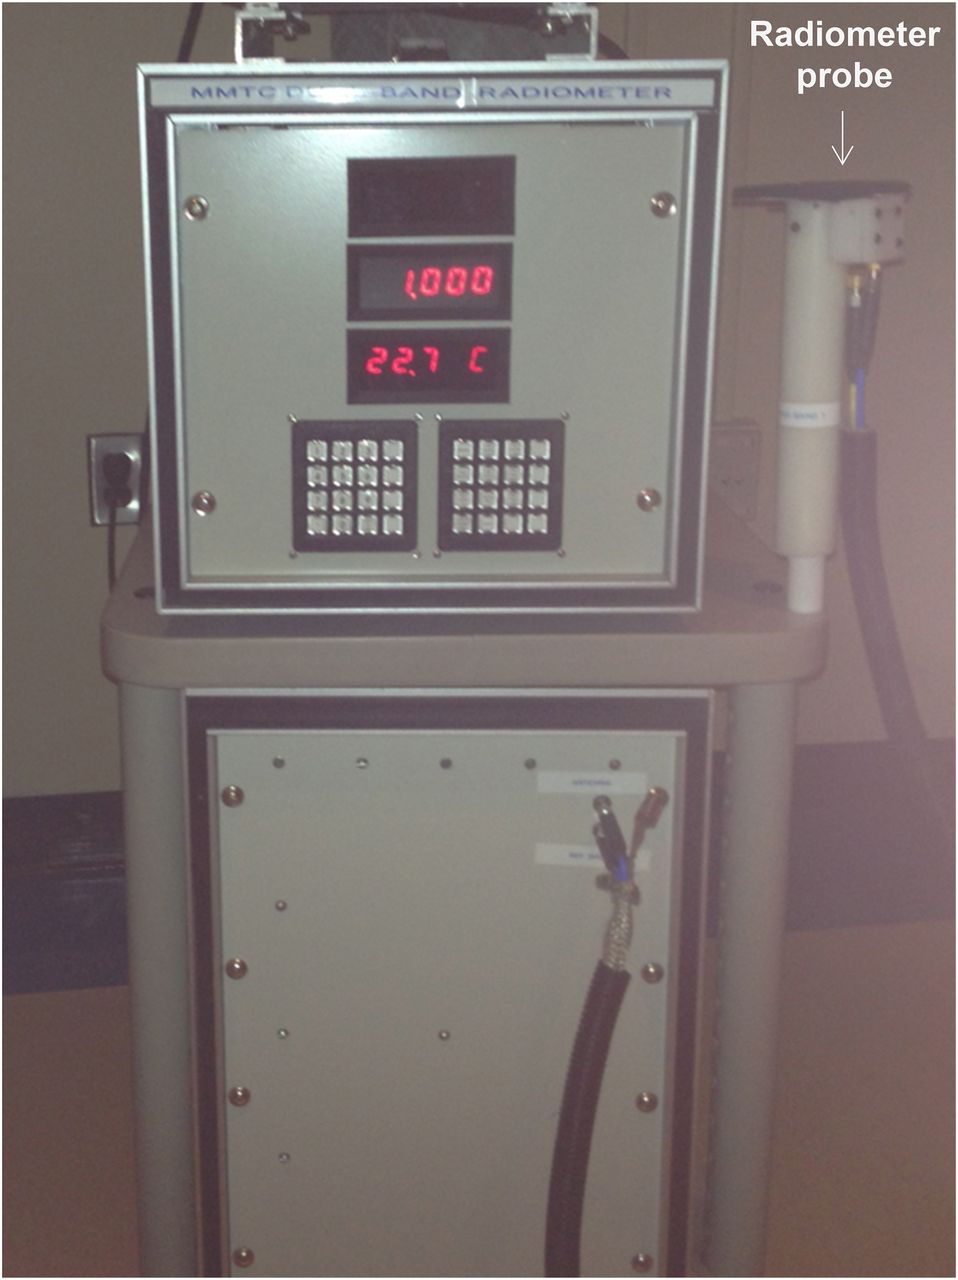
- FIGURE 1.
Microwave radiometry system used in this study.
- FIGURE 2.
BAT maximization (A) and minimization (B) protocols. During maximization, each participant was exposed to cold for about 2 h before PET/CT imaging. Minimization protocol was organized in same way, with 20-mg dose of propranolol replacing start of cold exposure. MRAD = microwave radiometry.
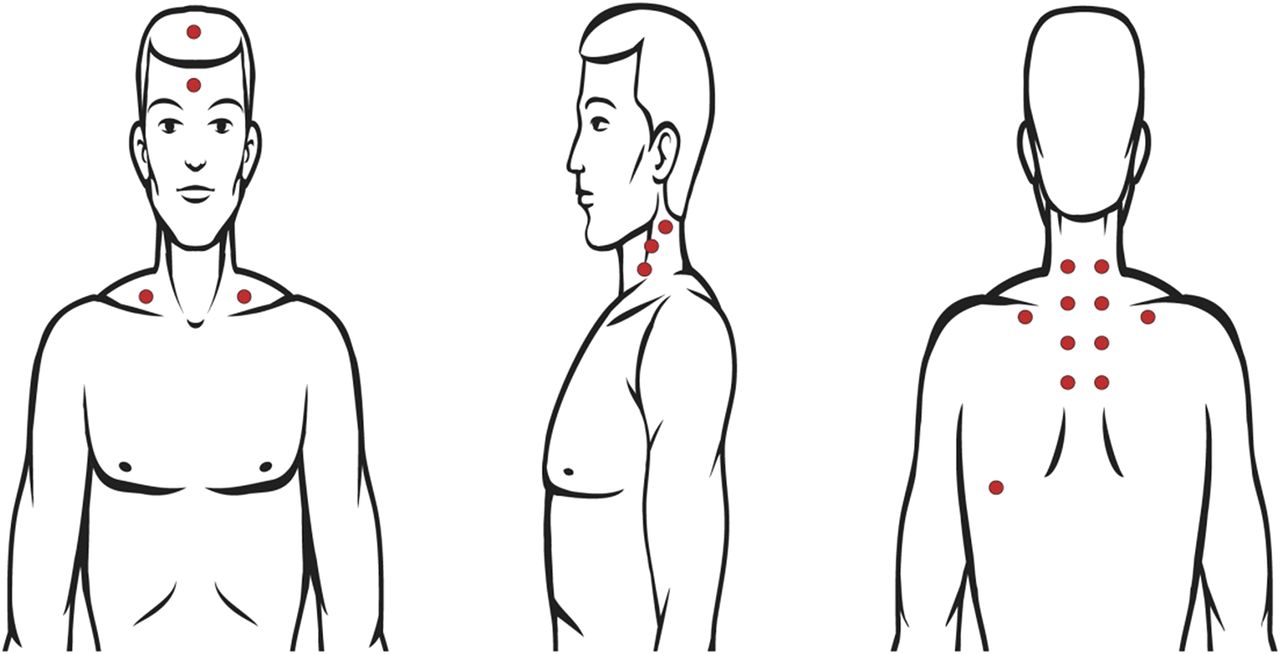
- FIGURE 3.
Diagram showing representative points at which radiometry data were collected. Surgical marker was used to draw sets of collection points, including multiple points on both sides of neck. Same grid was drawn during both maximization and minimization protocols, and photograph was taken for comparison with PET/CT images.
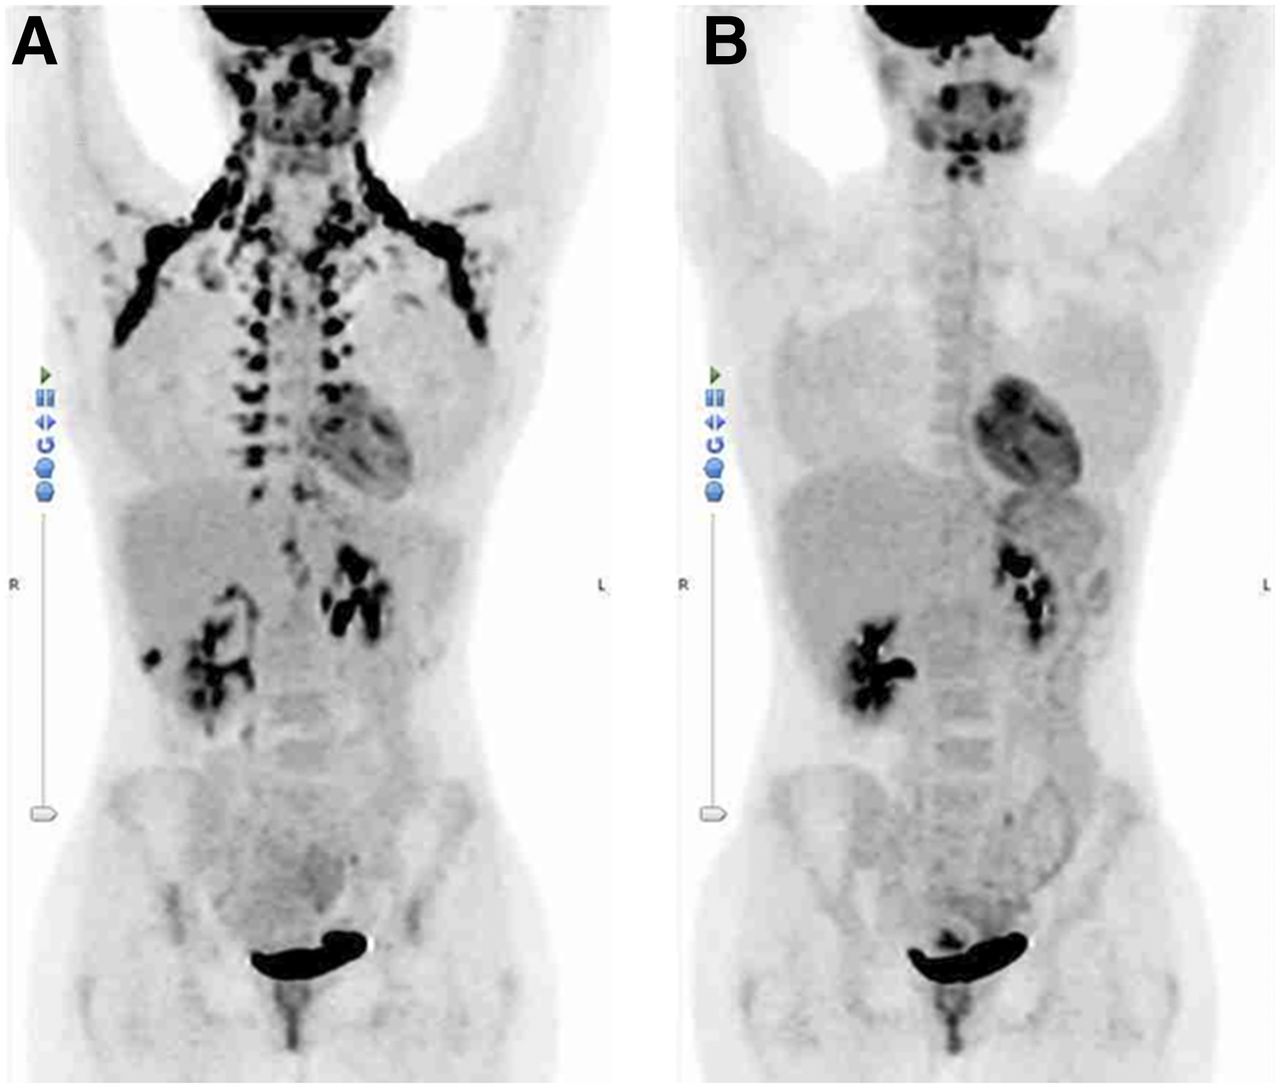
- FIGURE 4.
Representative BAT maximization (A) and minimization (B) 18F-FDG PET images (anterior maximum-intensity projections). Extensive BAT activity is seen after maximization, but no activity is seen after minimization 8 d later. Normal activity in brain, salivary glands, heart, and bladder is consistent between the two images.
- FIGURE 5.
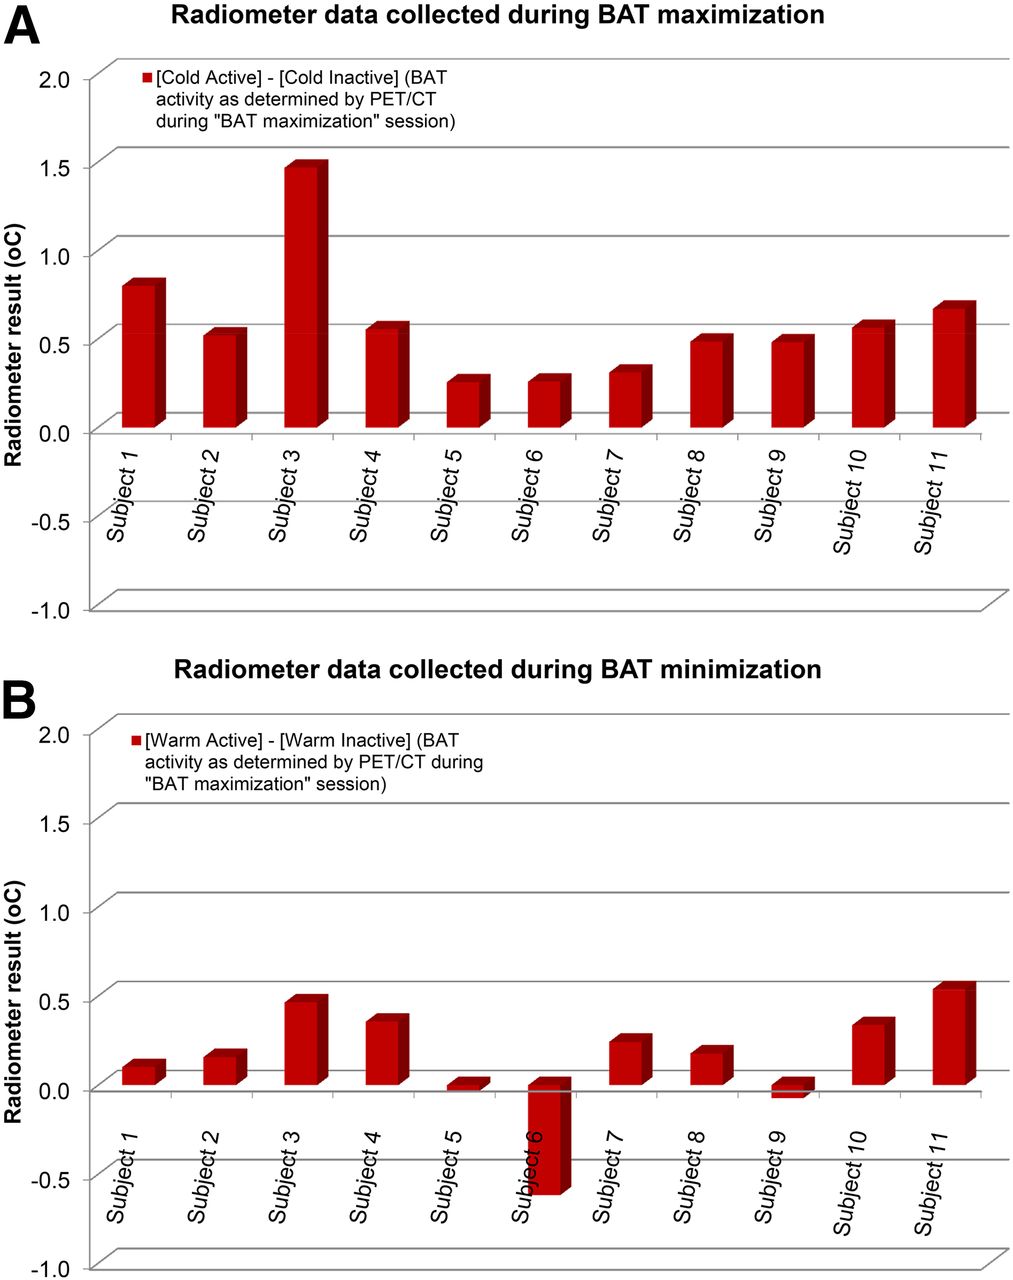
Comparison of radiometry measurements between BAT maximization (A) and minimization (B) studies. Mean measurements at data collection points over active BAT differ significantly from those over inactive BAT during maximization but not during minimization. Same data collection points were measured in both studies.
- FIGURE 6.
Receiver-operating-characteristic curve. Using 18F-FDG PET/CT as gold standard, area under curve was 0.88 (P = 0.003). At difference cutoff of 0.48 (i.e., difference between BAT maximization and minimization protocols at each data collection point), radiometry sensitivity and specificity for detecting activated BAT were 72.7% and 90.9%, respectively, and likelihood ratio was 8.0.


Tables
Characteristic Data Sex (n) Male 2 Female 17 Age (y) Mean ± SD 24.8 ± 2.9 Range 21–32 Body mass (kg) Mean ± SD 56.5 ± 4.6 Range 48.0–63.0 Height (m) Mean ± SD 1.7 ± 0.1 Range 1.6–1.8 Body mass index (kg/m2) Mean ± SD 19.7 ± 1.3 Range 17.0–23.1


Jump to section
Related Articles
Cited By...
- No citing articles found.