


Abstract
The objective of this study was to evaluate the effect of including bone in Dixon-based attenuation correction for 18F-fluciclovine PET/MRI of primary and recurrent prostate cancer. Methods: 18F-fluciclovine PET data from 2 PET/MRI studies—one for staging of high-risk prostate cancer (28 patients) and one for diagnosis of recurrent prostate cancer (81 patients)—were reconstructed with a 4-compartment (reference) and 5-compartment attenuation map. In the latter, continuous linear attenuation coefficients for bone were included by coregistration with an atlas. The SUVmax and mean 50% isocontour SUV (SUViso) of primary, locally recurrent, and metastatic lesions were compared between the 2 reconstruction methods using linear mixed-effects models. In addition, mean SUVs were obtained from bone marrow in the third lumbar vertebra (L3) to investigate the effect of including bone attenuation on lesion–to–bone marrow SUV ratios (SUVRmax and SUVRiso; recurrence study only). The 5-compartment attenuation maps were visually compared with the in-phase Dixon MR images for evaluation of bone registration errors near the lesions. P values of less than 0.05 were considered significant. Results: Sixty-two lesions from 39 patients were evaluated. Bone registration errors were found near 19 (31%) of these lesions. In the remaining 8 primary prostate tumors, 7 locally recurrent lesions, and 28 lymph node metastases without bone registration errors, use of the 5-compartment attenuation map was associated with small but significant increases in SUVmax (2.5%; 95% confidence interval [CI], 2.0%–3.0%; P < 0.001) and SUViso (2.5%; 95% CI, 1.9%–3.0%; P < 0.001), but not SUVRmax (0.2%; 95% CI, −0.5%–0.9%; P = 0.604) and SUVRiso (0.2%; 95% CI −0.6%–1.0%; P = 0.581), in comparison to the 4-compartment attenuation map. Conclusion: The investigated method for atlas-based inclusion of bone in 18F-fluciclovine PET/MRI attenuation correction has only a small effect on the SUVs of soft-tissue prostate cancer lesions, and no effect on their lesion–to–bone marrow SUVRs when using signal from L3 as a reference. The attenuation maps should always be checked for registration artifacts for lesions in or close to the bones.
Medical imaging plays an increasingly important role in the management of prostate cancer, which is the most frequently detected type of cancer in men in developed countries (1). Multiparametric MRI, that is, the combination of anatomic T2-weighted imaging and functional diffusion-weighted and dynamic contrast-enhanced imaging, is currently recommended for staging of primary prostate cancer (2), whereas molecular imaging with PET has shown promise for the detection of primary and recurrent prostate cancer (3–7). Since the introduction of integrated PET/MRI scanners, these complementary datasets can be simultaneously acquired, thereby potentially improving the diagnostic accuracy in comparison to either modality alone (3,4,8,9).
In contrast to CT, however, MRI does not provide an estimate of the electron densities that determine the attenuation of the 511-keV annihilation photons in the patient’s body. Correction for attenuation, which is required for quantitatively accurate PET imaging, is therefore technically challenging on a PET/MRI system. In current clinical practice, fast T1-weighted or Dixon MR scans are used to create an attenuation map with fixed linear attenuation coefficients for 3 (soft tissue, lung, background air) (10) or 4 (soft tissue, fat, lung, and background air) segmented compartments (11), respectively. In both cases, the linear attenuation coefficient of soft tissue is assigned to bones, typically leading to an underestimation of the SUVs in lesions in and near bony structures (12,13). In a simulation study with known ground truth, Keereman et al. estimated the underestimation of SUVs in the prostate region to be around 4% (13).
Paulus et al. recently presented a method to solve this issue, by including continuous bone linear attenuation coefficients in the Dixon-based attenuation map, based on coregistration of the Dixon images with an atlas of MR and CT pairs of the major bones in the body (14). This method, which is currently implemented on Siemens mMR PET/MRI scanners, was reported to substantially reduce the underestimation of SUV in bone lesions (14,15) and soft-tissue lesions in the brain (16). The effect on the SUV in soft-tissue lesions in the body, on the other hand, was particularly small (14,15). However, the latter results were derived from PET/MRI data with 18F-FDG, a radiotracer that is not useful in the context of prostate cancer. Consequently, the effect of model-based inclusion of bone attenuation values has not been assessed for clinical prostate cancer imaging. Incorrect bone attenuation values could affect the quantitative accuracy of prostate (bed), lymph node, and bone lesion SUVs in the bone-dense pelvis, as well as obscure the qualitative comparison with uptake in spinal bone marrow, which is a commonly used evaluation criterion in clinical practice (17).
The objective of this work was therefore to investigate the effect of including bone in Dixon-based attenuation correction for PET/MRI of primary and recurrent prostate cancer. For this purpose, we retrospectively analyzed a cohort of patients examined with 18F-fluciclovine (anti-1-amino-3-18F-fluorocyclobutane-1-carboxylic acid) PET/MRI, which is a Food and Drug Administration– and European Medicines Agency–approved radiotracer for use in recurrent prostate cancer.
MATERIALS AND METHODS
Patients
In this work, we retrospectively reconstructed and analyzed 18F-fluciclovine PET/MRI data from 2 prospective studies performed at our institution (St. Olavs Hospital, Trondheim University Hospital). The first study, which will be referred to as the staging study, included patients classified as high-risk according to modified D’Amico criteria (prostate-specific antigen > 20 ng/mL or clinical stage ≥ cT3a or Gleason score ≥ 8) to investigate the merit of combined 18F-fluciclovine PET/MRI for locoregional staging of primary prostate cancer (ClinicalTrials.gov; identifier NCT02076503) (18). The second study, which will be referred to as the recurrence study, included patients that fulfilled the European Association of Urology criteria for biochemical relapse after radical treatment (2 consecutive measurements with prostate-specific antigen ≥ 0.2 ng/mL after radical prostatectomy or prostate-specific antigen ≥ 2.0 ng/mL above the nadir after definitive radiotherapy) to investigate the diagnostic accuracy of combined 18F-fluciclovine PET/MRI for detection of recurrent prostate cancer (ClinicalTrials.gov; identifier NCT02562131). Both studies were approved by our institution and the Regional Committee for Medical and Health Research Ethics Central Norway. All patients gave written informed consent before enrollment.
Imaging and Reconstruction
Both imaging studies were performed on a 3-T Biograph mMR PET/MRI scanner (Siemens Healthcare GmbH). All PET images were offline reconstructed (Siemens HDPET, 3 iterations, 21 subsets, gaussian filter of 4 mm in full width at half maximum) using 4-compartment (soft tissue, fat, lung, and background air) and 5-compartment (soft tissue, fat, lung, background air, and bone) attenuation maps. Both attenuation maps were created from the Dixon MR series (first echo time, 1.23 ms; second echo time, 2.46 ms; repetition time, 3.6 ms; voxel size, 4.1 × 2.6 × 3.1 mm; field of view, 500 × 329 × 400 mm) using the dedicated tool for offline generation of attenuation maps available on the software platform (syngo MR E11P; Siemens Healthcare GmbH) of the scanner. In short, for the 4-compartment attenuation map, soft tissue, fat, lung, and air voxels were automatically segmented and assigned fixed 511-keV linear attenuation coefficients of 0.1000, 0.0854, 0.0224, and 0 cm−1, respectively. For the 5-compartment attenuation map, continuous bone linear attenuation coefficients were superimposed on the 4-compartment attenuation map by coregistration of the Dixon series to an atlas of MR and CT pairs of the major bones in the body, as described in more detail by Paulus et al. (14).
In the staging study, the PET images for evaluation of lymph node metastases covered the lymph nodes from the pelvic floor up to the ureteral crossing of the common iliac vessels, as previously described (8,19), and were reconstructed from the counts in a time-window 5–10 min after tracer injection. The PET images for evaluation of prostate tumors were centered on the prostate and were reconstructed from the counts in a time window 33–38 min after tracer-injection. In the recurrence study, PET images were acquired in 4 consecutive, partly overlapping, bed positions covering the patient from the lower pelvis to the neck. Acquisition lasted 4 min per bed position and was started approximately 5 min after tracer injection.
Volumes of Interest (VOIs)
For the patients in the staging study, VOIs of primary prostate tumors and pelvic lymph node metastases were considered. The prostate tumor VOIs were defined as the 50% isocontour of the SUVmax in the corresponding histology-based VOIs, which were available from a previous study (19). The lymph nodes classified as malignant by a nuclear medicine physician were retrospectively identified on the PET images reconstructed with the 4-compartment attenuation map. VOIs were defined as the 50% isocontour of the SUVmax in a sphere encompassing the entire lymph node. The latter approach was also used to define the VOIs of recurrent prostate tumors, pelvic lymph nodes, paraaortic lymph nodes, and bone lesions in the recurrence study. In all cases, isocontouring was performed separately on the PET images reconstructed with the 4 and 5-compartment attenuation maps. In addition, spheric VOIs (8 mm radius) were placed in the third lumbar vertebra (L3) of the patients in the recurrence study to calculate lesion–to–bone marrow SUV ratios (SUVRs).
The SUVmax and mean 50% isocontour SUV (SUViso) were obtained for each of the lesion VOIs. For the patients in the recurrence study, the mean SUVs of the bone marrow VOI (SUVbm) were obtained and maximum and mean lesion–to–bone marrow SUVRs were calculated as SUVRmax = SUVmax/SUVbm and SUVRiso = SUViso/SUVbm, respectively. Bone marrow SUVs were not evaluated for the patients in the staging study because the software did not include the vertebral column in the 5-compartment attenuation maps of these single-bed-position, pelvic datasets. All SUVs and SUVRs were obtained separately from the PET images reconstructed with the 4 and 5-compartment attenuation maps. For each VOI, the relative change in SUV was calculated as ΔSUV = (5-compartment SUV/4-compartment SUV – 1) × 100%, and the relative change in SUVR as ΔSUVR = (5-compartment SUVR/4-compartment SUVR – 1) × 100%. In addition, each lesion’s distance to the nearest bone was calculated as the shortest Euclidean distance (mm) from the position of SUVmax on the PET image reconstructed with the 5-compartment attenuation map to the positions of the bone voxels on the 5-compartment attenuation map.
The 5-compartment attenuation maps were visually compared with the in-phase Dixon MR images, and bone registration errors near the lesion VOIs were reported. Since a substantial amount of bone registration errors were found near primary prostate tumors, we specifically evaluated the bias in ΔSUV in these regions; for each patient with bone registration errors near a primary tumor, 2 spheric VOIs of the same size were placed in prostate areas with and without misregistered bone, respectively. The SUVmean was obtained for both VOIs, and ΔSUVs were calculated as described above.
The initial VOIs (before isocontouring) were delineated using OsiriX (20) (primary tumor VOIs) or ITK-SNAP (21) (all other VOIs). Subsequent isocontouring, SUV analysis, and calculation of distance to the nearest bone was performed in MATLAB 9.2 (The MathWorks Inc.).
Statistical Analysis
For the lesions without bone registration errors, linear mixed-effects models were used to test if ΔSUV and ΔSUVR were different from zero and to assess if ΔSUV and ΔSUVR were associated with the lesion’s distance to the nearest bone. Furthermore, linear mixed-effects models were used to test if ΔSUV was different between lesions with and without bone registration errors. In all cases, patient number was used as a random effect on the intercept to account for multiple lesions per patient. The Wilcoxon signed-rank test was used to test if ΔSUV was different between prostate areas with and without misregistered bone. P values of less than 0.05 were considered significant. MATLAB 9.2 was used for statistical analysis.
RESULTS
The imaging data from 28 patients scanned between May 2014 and May 2015 as part of the staging study, and 81 patients scanned between September 2015 and September 2016 as part of the recurrence study, were retrospectively analyzed. Twelve patients from the staging study were excluded from further analysis because of missing PET raw data (n = 10), complete failure of bone inclusion in the 5-compartment attenuation map (n = 1), or artifacts due to a hip prosthesis (n = 1). Fifty-eight patients from the recurrence study were excluded from further analysis because there were no PET findings (n = 58). In the remaining 39 patients (n = 16 for staging study, n = 23 for recurrence study), a total of 62 lesions was evaluated (n = 28 for staging study, n = 34 for recurrence study). The median prostate-specific antigen values were 16.7 ng/mL (range, 3.7–56.9 ng/mL) and 1.7 ng/mL (range, 0.2–12.3 ng/mL) for the patients from the staging and recurrence study, respectively.
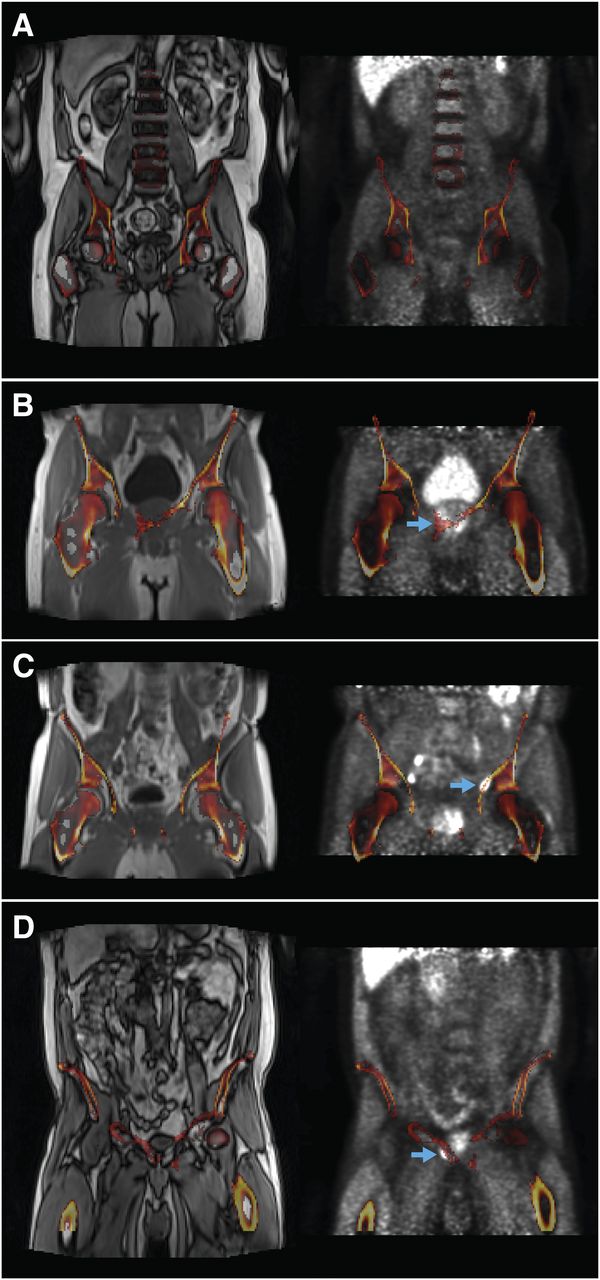
Bone registration errors were found near 14 (64%) of 22 primary tumors (staging study), 1 (17%) of 6 pelvic lymph node metastases (staging study), 1 (13%) of 8 locally recurrent tumors (recurrence study), 2 (10%) of 21 pelvic lymph node metastases (recurrence study), 0 (0%) of 4 paraaortic lymph node metastases (recurrence study), and 1 (100%) of 1 bone metastases (recurrence study). Example cases are provided in Figure 1. ΔSUVmax and ΔSUViso were not significantly different between lesions with and without bone registration errors, neither for primary tumors alone (P = 0.299 and 0.282, respectively) nor for all lesions combined (P = 0.125 and 0.241, respectively). The largest increase in SUV was found for the bone lesion (ΔSUVmax, 9.0%; ΔSUViso, 8.8%), despite suboptimal coregistration of the bone atlas (Fig. 1D). In patients with bone registration errors near primary tumors, ΔSUV was significantly higher in prostate regions with than without misregistered bone (P < 0.001). The median bias in prostate regions with bone registration errors was +9.6 (range, 4.4–20.2) percentage point.

Coronal in-phase Dixon MR images (left) and PET images reconstructed with 4-compartment attenuation map (right) overlaid with 5-compartment attenuation map (linear attenuation coefficient > 0.1 cm−1, i.e., bone only) for case without bone registration errors (A) and cases with bone registration errors near primary tumor (B), pelvic lymph node metastasis (C), and bone lesion (D), as indicated by arrows
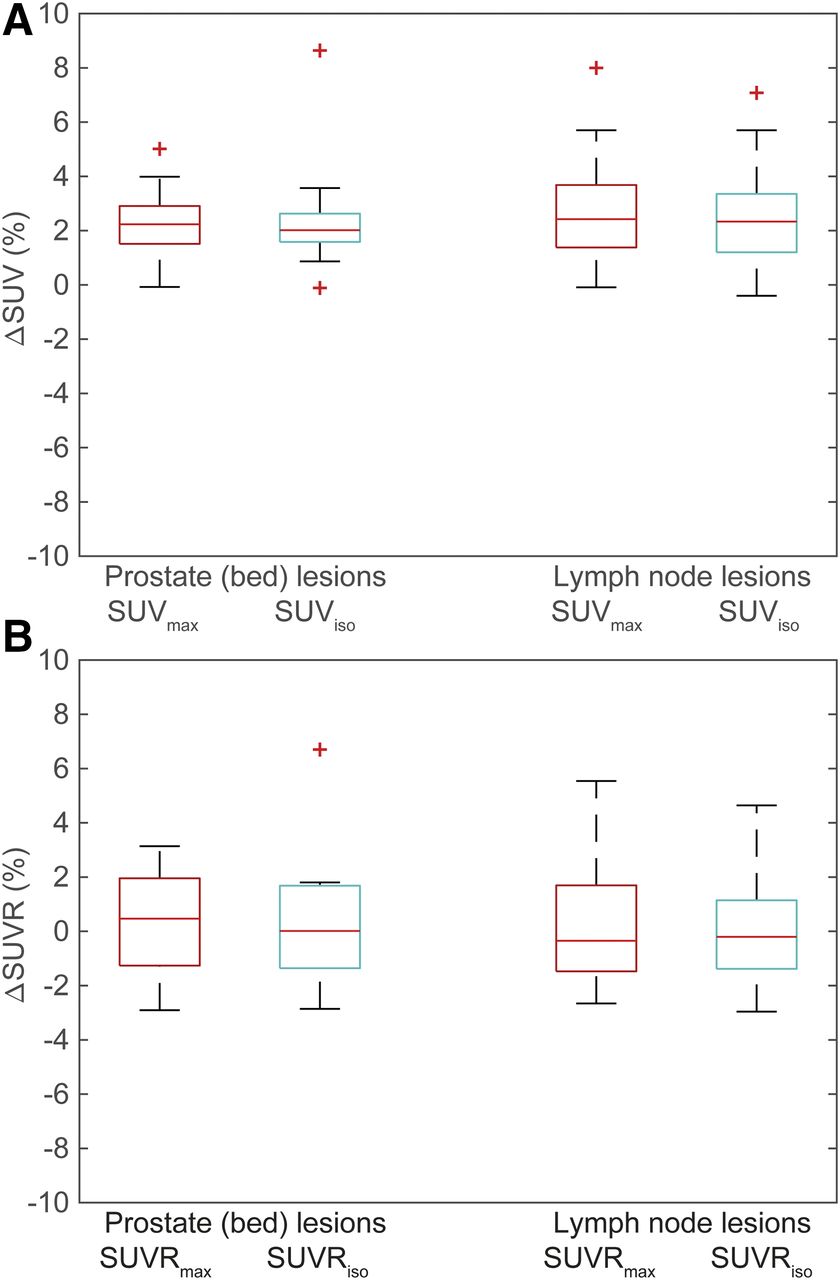
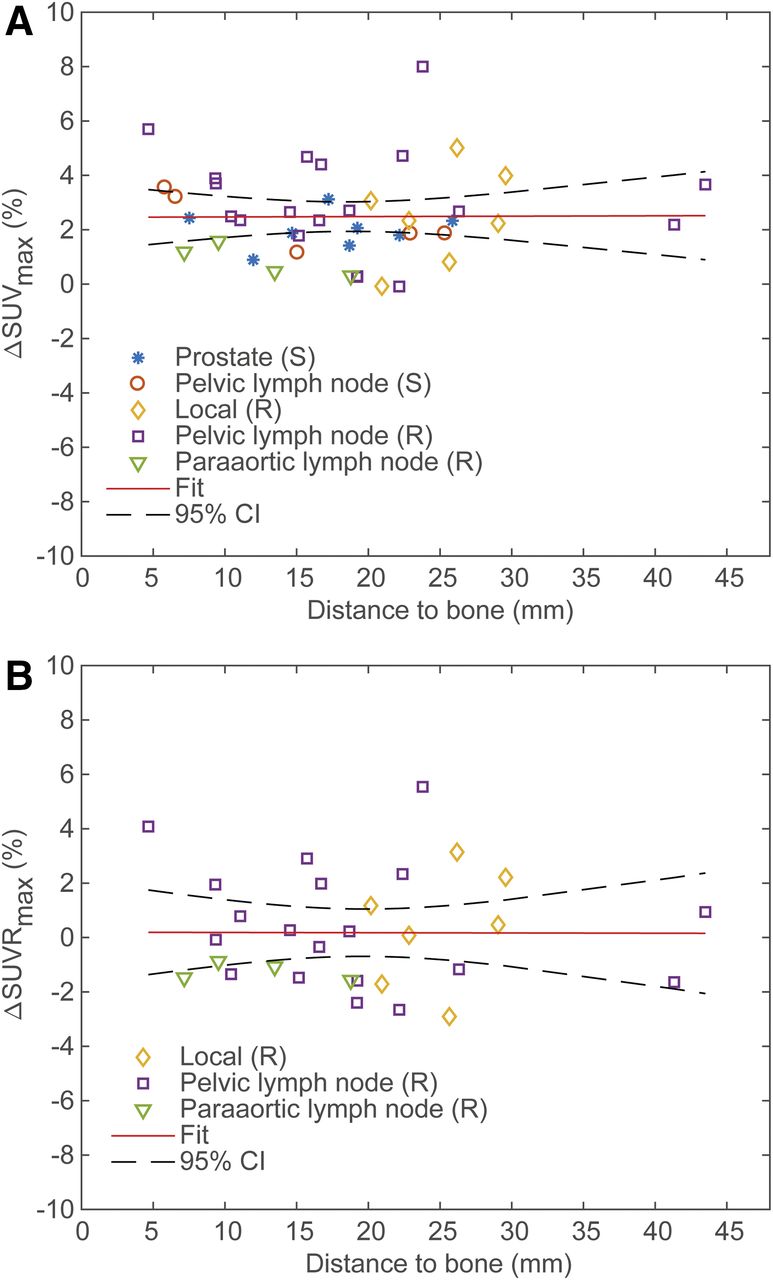
For the 43 lesions without artifacts, inclusion of bone in the attenuation map was associated with small but significant overall increases in SUVmax and SUViso (ΔSUVmax, 2.5%; 95% confidence interval [CI], 2.0%–3.0%; P < 0.001) (SUViso, 2.5%; 95% CI, 1.9%–3.0%; P < 0.001). Figure 2A shows that the effect was similar for the prostate (bed) lesions (n = 15; ΔSUVmax, 2.2%; 95% CI,1.6%–2.9%; P < 0.001) (ΔSUViso, 2.4%; 95% CI, 1.4%–3.3%; P < 0.001) and the lymph node lesions (n = 28; ΔSUVmax, 2.6%; 95% CI, 1.9%–3.3%; P < 0.001) (ΔSUViso,= 2.5%; 95% CI, 1.8%–3.2%; P < 0.001). Neither ΔSUVmax (P = 0.964) nor ΔSUViso (P = 0.620) was associated with the lesion’s distance to the nearest bone (Fig. 3A).

Box plots of relative difference in SUV (ΔSUV, A) and lesion–to–bone marrow SUVR (ΔSUVR, B) between PET images reconstructed with 4- and 5-compartment attenuation maps. Including bone in attenuation map was associated with significant increases in SUVmax and SUViso for both prostate (bed) and lymph node lesions. However, no significant changes were observed in SUVmax and SUViso.

Plot showing relative difference in SUVmax (ΔSUVmax, A) and maximum lesion–to–bone marrow SUVR (ΔSUVRmax, B) between PET images reconstructed with 4- and 5-compartment attenuation maps, plotted as function of distance to nearest bone. Linear mixed-effects model analysis revealed that there were no significant associations between ΔSUVmax or ΔSUVRmax and distance to bone, as also illustrated by horizontal lines of model fits. (S) = staging study; (R) = recurrence study.
The inclusion of bone in the attenuation map was not associated with significant changes in SUVRmax or SUVRiso when all lesions of the recurrence study were considered (ΔSUVRmax, 0.2%; 95% CI, −0.5%–0.9%; P = 0.604) (ΔSUVRiso, 0.2%; 95% CI, −0.6%–1.0%; P = 0.581). Again, the results were comparable between prostate (bed) lesions (ΔSUVRmax, 0.4%; 95% CI, −1.4%–2.1%; P = 0.676) (ΔSUVRiso, 0.8%; 95% CI, −1.8%–3.3%; P = 0.562) and lymph node lesions (ΔSUVRmax, 0.1%; 95% CI, −0.7%–1.0%; P = 0.737) (ΔSUVRiso, 0.1%; 95% CI, −0.7%–0.9%; P = 0.581) (Fig. 2B), and no significant associations were found between ΔSUVRmax (P = 0.982) or ΔSUVRiso (P = 0.797) and distance to bone (Fig. 3B).
DISCUSSION
Promising results from several studies with different radiopharmaceuticals indicate that PET/MRI has the potential to play an important role in staging of primary prostate cancer, for example (4,18,22,23), and detection of disease recurrence after initial treatment with curative intent, for example (24–27). However, in current clinical practice, the high linear attenuation coefficients of the bones in the pelvis and lower abdomen are assumed to be equal to those of soft tissue, which is incorrect. In this study, we applied a commercially available atlas-based method for including bone in the attenuation maps and evaluated its effect on the SUVs and SUVRs of primary and recurrent prostate cancer lesions. We found that including bone resulted in significant but small increases in the SUV of prostate (bed) and lymph node lesions, which were on the order of 2%–3%. These results agree well with previously reported observed and simulated bias values from ignoring bone attenuation (11,13–15). We did not observe an effect of including bone attenuation on lesion–to–bone marrow SUVRs, as the increases in SUV were similar for the lesion and bone marrow. Based on these results, and the bone registration errors discussed below, we deem the inclusion of bone in the PET/MRI attenuation maps not recommendable for the evaluation of soft-tissue prostate cancer lesions.
We found that bone registration errors may pose a problem in some patients, especially for prostate (bed) lesions when scanned in a single bed position. For the lesions analyzed in this study, the effect of including bone was not significantly different between lesions with and without bone registration errors. However, we did observe a significant bias in ΔSUV of approximately +10 percentage points when comparing prostate areas of the same patient with and without misregistered bone. These local inaccuracies could potentially misguide clinical decision making and need to be resolved before we would advise this method for routine clinical prostate cancer imaging. Recently, acceleration techniques have been proposed that enable acquisition of higher-resolution Dixon images in the same scan time (28). In a study with 51 patients who underwent whole-body 18F-FDG PET/MRI with high-resolution Dixon imaging, Oehmigen et al. did not observe any bone registration errors in the 5-compartment attenuation correction maps (15), which indicates that the higher level of anatomic detail in these images might lead to better results. High-resolution Dixon imaging was yet not available on our scanner when the data of this study were acquired; however, a direct comparison of pelvic bone registration errors in 5-compartment attenuation maps obtained from standard and high-resolution Dixon images is subject of future research.
A limitation of this study is that only one bone lesion was present in the evaluated patient cohort. Moreover, the lesion-containing bone was not correctly registered when included in the 5-compartment attenuation map, which hampered proper comparison of SUVs between attenuation methods. Nevertheless, the relatively large increase in SUV observed for the bone lesion points toward a substantial effect of the attenuation correction method for this lesion type. Similar differences in bone lesion SUV between PET images reconstructed with the 4- and 5-compartment attenuation maps were found by others (14,15). Consequently, it would be recommendable to perform an additional reconstruction with a 5-compartment attenuation map when bone lesions are suspected based on the PET images reconstructed with the 4-compartment attenuation map.
Another limitation of this study is the lack of CT-based attenuation correction maps as a gold standard. Both the staging study and the recurrence study were PET/MRI only, so CT-derived attenuation maps of the same patients were not available for comparison. However, direct comparison between MRI and CT-derived attenuation correction is also challenging, as it is virtually impossible to keep the patient in the exact same position when scanned in a different scanner at a different time point. Our results are valuable because they show that atlas-based inclusion of bone in the attenuation maps is not likely to affect the clinical evaluation of soft-tissue lesions on 18F-fluciclovine PET/MR images of primary and recurrent prostate cancer, despite the high bone density of the pelvis. These results are in accordance with Oehmigen et al., who show that truncation of the arms is a larger source of SUV bias in the pelvis than ignoring bone (15). Whether our results are also valid for prostate cancer imaging with other PET radiopharmaceuticals, including prostate specific membrane antigen and choline-based tracers, remains to be seen and will be part of future research. In all cases, the atlas-based method may be important for the quantification of uptake in bone lesions, but the attenuation maps should always be checked for bone registration errors.
CONCLUSION
The investigated method for atlas-based inclusion of bone in Dixon-based attenuation correction of 18F-fluciclovine PET/MRI has only a small effect on the SUVs of soft-tissue prostate cancer lesions, and no effect on their lesion–to–bone marrow SUVRs when using signal from L3 as a reference. The attenuation maps should always be checked for bone registration errors when evaluating lesions in or close to the bones.
DISCLOSURE
This study was funded by The Norwegian Cancer Society and the Movember Foundation (grants 100792 and 102050). No other potential conflict of interest relevant to this article was reported.
Footnotes
Published online May 4, 2018.
- © 2018 by the Society of Nuclear Medicine and Molecular Imaging.
REFERENCES
- Received for publication January 26, 2018.
- Accepted for publication April 24, 2018.


Jump to section
Related Articles
Cited By...
- No citing articles found.