


Abstract
The response evaluation criteria in patients with Hodgkin lymphoma (HL) were designed for the assessment of chemotherapy and targeted molecular agents. We investigated the accuracy of 3-mo 18F-FDG PET/CT for the identification of HL patients responding to immune-checkpoint blockade by anti–programmed death 1 antibodies (anti-PD1). We also reported the frequency of new immune patterns of response and progression. Methods: Retrospectively, we recruited consecutive HL patients treated by anti-PD1 (pembrolizumab or nivolumab) at Gustave Roussy from 2013 to 2015. 18F-FDG PET/CT and contrast-enhanced CT scans were acquired every 3 mo. We recorded the best overall response according to the International Harmonization Project Cheson 2014 criteria and LYmphoma Response to Immunomodulatory therapy Criteria (LYRIC) (2016 revised criteria). Patients achieving an objective response at any time during the anti-PD1 treatment were classified as responders. Results: Sixteen relapsed or refractory classic HL patients were included. The median age was 39 y (age range, 19–69 y). The median previous lines of therapy was 6 (range, 3–13). The mean follow-up was 22.6 mo. Nine of 16 patients (56%) achieved an objective response. Two deaths occurred due to progressive disease at 7 mo. 18F-FDG PET/CT detected all responders at 3 mo and reclassified best overall response in 5 patients compared with CT alone. A decrease in tumor metabolism and volume (SUVmean, metabolic tumor volume) and increase in healthy splenic metabolism at 3 mo were observed in responders (area under the curve > 0.85, P < 0.04). Five of 16 patients (31%) displayed new imaging patterns related to anti-PD1; we observed 2 transient progressions consistent with indeterminate response according to the LYRIC (2016) (IR2b at 14 mo and IR3 at 18 mo) and 3 patients with new lesions associated with immune-related adverse events. Conclusion: Three-month 18F-FDG PET/CT scans detected HL patients responding to anti-PD1. New patterns were encountered in 31% of patients, emphasizing the need for further evaluation in larger series and close collaboration between imaging and oncology specialists on a per-patient basis.
Hodgkin Reed-Sternberg cells escape immune surveillance through a genetic alteration in chromosome 9p24.1, leading to an overexpression of the programmed death 1 (PD1) ligands (1). Pembrolizumab and nivolumab are PD1 blockade antibodies (anti-PD1) that restore immunity against Hodgkin Reed-Sternberg cells. Anti-PD1 has recently demonstrated high (64%–87%) response rates in relapsed or refractory Hodgkin lymphoma (HL) (2,3).
Hodgkin lesions constitute a unique microenvironment, with a minority of Hodgkin Reed-Sternberg cells (often <1%) that interact with numerous microenvironment cells (4–6). The high avidity of Hodgkin lesions for glucose analog translates into a high 18F-FDG uptake visible on PET (7). The Warburg effect (8) leads to an important increase in glucose consumption in proliferative tissue or tumor (as compared with differentiated tissue) due to an increase in anaerobic glycolysis. Theoretically, anti-PD1 could lead to an activation of antitumor microenvironment immune cells, translating into increased glucose metabolic consumption by an upregulation of Glut messenger RNA (to provide cellular energy), and upregulation of Glut proteins (to compete for hexoses uptake) (9,10), leading to increased 18F-FDG uptake (11). This could mask anti-PD1 treatment efficacy on 18F-FDG PET in HL.
Anti-PD1 induces new patterns of progression and possibly new response paradigms that can alter decision making in patients’ management and ultimately patient outcomes. Indeed, 5%–10% of patients with solid tumors (12) experience pseudoprogression, usually early during treatment, with imaging findings suggestive of progressive disease but followed by later imaging response (12–17). In 2016, the LYmphoma Response to Immunomodulatory therapy Criteria (LYRIC) introduced the term indeterminate response (IR)—instead of progression—as the time interval until a biopsy or subsequent imaging confirmed either a pseudoprogression or a true progression (18), restraining clinicians to a wait-and-see strategy. Additionally, new immune patterns were described such as abscopal effect (i.e., a tumor’s antigens released by radiotherapy lead to the regression of metastatic cancer size and metabolism at a distance from the irradiated site due to the enhancement of the diversity of the T-cell receptor) (19) and hyperprogression (i.e., anti-PD1 initiation leads to a paradoxal increase in tumor growth rate) (20).
The reference standards for the monitoring of HL are CT scanning and 18F-FDG PET (18,21,22). Interim 18F-FDG PET is indeed crucial for assessing the response to adriamycin, bleomycin, vinblastine, and dacarbazine (23) as well as bleomycin, etoposide, adriamycin, cyclophosphamide, oncovin, procarbazine, and prednisone regimen (24). The current response criteria were, however, designed for chemotherapies and drugs targeting the cancer cells. Therefore, a treatment response is defined by a tumor shrinkage (IWG-Cheson) (22) or a decrease of tumor glycolytic metabolism (Lugano classification) (21) within Hodgkin lesions. Imaging-based response evaluation criteria should now integrate the paradigm shift introduced by anti-PD1, which aims the activation of the antitumor immune system. We investigated, in a pilot patient-based and lesion-based imaging study, the metabolic pattern of response in HL treated with anti-PD1.
MATERIALS AND METHODS
Patient Selection
Patient selection and treatment are presented in Table 1. In a single-center study, 16 adult HL patients treated with anti-PD1 were retrospectively selected, 15 treated by pembrolizumab intravenously in clinical trials (NCT01953692, NCT02453594) and 1 treated by nivolumab intravenously in a compassionate program. Patients were treated for HL relapsing or refractory to salvage chemotherapy including brentuximab vedotin and autologous stem cell transplantation at Gustave Roussy, from December 2013 to December 2015. All patients underwent 18F-FDG PET and contrast-enhanced CT evaluations at baseline and every 3 mo until progression or cessation of treatment for up to 2 y. The protocols (NCT01953692 and NCT02453594) were approved by ethics committee, and all subjects signed a written informed consent form.
Patients' Characteristics (n = 16)
18F-FDG PET and CT Scan Acquisitions
18F-FDG PET/CT images were acquired and reconstructed according to guidelines (25) using a Discovery 690 (GE Healthcare) with an activity of 3–4 MBq/kg of 18F-FDG, a 2-min-per-bed acquisition time, and a 90-min delay after 18F-FDG injection. Whole-body CT scans were acquired using a 64 HiSpeed spiral scanner (GE Healthcare) after administration of intravenous contrast agent.
Response Evaluation Criteria
A central consensus review of all imaging data was performed. The change in the sum of the product of the perpendicular diameters of target lesions (ΔSPD-Cheson) on contrast-enhanced CT scans was measured using Cheson 2014 criteria (18,21,22). The evolution of nontarget lesions and new lesions was recorded. The 18F-FDG PET scan was scored according to the 5-point scale scoring system (PET-5PS) (18,21,22): no uptake; uptake < mediastinum; uptake > mediastinum but < liver; uptake moderately more than liver uptake, at any site; and markedly increased uptake at any site or new sites of disease.
Monitoring of Imaging Studies
The changes in CT and PET biomarkers across the anti-PD1 treatment sequence was measured (Table 2) to compute their predictive value (Table 3): skeletal muscle index on CT scans (marker of sarcopenia, predictor of outcome (26)); metabolic tumor volume (MTV) and total lesion glycolysis (TLG) measured inside the whole tumor volume defined by Lugano criteria (18,21,22) using the Nestle approach for the segmentation (27); SUVmax and SUVmean measured inside the whole tumor volume previously segmented; and glucose consumption of healthy lymphoid tissue (spleen, thymus, ileocaecal valve, and healthy osteomedullary bone) (our driving hypothesis was that the activation of antitumor immunity by anti-PD1 could translate into increased glucose consumption outside the Hodgkin tumor lesions).
18F-FDG PET and CT Response at 3 Months Predict BOR
Biologic Response at 3 Months Does Not Predict BOR
Monitoring of Nonimaging Biomarkers
The variation in full blood count parameters across the treatment sequence was measured (Table 4).
18F-FDG PET and CT Response at 3 Months Predict BOR
Pattern of Response and Progression
Best overall response (BOR) was defined per Cheson 2014 criteria (2) and took into consideration the 2016 LYRIC classification concept of IR (18) (Table 5). Patients having achieved an objective partial or complete response at any time during the treatment were defined as responders. Patients having achieved stability or progression as BOR at any time were classified as refractory. The reference standard was the multidisciplinary experts’ consensus based on clinical and imaging results and if feasible on biopsy and histology when an 18F-FDG–positive lesion was persistent (18,21,22).
Comparison of Lugano Criteria and LYRIC
Identification of Responders to Anti-PD1 at 3 Months
For all patients, we measured the change in response evaluation criteria, imaging biomarkers, and full blood count parameters between baseline and 3 mo (Tables 2 and 3). We evaluated whether 3-mo changes in biomarkers allowed for the identification of patients responding to anti-PD1 (Tables 2 and 3).
Lesion-Based Analysis
In a subset of 290 Hodgkin lesions identified at baseline, we monitored the glucose consumption at 3, 6, and 9 mo and calculated the positive and negative predictive value (PPV and NPV) of the PET-5PS (Table 6).
PET 5-Point Scale Classification Has Good Predictive Value for Lesion Outcome
Statistical Methods
Descriptive statistics were performed using conventional metrics (mean, median, range). Nonparametric tests were used for comparison or correlation. Wilcoxon tests compared the mean value of the 2 populations. The area under the receiver-operating-characteristic curve (AUC) evaluated the accuracy of imaging features for the detection of refractory patients. Statistical analyses were performed using SPSS software (version 23.0; IBM).
RESULTS
Patients' Characteristics
Patients’ Characteristics (Table 1)
The anti-PD1 median period between lymphoma diagnosis and initiating anti-PD1 treatment was 4.4 y (range, 0.6–14.8). Patients had a median of 6 (range, 3–13) previous therapeutic lines. Sixteen patients received previous chemotherapy, and 8 patients received autologous stem cell transplantation.
Treatment
Nine of 16 patients achieved an objective response. Thirteen patients stopped treatment after a mean duration of 15.3 mo at the cutoff date of analysis. The mean follow-up was 22.6 mo. The estimated (95% confidence interval) overall survival in the overall population was 34.7 mo (29.6–39.7 mo) according to Kaplan–Meier analysis. None of the patients with a negative 18F-FDG PET result died. Two patients died because of progressive disease at 7 mo (patients 7 and 9).
Change in Anthropomorphic Characteristics
At 3 mo, there was no significant difference between responders and refractory patients. At 6 mo and beyond, stability or improvement of the skeletal muscle index was observed in 10 of 16 patients, mostly in the responders (Figs. 1⇓–3).

Patterns of response on CT scanning and 18F-FDG PET; evolution of patients after initiation of anti-PD1. Number identifies each patient. Dotted lines distinguish 2 patients who died from progression. Color indicates BOR according to Cheson 2014 criteria (blue = complete response [CR], green = partial response [PR], orange = stable disease [SD], red = progressive disease [PD]).
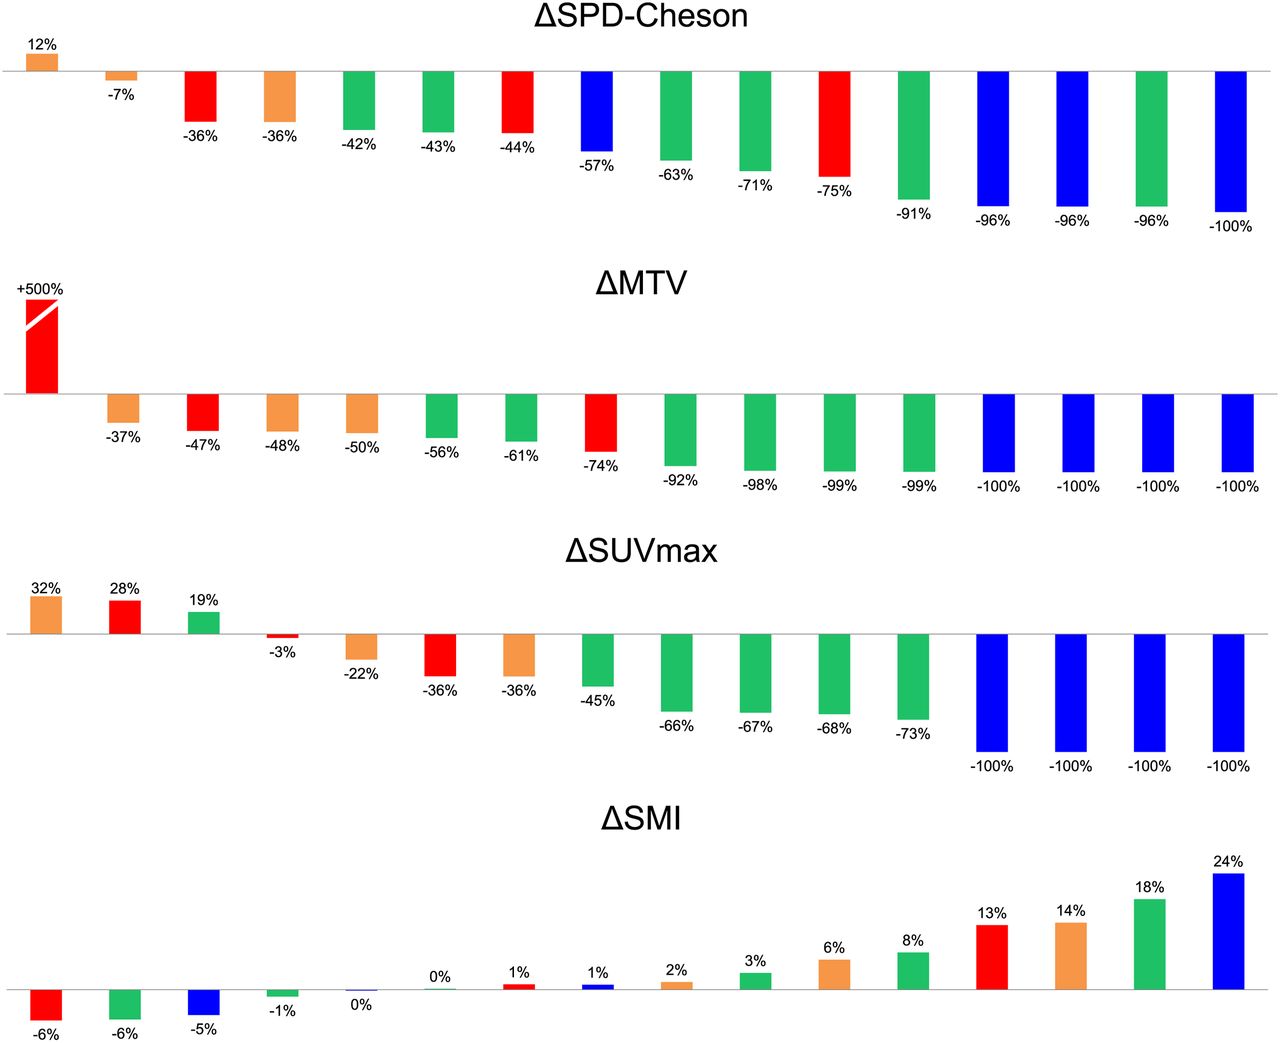
Best 6-mo variation in imaging biomarkers. Color code refers to BOR according to Cheson 2014 criteria (blue = complete response [CR], green = partial response [PR], orange = stable disease [SD], red = progressive disease [PD]). SMI = skeletal muscle index.

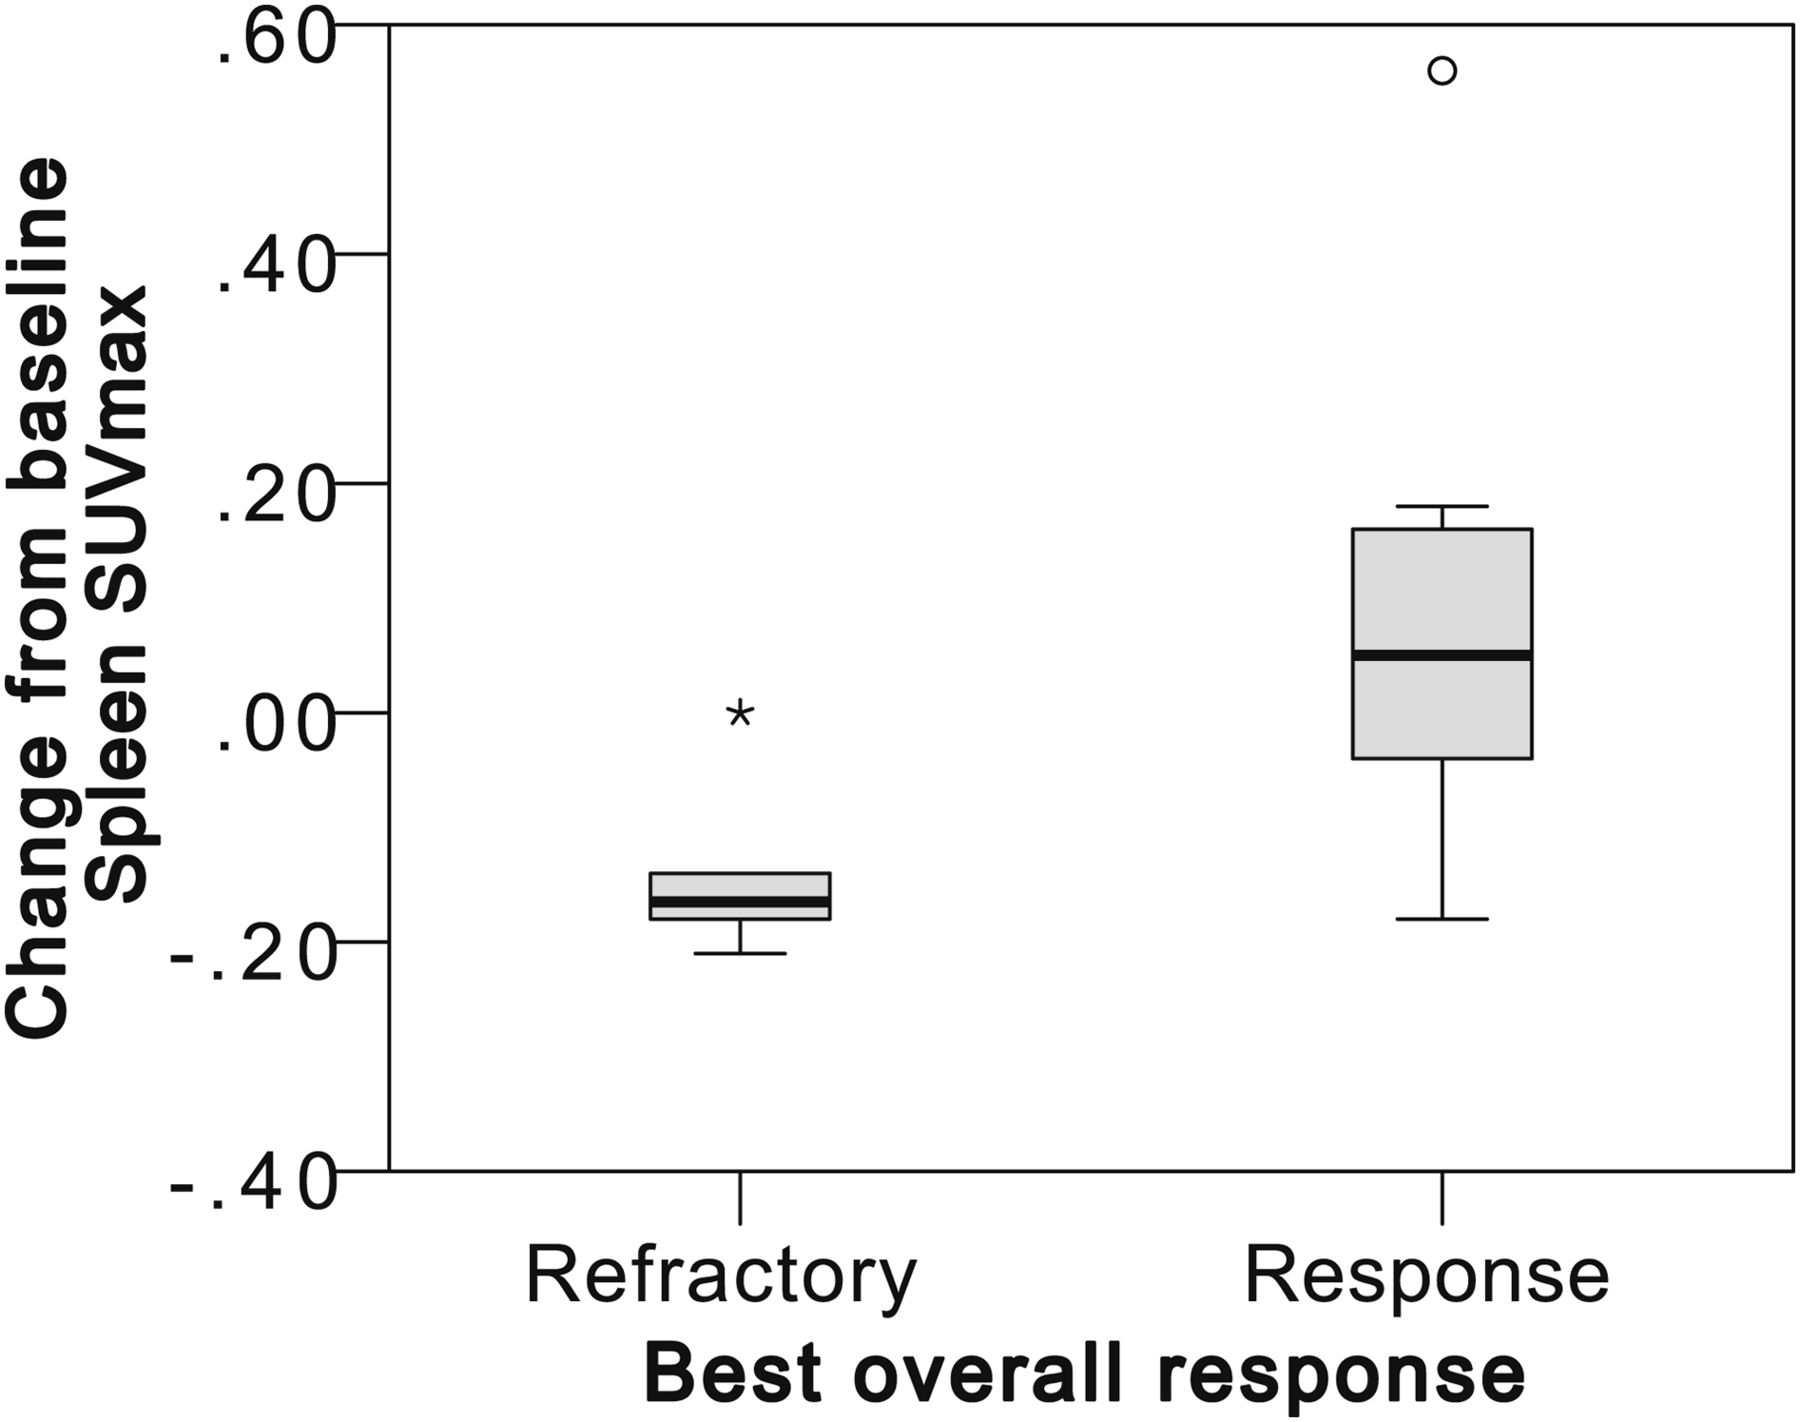
Responders have an increase in spleen metabolism (ΔSUVspleen) at 3 mo.
Patterns of Response and Progression in Patients
BOR
The BOR with Cheson 2014 criteria combining 18F-FDG PET/CT and contrast-enhanced CT scans was complete response (4 patients), partial response (6 patients), stable disease (3 patients), and progressive disease (3 patients). Compared with CT scanning alone, 18F-FDG PET reclassified 5 patients: 1 stable disease as progressive disease, 1 complete response as partial response, and 3 partial response as complete response. The range of BOR within 6 mo after treatment initiation was widely different among patients (Figs. 1–3).
Depth of Response Over Time
All patients who achieved objective response did it at the first 3-mo assessment. Figure 1 shows that the depth of the response in most patients slightly increased between 3 and 6 mo and even for patients 1, 4, 5, and 6 lasted for more than 1 y.
IRs by LYRIC
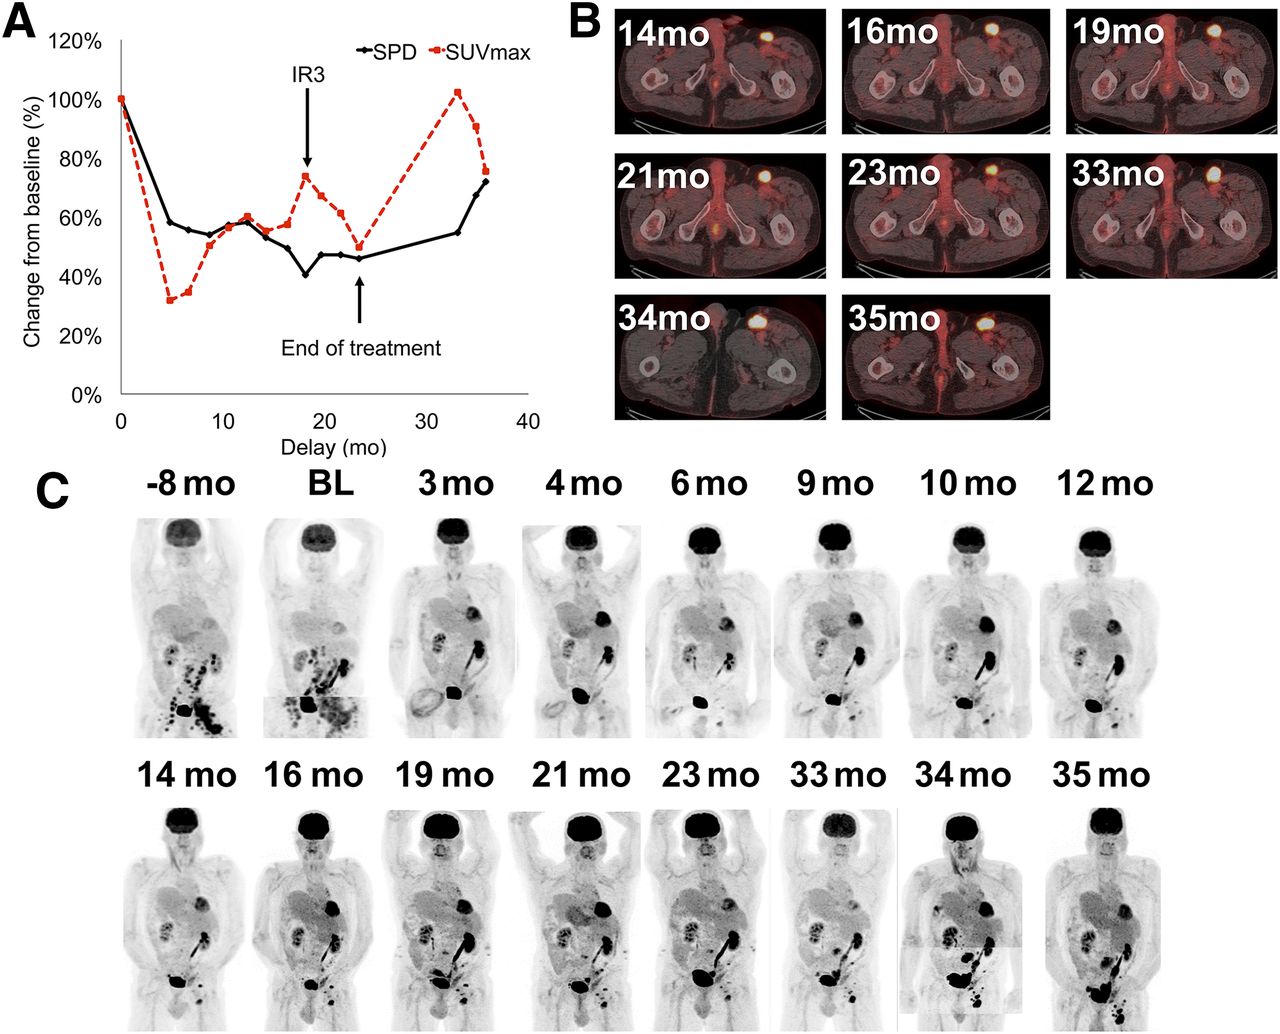
Seven patients were indeterminate, 5 proved to be true progressions and 2 transient progressions. Patient 16 had IR1 (≥50% increase in SPD in first 12 wk) and IR2 (<50% increase in SPD with new lesions or progression of a lesion) profiles: new lesion and increase in tumor burden at 3 mo without clinical deterioration that were subsequently confirmed as tumor lesions. Six of sixteen patients analyzed during the first 6 mo were qualified as IR2a (a new lesion at any time). In these 6 patients, 46 new tumors sites were detected (lesion sites: 30 lymph node, 7 lung, 6 spleen, 2 bone, and 1 multifocal bone involvement). All these new lesions persisted and were considered as progressive lesions. Patient 4 experienced an IR2b between 14 and 16 mo (Fig. 4): transient progression in tumor size and 18F-FDG uptake. In patient 1 (Fig. 5), a transient progression of SUVmax is detailed; the lesion qualified as IR3 but ultimately progressed morphologically and metabolically at 36 mo after the discontinuation of anti-PD1.
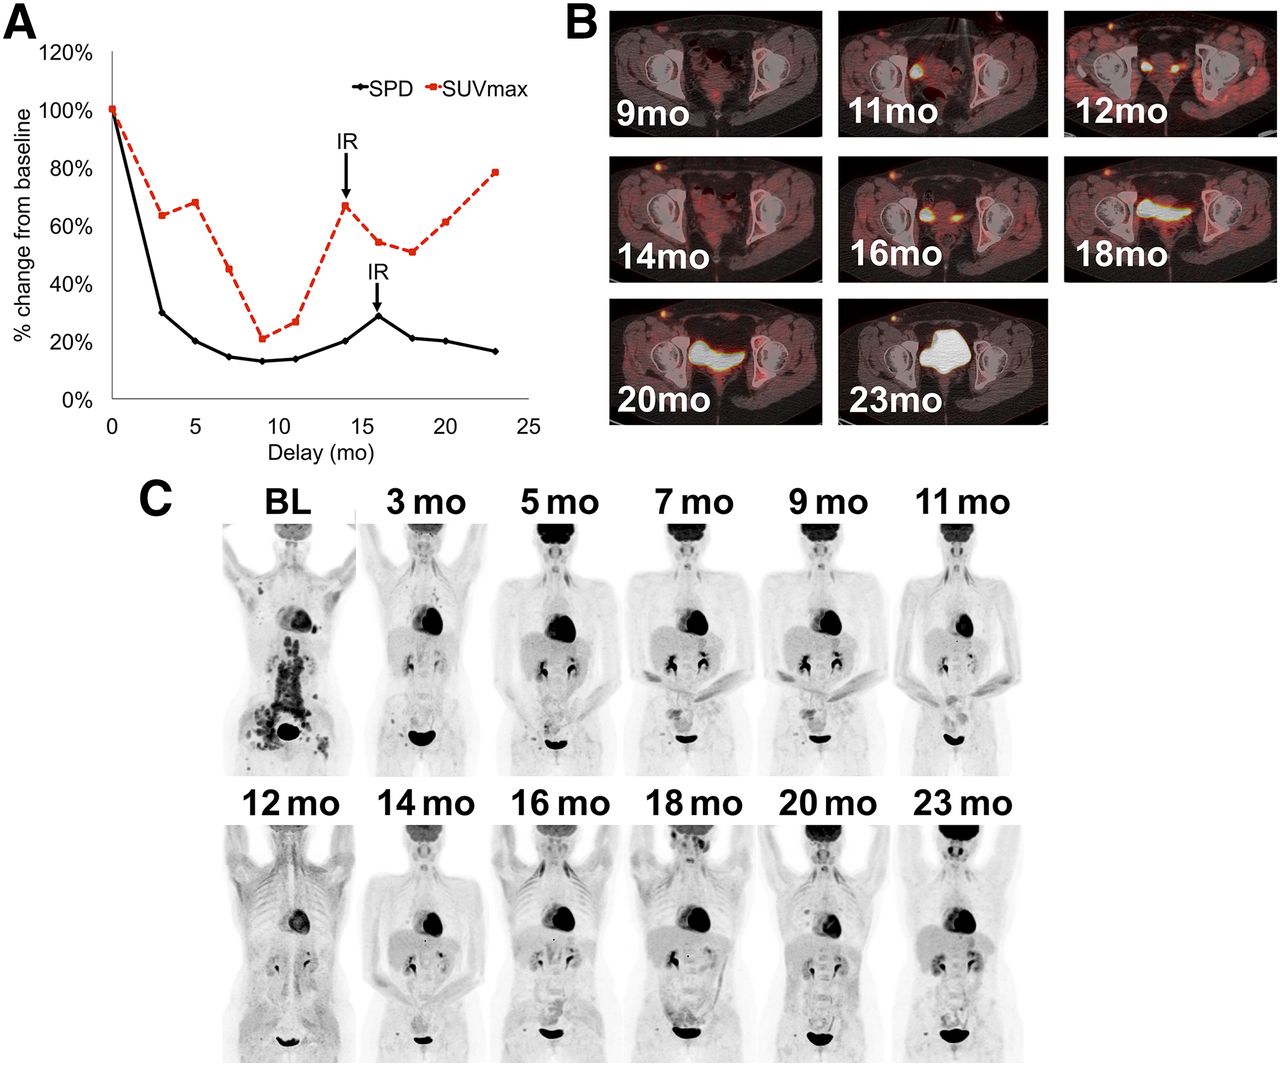
IR type 2: transient size progression. (A) Evolution of SPD and SUVmax after treatment initiation expressed as percentage. (B) Evolution of right inguinal lesion. (C) Evolution of patient.

IR type 3: transient SUVmax progression. (A) Evolution of SPD and SUVmax after treatment initiation expressed as percentage. Evolution of left inguinal lesion (B) and of patient (C).
New Nontumor Lesions
Six patients had new 18F-FDG–positive lesions during anti-PD1 treatment (Fig. 6) that were not tumor lesions. 18F-FDG PET detected concurrent pulmonary infection and zona activation in patients 5 and 14. 18F-FDG PET detected immune-related adverse events (IRAEs) in patients 3, 6, 9, and 16: 1 confirmed colitis, 2 interstitial pneumonitis (1 confirmed as IRAE), and 1 confirmed pancreatitis.

New non-Hodgkin lesions appeared during anti-PD1 treatment. 18F-FDG PET/CT detected grade 2 colitis (A), pancreatitis (B), and zona activation in right axilla (C, from left to right: maximum-intensity-projection baseline, maximum-intensity-projection and fused PET/CT image during follow-up).
Hyperprogression
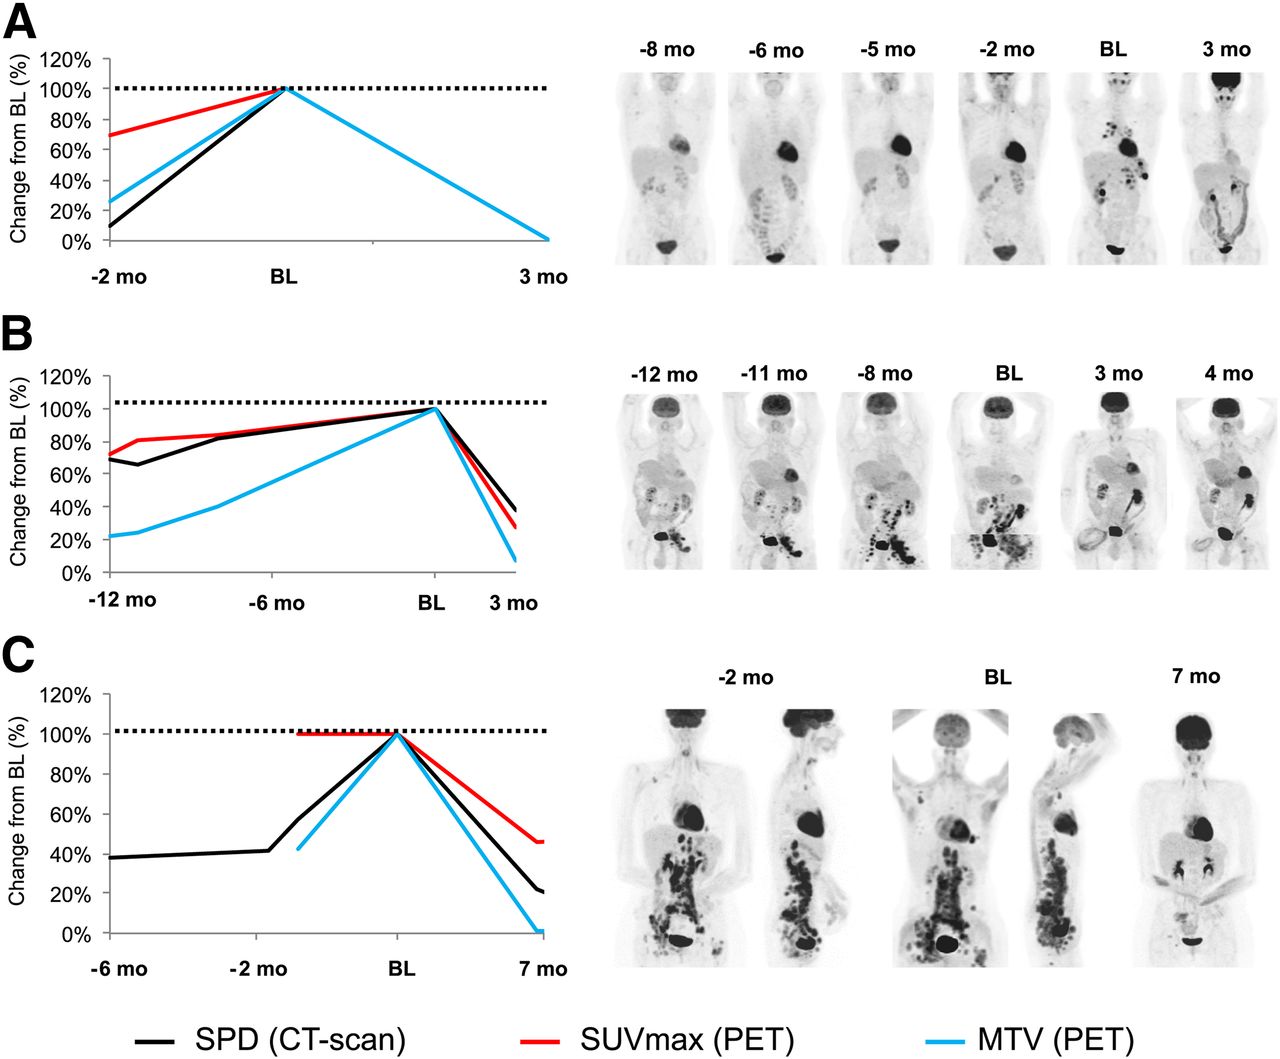
There was no case of hyperprogression. The tumor growth rate decreased in all patients after anti-PD1 initiation (e.g., Fig. 7).

No hyperprogression was observed after anti-PD1 initiation. Tumor growth rate decreased in all patients (e.g., A–C). Value of SPD, SUVmax, and MTV is set up at 100% at baseline to evaluate their variation before and after treatment initiation.
3-Month Prediction of BOR
We evaluated whether early changes in CT scans, PET scans, and blood biologic biomarkers measured at baseline and 3 mo predicted BOR and thus identified responders to anti-PD1. The most accurate biomarker was ΔMTV according to receiver-operating-characteristic analysis (Tables 2 and 3).
Change in Tumor Burden
The mean shrinkage of target tumor lesions at 3 mo was significantly greater in responders (Table 2) as demonstrated by ΔSPD-Cheson, ΔMTV, and ΔTLG (P < 0.03). The AUC of those biomarkers was above 0.95 (P < 0.008) (Table 3). No refractory patients achieved MTV shrinkage greater than 50% at 3 mo (sensitivity: 71%, specificity: 100%).
PET-5PS
PET-5PS was not significantly different between refractory and responding patients, as demonstrated by the comparison of the mean value (P = 0.13, Table 2) and the AUC (P = 0.13, Table 3).
Change in Tumor Glucose Consumption
Responders had significantly greater decrease in SUVmean and SUVmax, for which the AUC was above 0.87 (P < 0.03) (Tables 2 and 3). A 3-mo decrease in SUVmax (Δ < −50%) was observed exclusively in responders.
Change in Healthy Lymphoid Tissue SUVmax
The variation of glucose consumption within healthy lymphoid tissues was not measurable in some patients because of splenectomy (patient 12), thymus infiltration (patient 13), and osteomedullary infiltration (patient 11). A significant increase in spleen glucose consumption—ΔSUVmax—was observed in responders (Tables 2 and 3). Variation in glucose consumption within spleen, thymus, and bone medulla were not statistically significant (P > 0.21) predictors of outcome.
Change in Full Blood Count Parameters
No change in full blood count parameters was significantly associated with immune response (Table 4).
Lesion-Based Analysis
PPV and NPV
Table 6 shows the excellent accuracy of the PET-5PS classification for the prediction of the outcome of a Hodgkin lesion at 3, 6, and 9 mo. The PPV and the NPV were, respectively, above 88% and 97% with no pseudoprogression phenomenon observed.
Correlation Between 18F-FDG Uptake and Biopsies
Good correlation was shown between persistent 18F-FDG uptake and persistent tumor Hodgkin Reed-Sternberg cells in 3 biopsies performed in 3 different patients at 24.7 (patient 2), 23.1 (patient 4), and 9.6 mo (patient 12).
DISCUSSION
To the best of our knowledge, this is the first study of new metabolic patterns of response in HL patients treated with anti-PD1 at a patient and lesion level. 18F-FDG PET allowed for refinement of BOR classification in one third of patients as compared with CT scanning only, demonstrating the potential added value of 18F-FDG PET for response assessment.
The evaluation of anti-PD1 treatment effect by 18F-FDG PET at 3 mo is clinically relevant, as it clearly identifies responders. Indeed, all responders have reached the response by 3 mo. Future studies might evaluate the predictive value of earlier evaluation.
On a 18F-FDG PET interpretation perspective, we showed that the PET-5PS has an excellent positive and predictive value at a lesion level although it might be outperformed by quantitative PET metrics on a patient-based analysis (2). Indeed, the persistence of 18F-FDG PET–positive lesions at 3 mo does not preclude a prolonged clinical benefit. Our pilot study described the significant shrinkage in tumor volume (ΔSPD-Cheson, ΔMTV, ΔTLG), decrease in tumor glucose metabolism (ΔSUVmean, ΔSUVmax), and increase in spleen metabolism observed in responders (n = 9), which may be useful for the calibration of decision support classification threshold. Additionally, we showed that the interpretation of SUVmax needs to be made carefully because transient progression of SUVmax can be observed in lesions (Figs. 4 and 5), and the association between SUVmax variation and treatment response is not obvious. Interestingly, healthy spleen tissue 18F-FDG uptake appears significantly increased in responders, suggesting a favorable immunologic reconstitution. Further prospective and largest studies are required to validate these biomarkers.
Most patients have achieved a good partial and prolonged response, whereas only a few patients were in a complete response. We have confirmed, through histologic restaging, that residual 18F-FDG–positive lesions remained of lymphomatous origin. As described by Armand et al. (2) and the redefined LYRIC 2016 classification (18), we observed in the present series 13% of IRs. Importantly, we did not find any early pseudoprogression as defined at 3 mo, as all the new lesions observed at that time had proved to be real progressions. The IRs observed in our series were delayed. These IRs occurred beyond the first year of treatment, with transient fluctuations in tumor size or glucose uptake of residual Hodgkin lesions. In a daily management point of view, the IRs are important to be considered if the patient is clinically doing well, encouraging physicians to not prematurely withdraw the patient from anti-PD1 treatment. Otherwise, 18F-FDG PET had detected nontumor lesions in 37% of patients, mainly related to immune side effects. In contrast to solid tumors studies, we have not encountered hyperprogression profiles (20) in this pilot series.
CONCLUSION
These data demonstrate that the 18F-FDG PET evaluation of anti-PD1 treatment is different from classic chemotherapy. Patients may remain in prolonged partial responses, while continuing to likely benefit from anti-PD1 treatment. New imaging patterns related to anti-PD1 were encountered in 31% of patients. 18F-FDG PET may also reveal IRs mainly during the second year of treatment, as well as nontumor lesions mainly due to immune-related adverse events.
DISCLOSURE
Laurent Dercle’s work is funded by a grant from the Philanthropia Fundation, Geneva, Switzerland. No other potential conflict of interest relevant to this article was reported.
Footnotes
Published online Jun. 8, 2017.
- © 2018 by the Society of Nuclear Medicine and Molecular Imaging.
REFERENCES
- Received for publication April 13, 2017.
- Accepted for publication May 26, 2017.


Jump to section
Related Articles
Cited By...
- Potential Theranostic Role of Bone Marrow Glucose Metabolism on Baseline 18F-FDG PET/CT in Metastatic Melanoma
- Intratumoral Immunotherapy: From Trial Design to Clinical Practice
- Early Response to First-Line Anti-PD-1 Treatment in Hodgkin Lymphoma: A PET-Based Analysis from the Prospective, Randomized Phase II NIVAHL Trial
- Diagnosis of Hyperprogressive Disease in Patients Treated with Checkpoint Inhibitors Using 18F-FDG PET/CT
- Is there a link between very early changes of primary and secondary lymphoid organs in 18F-FDG-PET/MRI and treatment response to checkpoint inhibitor therapy?
- Imaging the Cancer Immune Environment and Its Response to Pharmacologic Intervention, Part 1: The Role of 18F-FDG PET/CT
- Early 18F-FDG PET/CT Response Predicts Survival in Relapsed or Refractory Hodgkin Lymphoma Treated with Nivolumab