


Article Figures & Data
Figures
- FIGURE 1.
Patterns of response on CT scanning and 18F-FDG PET; evolution of patients after initiation of anti-PD1. Number identifies each patient. Dotted lines distinguish 2 patients who died from progression. Color indicates BOR according to Cheson 2014 criteria (blue = complete response [CR], green = partial response [PR], orange = stable disease [SD], red = progressive disease [PD]).
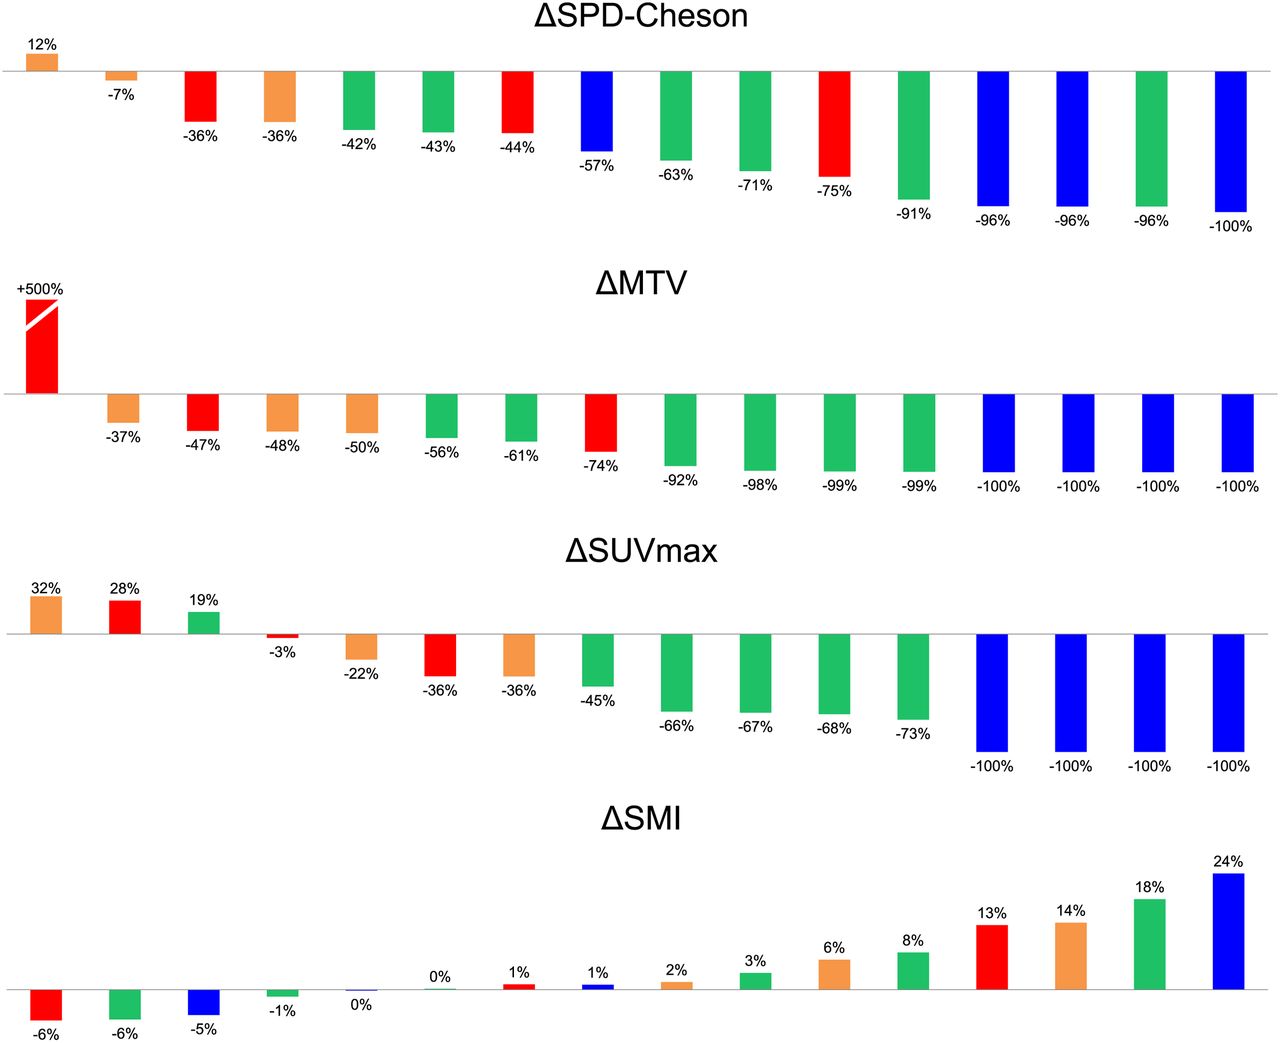
- FIGURE 2.
Best 6-mo variation in imaging biomarkers. Color code refers to BOR according to Cheson 2014 criteria (blue = complete response [CR], green = partial response [PR], orange = stable disease [SD], red = progressive disease [PD]). SMI = skeletal muscle index.
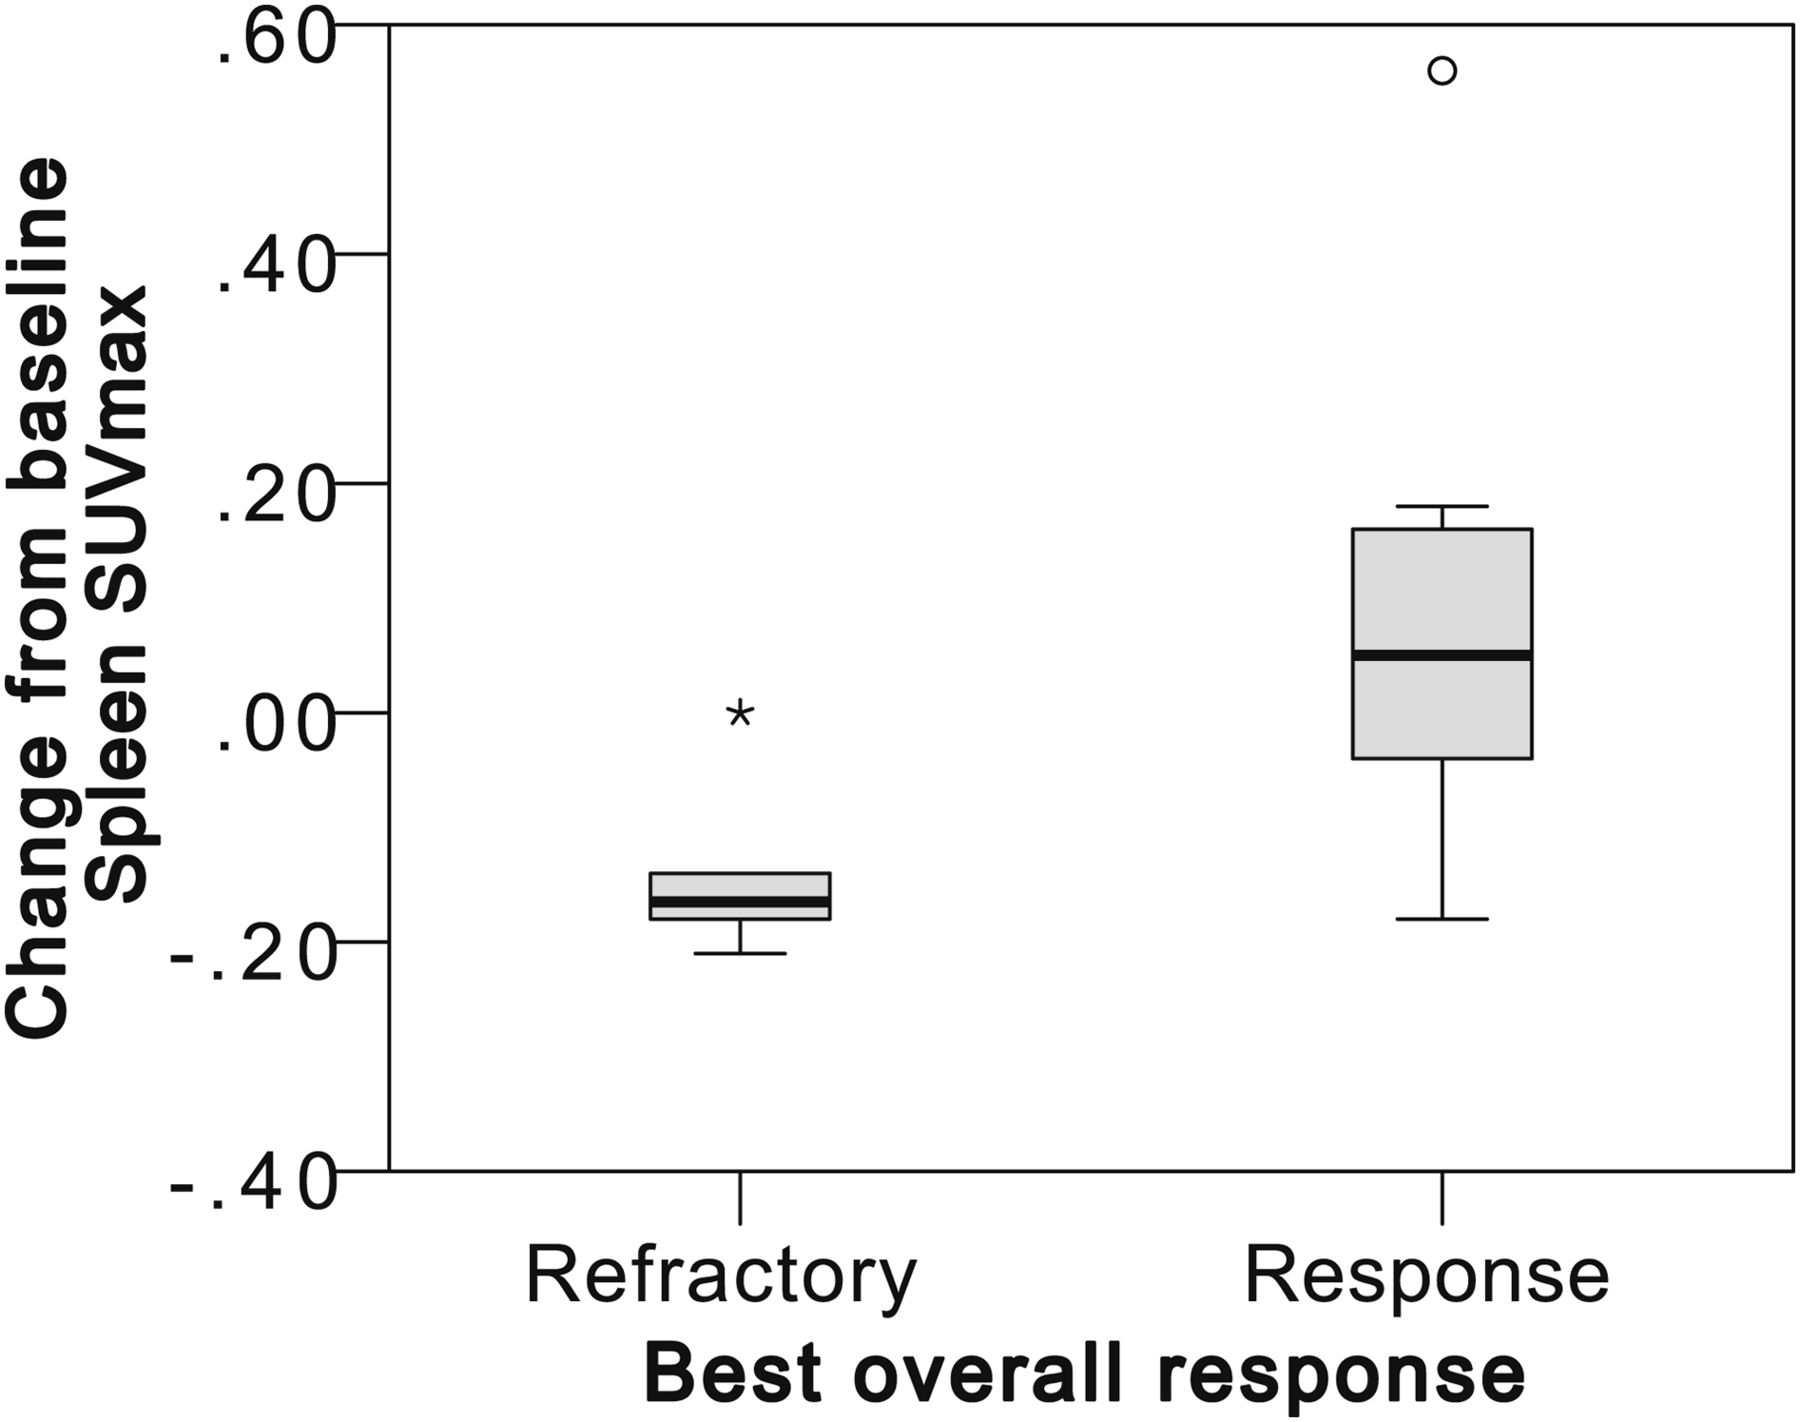
- FIGURE 3.
Responders have an increase in spleen metabolism (ΔSUVspleen) at 3 mo.
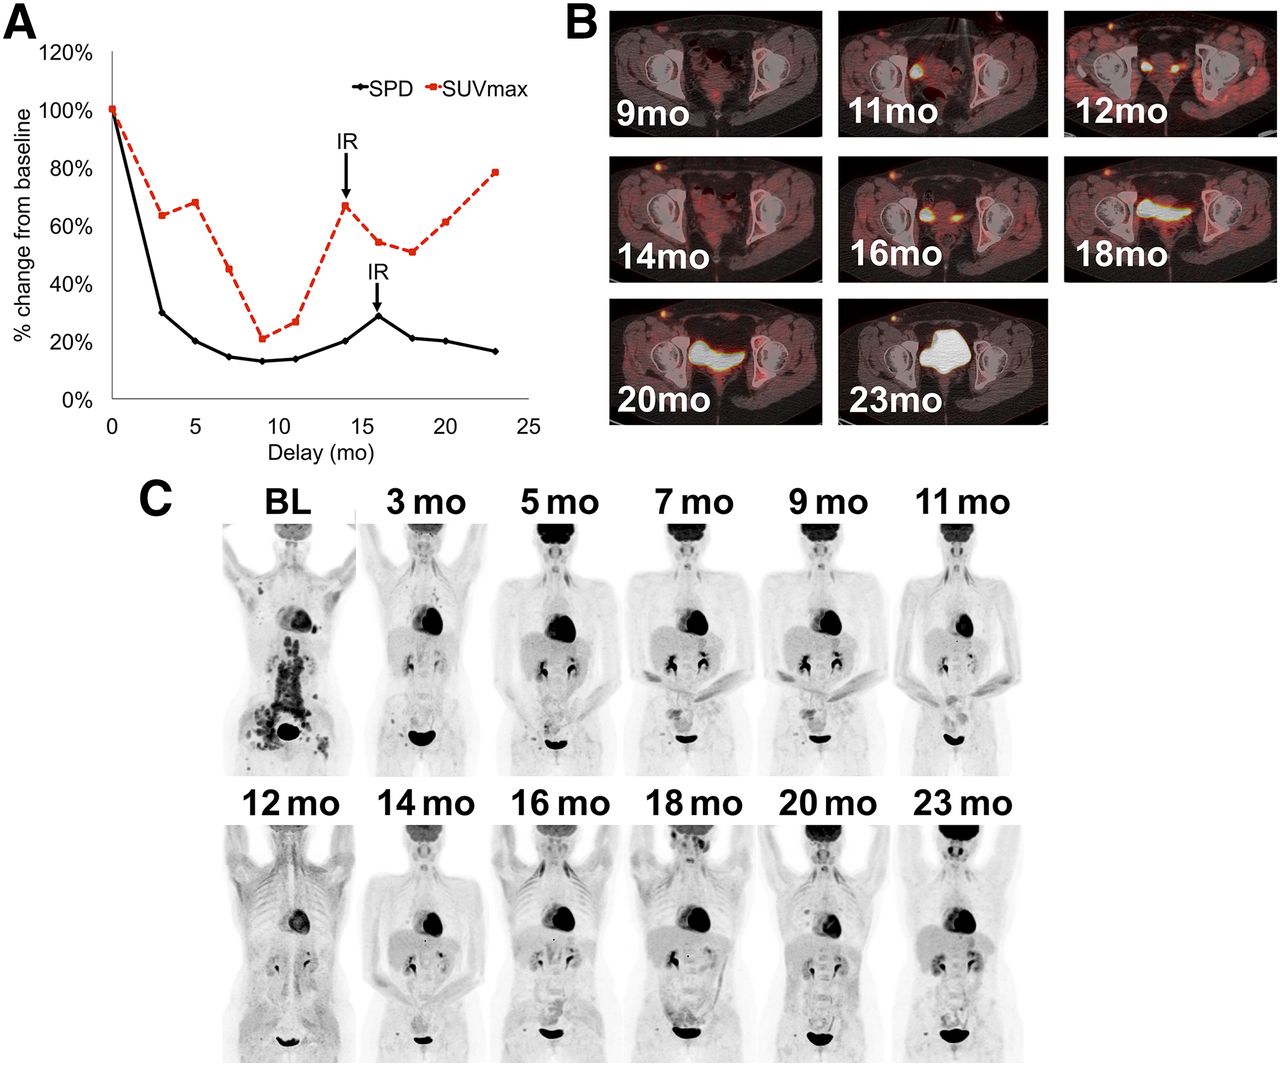
- FIGURE 4.
IR type 2: transient size progression. (A) Evolution of SPD and SUVmax after treatment initiation expressed as percentage. (B) Evolution of right inguinal lesion. (C) Evolution of patient.
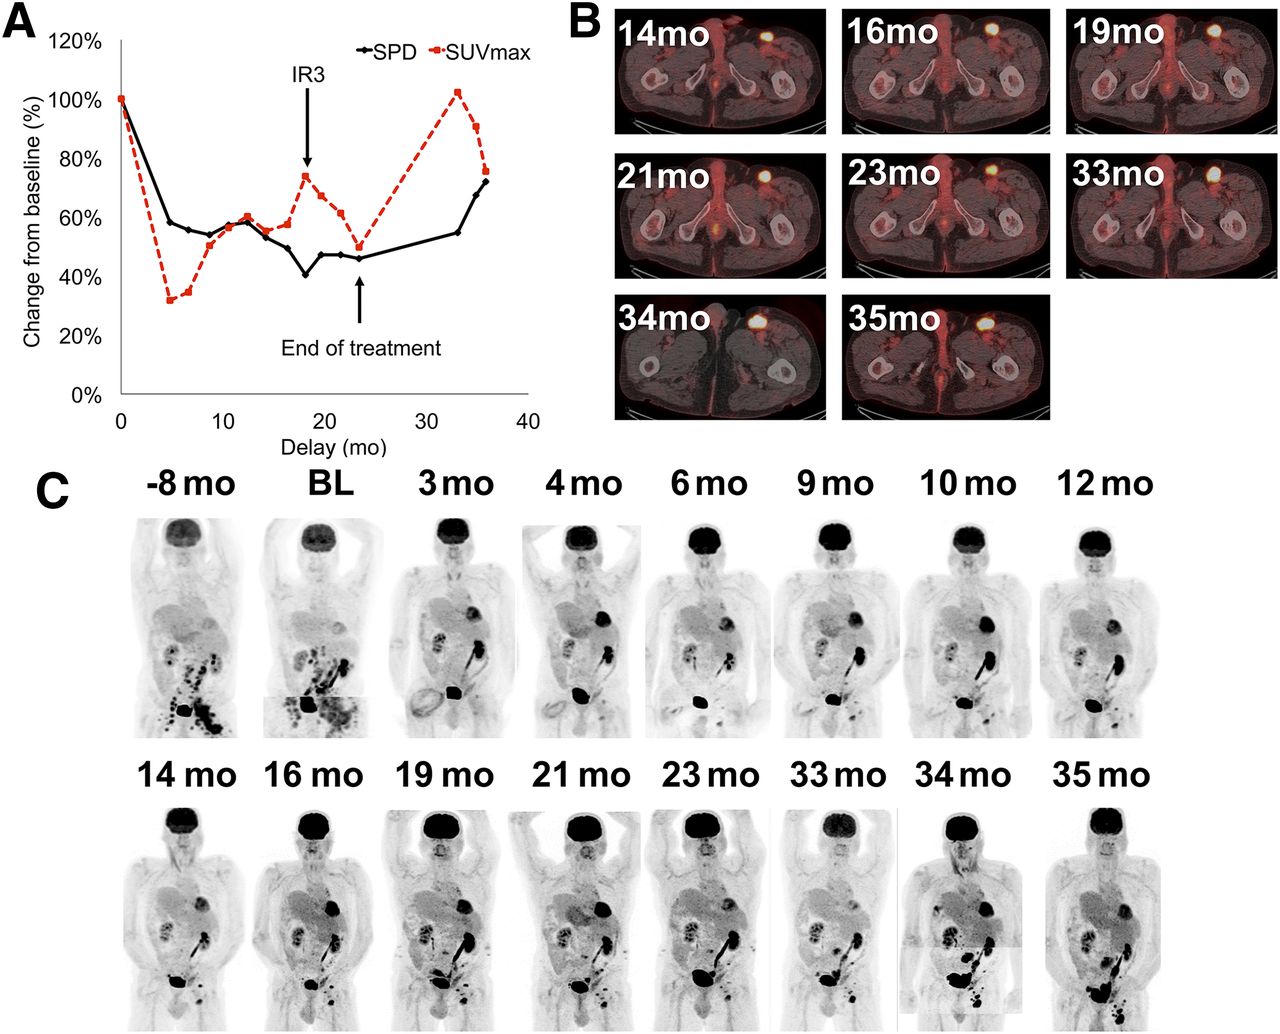
- FIGURE 5.
IR type 3: transient SUVmax progression. (A) Evolution of SPD and SUVmax after treatment initiation expressed as percentage. Evolution of left inguinal lesion (B) and of patient (C).
- FIGURE 6.
New non-Hodgkin lesions appeared during anti-PD1 treatment. 18F-FDG PET/CT detected grade 2 colitis (A), pancreatitis (B), and zona activation in right axilla (C, from left to right: maximum-intensity-projection baseline, maximum-intensity-projection and fused PET/CT image during follow-up).
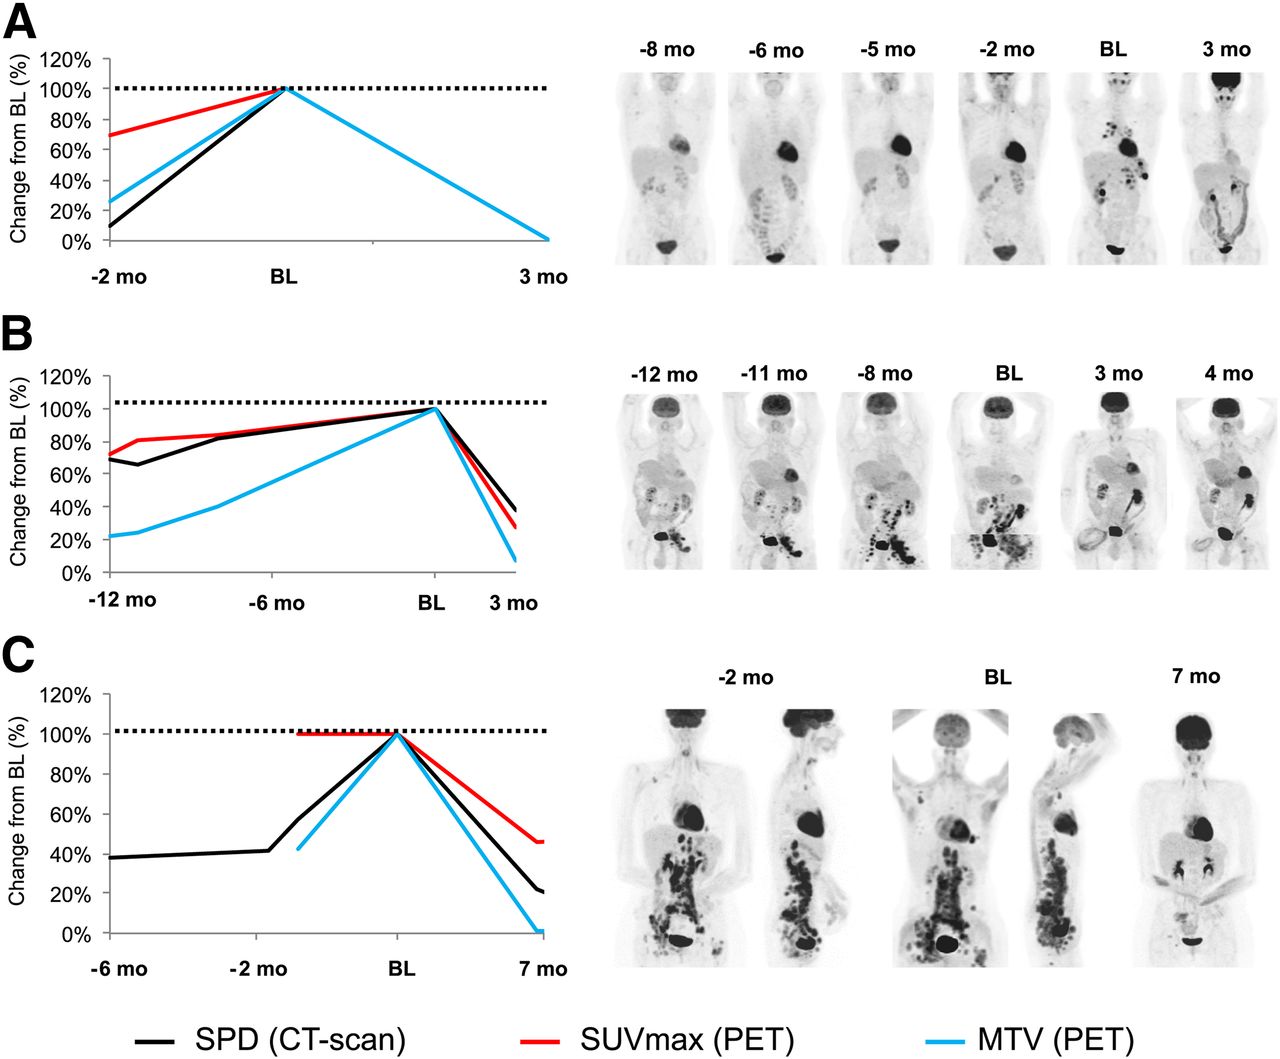
- FIGURE 7.
No hyperprogression was observed after anti-PD1 initiation. Tumor growth rate decreased in all patients (e.g., A–C). Value of SPD, SUVmax, and MTV is set up at 100% at baseline to evaluate their variation before and after treatment initiation.


Tables
Characteristic Median no. Sex Male 9 (56) Female 7 (44) Treatment Pembrolizumab (clinical trial) 15 (94) 200 mg/2 wk (NCT01953692) 8 (50) 200 mg/3 wk (NCT02453594) 7 (44) Nivolumab (compassionate) 1 (6) 3 mg/kg/2 wk 1 (6) Age 39 (range, 19–69) Delay since first diagnosis 4.4 y (range, 0.6–14.8) Ann Arbor stage Localized 5 (31) I 0 (0) IIA 2 (13) IIB 3 (19) Advanced 11 (69) III 1 (6) IV 10 (63) Prior treatment Previous lines of therapy* 6 (range, 3–13) Chemotherapies 16 (100) Targeted molecular agents 5 (31) Autologous stem cell transplantation 8 (50) Radiation therapy 5 (31) ↵* Excluding high-dose preparative regimen prior to autologous stem cell transplantation.
Data in parentheses are percentages, unless otherwise indicated.
Refractory (n = 7) Responding (n = 9) Parameter Evaluation Mean Median Mean Median P Guideline ΔSPD-Cheson BL (cm2) 23.7 20.1 40.3 16.5 0.31 Δ3 −19% −17% −70% −79% 0.03 PET-5PS 3 mo 4.43 5 3.56 4 0.13 Tumor 18F-FDG uptake SUVmean BL 4.42 4.7 5.52 5.3 0.11 Δ3 −11% −13% −54% −44% 0.03 SUVmax BL 12.33 14.3 16.18 14.4 0.31 Δ3 −8% −17% −63% −65% 0.09 MTV BL (cm3) 85 54 339 41 0.06 Δ3 49% −37% −90% −98% 0.02 TLG BL (SUV⋅cm3) 85 54 339 41 0.06 Δ3 49% −37% −90% −98% 0.02 Lymphoid 18F-FDG uptake Spleen BL* 3 2.9 2.67 2.5 0.46 Δ3* −14% −16% 8% 5% 0.03 Thymus BL* 1.62 1.5 1.76 1.9 0.6 Δ3* −5% 0% 11% 8% 0.6 Ileocaecal BL 3.71 2.9 2.78 2.6 0.74 Δ3 −11% −7% 9% 17% 0.74 Osteomedullary BL† 2.79 2.6 3.71 3.05 0.21 Δ3† −6% −13% −4% −4% 0.74 Sarcopenia Skeletal muscle index BL (cm2⋅m-2) 68 65 74 71 0.87 Δ3 3% 3% 3% 0% 1 *Missing data in refractory group.
†Missing data in response group.
Data are distribution of imaging biomarkers in refractory and responding patients at baseline (BL) and changes 3 mo after anti-PD1 initiation (Δ3, expressed as a percentage). Wilcoxon test showed significant differences between the 2 groups.
Refractory (n = 7) Responding (n = 9) Biomarker Evaluation Mean Median Mean Median P Albumin BL (g/L) 38 38 34 39 0.31 Δ3 9% 5% 8% 2% 0.87 LDH BL (UI/L) 211 208 239 225 0.74 Δ3 −4% 0% −12% −21% 0.50 Leukocyte BL (g/L) 10.5 9.6 11.07 7.7 1.00 Δ3 −20% −14% −19% −18% 0.50 PNN BL (g/L) 6.6 6.6 8.71 6.7 0.61 Δ3 −19% −32% −30% −28% 1.00 PNEo BL (g/L) 1.19 0.5 0.22 0.1 0.15 Δ3† 39% 0% 499% 75% 0.75 PNBaso BL (g/L) 0.17 0 0.01 0 0.20 Δ3*† −67% −100% −100% Lymphocytes BL (G/L) 1.83 1.4 1 1.1 0.17 Δ3* 13% −2% 62% 33% 0.35 Monocytes BL (G/L) 0.81 0.7 1.1 0.6 0.92 Δ3 −2% 0% 1% 0% 0.50 CRP BL (mg/dL) 79 40 132 113 0.40 Δ3*† 57% −85% −55% −91% 0.29 Fibrinogen BL (G/L)* 6.32 6.8 5.64 5.7 0.60 Δ3*† −16% −29% −32% −29% 0.14 *Missing data in refractory group.
†Missing data in response group.
LDH = lactate dehydrogenase; PNN = polynuclear neutrophils; PNEo = polynuclear eosinophils; PNBaso = polynuclear basophils; CRP = C-reactive protein.
Data are distribution of biologic biomarkers in refractory and responding patients at baseline (BL) and change 3 mo after anti-PD1 initiation (Δ3, expressed as a percentage). Wilcoxon test did not show significant mean differences between those 2 groups.
Variable AUC P Guideline ΔSPD-Cheson 0.95 (0.83–1.0) 0.008 PET 5-point scale 0.80 (0.55–1.0) 0.079 Intensity of glucose consumption within tumor volume ΔSUVmean 0.89 (0.72–1.0) 0.01 ΔSUVmax 0.87 (0.67–1.0) 0.028 Tumor burden ΔMTV 0.98 (0.90–1.0) 0.005 ΔTLG 0.95 (0.86–1.0) 0.003 Intensity of glucose consumption within healthy lymphoid tissue ΔSUVmax spleen 0.85 (0.63–1.0) 0.04 Responders had significant decrease in tumor volume and metabolism and increase in spleen metabolism at 3 mo. Data in parentheses are 95% confidence intervals.
Criteria Complete response Partial response Progressive disease Lugano PET/CT score 1, 2, or 3 with or without a residual mass on 5PS OR on CT, target nodes/nodal masses must regress to ≤1.5 cm in LDi. PET/CT score 4 or 5 with reduced uptake compared with baseline and residual masses of any size. OR On CT ≥50% decrease in SPD of up to 6 target measurable nodes and extranodal sites. PET/CT score 4 or 5 with an increase in intensity of uptake from baseline or new 18F-FDG–avid foci consistent with lymphoma at interim or end-of-treatment assessment. OR On CT, an individual node/lesion must be abnormal with: LDi > 1.5 cm and increase by ≥50% from product of the perpendicular diameters nadir and an increase in LDi or SDi from nadir 0.5 cm for lesions ≤ 2 cm and 1.0 cm for lesions > 2 cm. In the setting of splenomegaly, the splenic length must increase by >50% of the extent of its prior increase beyond baseline (e.g., a 15-cm spleen must increase to >16 cm). If no prior splenomegaly, must increase by ≥2 cm from baseline. New or recurrent splenomegaly. New or clear progression of preexisiting nonmeasured lesions. Regrowth of previously resolved lesions A new node > 1.5 cm in any axis or a new extranodal site > 1.0 cm in any axis; if <1.0 cm in any axis, its presence must be unequivocal and must be attributable to lymphoma. Assessable disease of any size unequivocally attributable to lymphoma. AND/OR new or recurrent involvement of the bone marrow. LYRIC Same as Lugano Same as Lugano As with Lugano with the following exceptions: IR1: ≥50% increase in SPD in first 12 wk. IR2a: <50% increase in SPD with new lesions. IR2b: <50% increase in SPD with ≥50% increase in PPD of a lesion or set of lesions at any time during treatment. IR3: Increase in 18F-FDG uptake without a concomitant increase in lesion size meeting criteria for progressive disease. IR = immune response; LDi = longest diameter; SDi = short diameter; SPD = sum of the product of the diameters; PPD = product of the perpendicular diameters.
Refinement of Lugano classification lymphoma response criteria in era of immunomodulatory therapy as proposed by Cheson et al. (18).
18F-FDG–avid at 3 mo 18F-FDG–avid at 6 mo PET-5PS + − Total + − Total 18F-FDG–avid 3 mo later + 119 13 132 63 4 67 − 16 142 158 2 138 140 Total 135 155 290 65 142 207 PPV, 88% NPV, 92% PPV, 97% NPV, 97% We evaluated glucose metabolism within 290 Hodgkin lesions at baseline and every 3 mo after anti-PD1 initiation. PET-5PS had excellent NPV and PPV.


Jump to section
Related Articles
Cited By...
- Potential Theranostic Role of Bone Marrow Glucose Metabolism on Baseline 18F-FDG PET/CT in Metastatic Melanoma
- Intratumoral Immunotherapy: From Trial Design to Clinical Practice
- Early Response to First-Line Anti-PD-1 Treatment in Hodgkin Lymphoma: A PET-Based Analysis from the Prospective, Randomized Phase II NIVAHL Trial
- Diagnosis of Hyperprogressive Disease in Patients Treated with Checkpoint Inhibitors Using 18F-FDG PET/CT
- Is there a link between very early changes of primary and secondary lymphoid organs in 18F-FDG-PET/MRI and treatment response to checkpoint inhibitor therapy?
- Imaging the Cancer Immune Environment and Its Response to Pharmacologic Intervention, Part 1: The Role of 18F-FDG PET/CT
- Early 18F-FDG PET/CT Response Predicts Survival in Relapsed or Refractory Hodgkin Lymphoma Treated with Nivolumab