


Abstract
The σ1 receptors (S1Rs) are implicated in a variety of diseases including Alzheimer disease and cancer. Previous PET S1R radiotracers are characterized by slow kinetics or off-target binding that impedes their use in humans. Here, we report the first PET imaging evaluation in rhesus monkeys of 4 18F-labeled spirocyclic piperidine-based PET radiotracers (18F-1 to 18F-4). Methods: Baseline scans for the 4 radiotracers were obtained on an adult male rhesus monkey. Blocking scans were obtained with the S1R-selective agonist SA4503 to assess binding specificity of 18F-2 and 18F-4. Arterial input functions were measured, and binding parameters were determined with kinetic modeling analysis. Results: In the rhesus brain, all 4 radiotracers showed high and fast uptake. Tissue activity washout was rapid for 18F-2 and 18F-4, and much slower for 18F-1 and 18F-3, in line with their respective in vitro S1R-binding affinities. Both the 1-tissue-compartment and multilinear analysis-1 kinetic models provided good fits of time–activity curves and reliable estimates of distribution volume. Regional distribution volume values were highest in the cingulate cortex and lowest in the thalamus for all radiotracers. 18F-4 showed greater differential uptake across brain regions and 3-fold-higher binding potential than 18F-2. SA4503 at the dose of 0.5 mg/kg blocked approximately 85% (18F-2) and 95% (18F-4) of radiotracer binding. Conclusion: Tracers 18F-2 and 18F-4 displayed high brain uptake and fast tissue kinetics, with 18F-4 having higher specific binding signals than 18F-2 in the same monkey. Taken together, these data indicate that both 18F-2 and 18F-4 possess the requisite kinetic and imaging properties as viable PET tracers for imaging S1R in the human brain.
The σ1 receptors (S1Rs) are chaperone proteins localized at mitochondrial associated endoplasmic reticulum membranes that have been shown to play a role in a wide range of diseases, including addiction, amnesia, Alzheimer disease, amyotrophic lateral sclerosis, and cancer (1,2). Several studies have detailed the roles of S1R in regulating potassium channels, neuritogenesis, calcium signaling, memory, and drug addiction (3–5). A variety of psychoactive chemicals and neurosteroids have been shown to interact with S1R, including haloperidol, (+)-N-allylnormetazocine (SKF-10,047), cocaine, and progesterone (6–8). Maurice et al. (9) demonstrated that the S1R agonists (+)-pentazocine, PRE-084, and SA4503 exhibit antiamnesia effects in a dose-dependent manner in mice with β25–35 amyloid–induced amnesia. These results demonstrate a link between S1R and the pathologic states affecting the cholinergic and glutamatergic systems, which may be of therapeutic importance in the process of aging (9).
Given the diverse interactions of S1R in pathophysiology, a PET imaging agent for use in humans would allow for the noninvasive investigation of S1R in vivo and lead to new understandings of its function and dysfunction in disease states. It will also make it possible to correlate and translate preclinical findings in animal models to humans and help in the development of novel therapeutic agents.
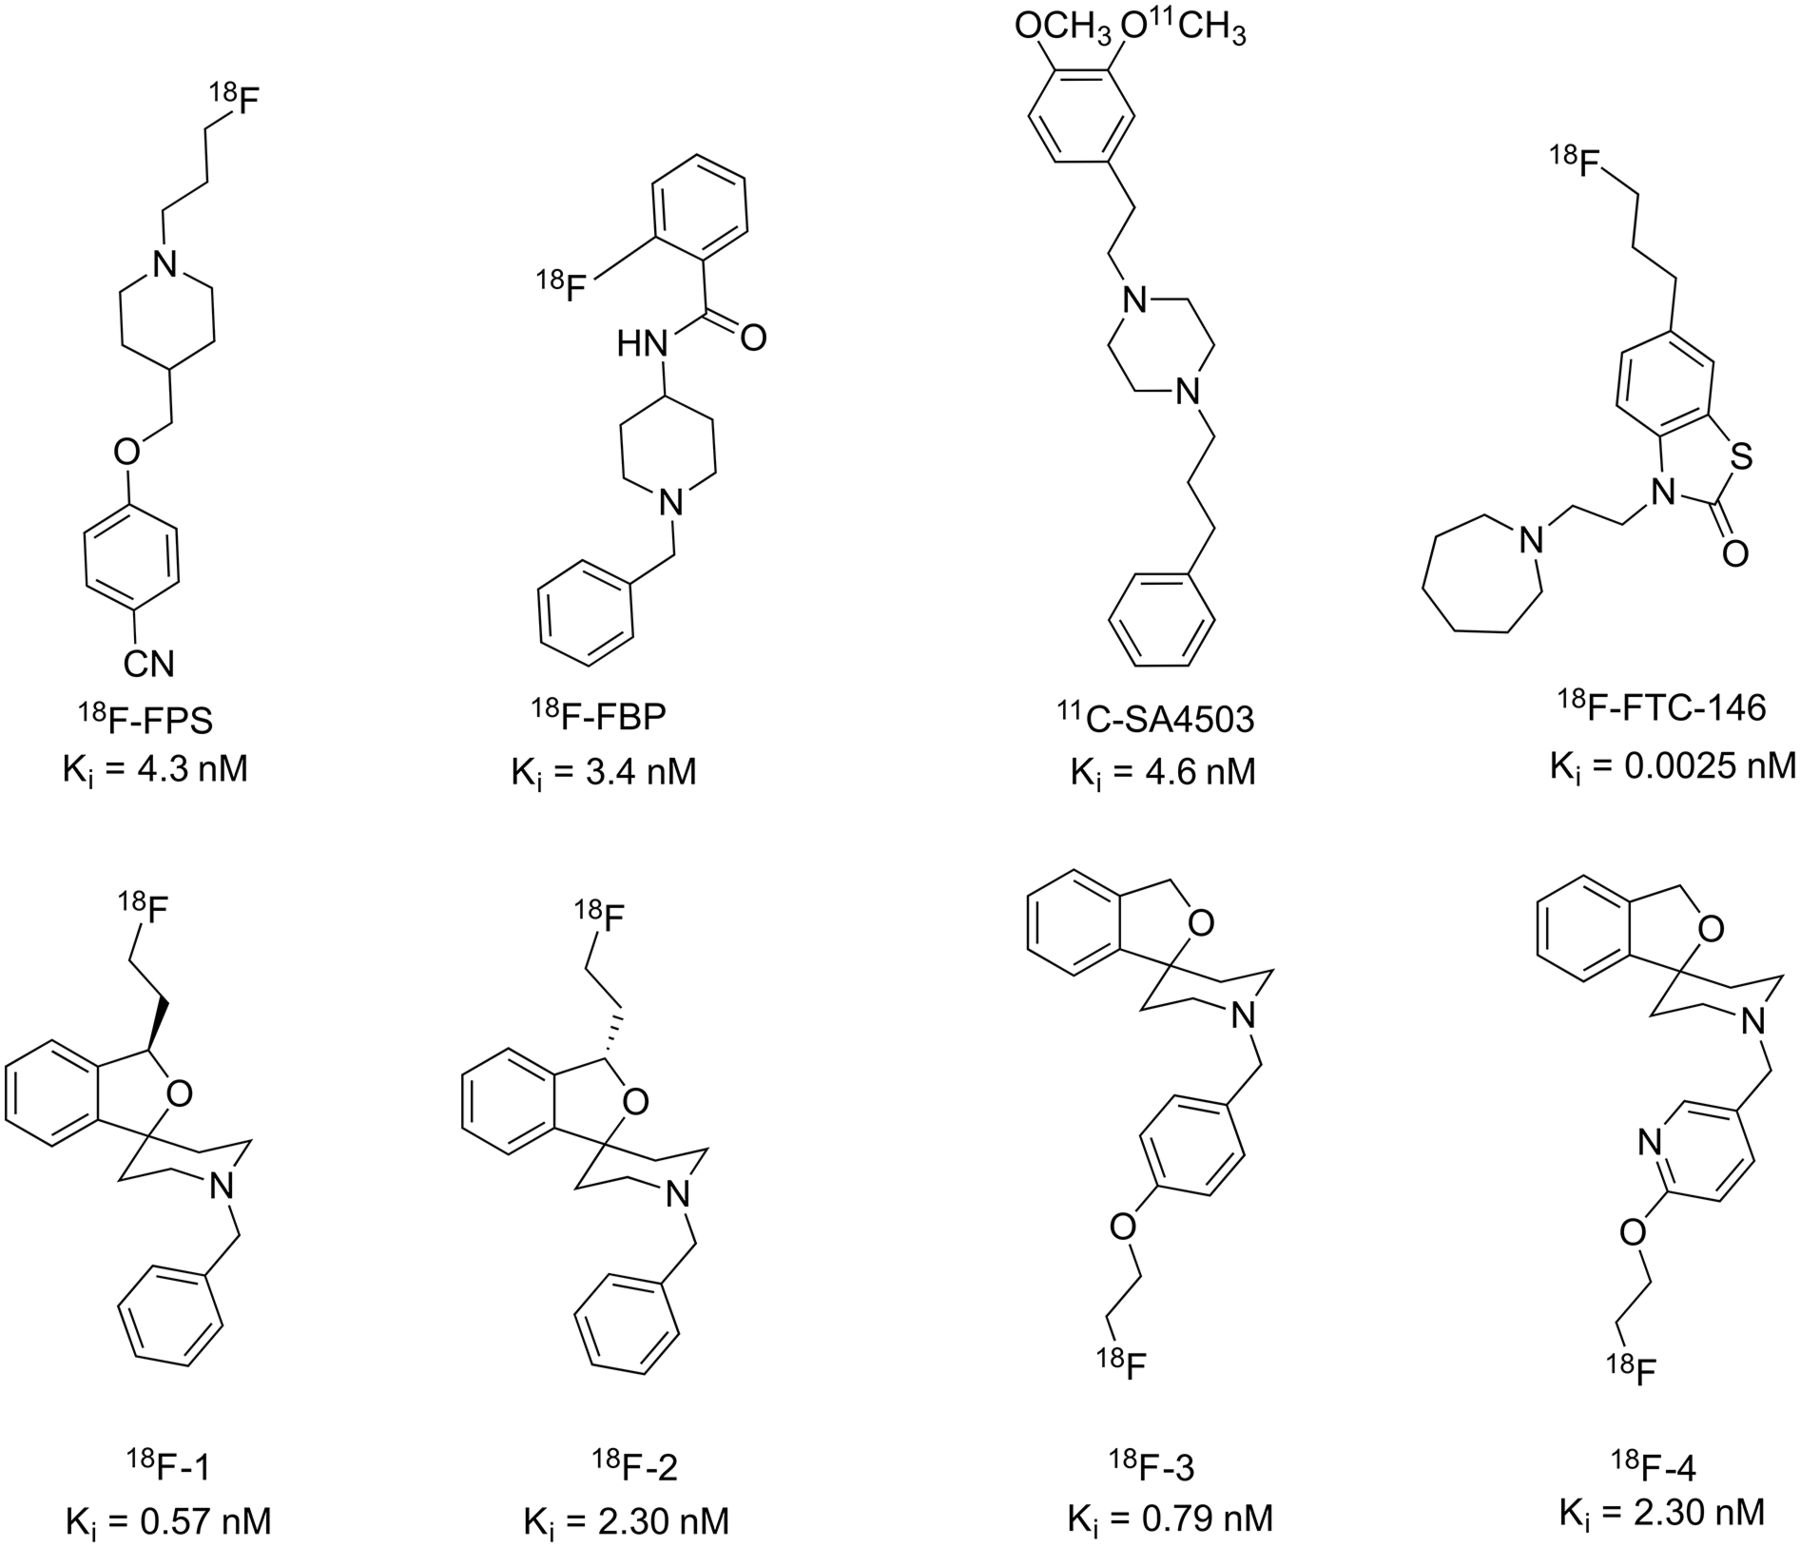
Several PET radioligands for S1R have been developed, including 18F-FPS, 18F-FBP, 18F-FTC-146, and 11C-SA4503 (Fig. 1) (10–13). An ideal tracer would possess appropriate affinity; high selectivity for S1R versus S2R and the vesicular acetylcholine transporter (VAChT); and fast, reversible tissue kinetics. Furthermore, it should have the requisite lipophilicity (Log D = 1–3) to cross the blood–brain barrier (14). (R)-(+) and (S)-(–)-18F-fluspidine (18F-1 and 18F-2, respectively) demonstrated good S1R binding affinity and favorable kinetics when tested in rodents and pigs (15–17). Kranz et al. (18) also evaluated 18F-2 in 4 healthy human subjects for dosimetry calculations. Li et al. (14) described a series of spirocyclic piperidine derivatives with subnanomolar affinity for S1R and greater than 100-fold selectivity over S2R and VAChT, including 18F-1′-(4-fluoroethoxy)benzyl)-3H-spiro[2-benzofuran-1,4′-piperidine] (18F-3). In a subsequent paper, Chen et al. (19) reported the synthesis and evaluation of 18F-1′-((6-(2-fluoroethoxy)pyridin-3-yl)methyl)-3H-spiro[2-benzofuran-1,4′-piperidine] (18F-4) in mice. Faster clearance and greater specific binding was observed for the N-pyridinyl analog 18F-4 than the N-benzyl analog 18F-3. The spirocyclic piperidine series thus demonstrated promising properties to image S1R with PET based on their high selectivity toward S1R and good binding characteristics in rodents, pigs, and a preliminary human study (14,16–19). Here, we report the first PET imaging evaluation in nonhuman primates of 4 radioligands (18F-1 through 18F-4, Fig. 1) from this series to assess their pharmacokinetics and in vivo binding properties, and to select the most suitable tracer for advancing to evaluation in humans.

MATERIALS AND METHODS
Chemistry
Precursors and reference standards for 18F-1 and 18F-2 were prepared at Westfälische Wilhelms-Universität Münster, as previously reported (15). Precursors and standards for 18F-3 and 18F-4 were synthesized at Beijing Normal University (14).
Radiochemistry
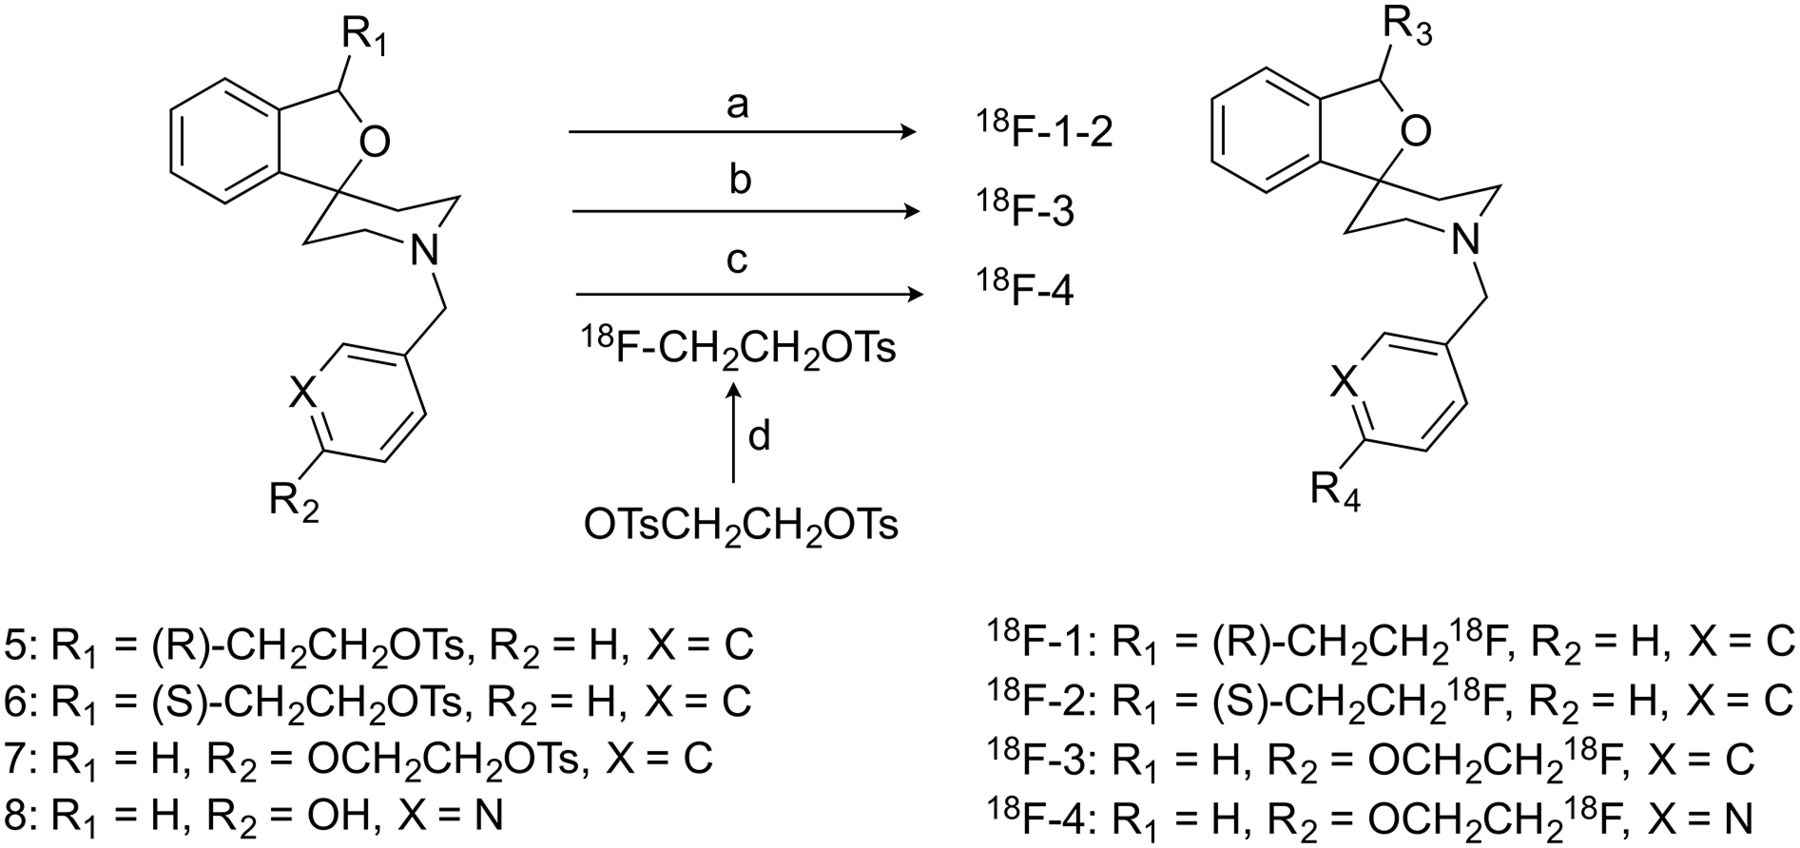
Instrumentation for radiochemistry procedures and the production of 18F-fluoride have been described previously (20,21). Radiosynthesis of 18F-1 to 18F-3 was achieved via nucleophilic displacement of the corresponding tosylate precursors (5–7, Fig. 2) with 18F− in the presence of Kyrptofix 2.2.2 and potassium carbonate (14,15). 18F-4 was prepared in a 2-pot, 2-step synthesis, first isolating 18F-fluoroethyl tosylate followed by its reaction with the 2-pyridinol precursor (8, Fig. 2) (19,22). Chemical purity, radiochemical purity, and specific activity were determined by high-performance liquid chromatography analysis of the final product solutions. Identities of the labeled compounds were confirmed by coinjection of the products with their respective unlabeled reference standards.

Syntheses of the 4 radiotracers. Reagents and conditions: (a) 18F−, Kryptofix 2.2.2, K2CO3, MeCN, 85°C, 20 min; (b) 18F−, Kryptofix 2.2.2, K2CO3, MeCN, 95°C, 20 min; (c) 18F−, Kryptofix 2.2.2, K2CO3, MeCN, 80°C, 10 min; and (d) Cs2CO3, DMF, 110°C, 10 min.
PET Imaging Experiments in Rhesus Monkeys
PET Procedures
Experiments were performed in rhesus monkeys (Macaca mulatta) according to procedures approved by the Yale University Institutional Animal Care and Use Committee and described previously (20).
Three animals were used in this study. The animals were immobilized with ketamine (10 mg/kg intramuscularly) and anesthetized with 1.5%–2.5% isoflurane. An arterial line was placed in the radial or femoral artery for blood sampling. Scans were acquired on a FOCUS 220 camera (Siemens Medical Solutions). Before radioligand injection, a 9-min transmission scan was obtained for attenuation correction. Baseline scans were obtained over 4 h on a 7-y-old male rhesus monkey (13.8 kg). Each tracer was injected intravenously over 3 min as a slow bolus (∼185 MBq in 10 mL). Two-hour blocking scans of 18F-2 and 18F-4 were acquired with a dose of SA4503 (0.5 mg/kg) (6) given intravenously 10 min before radioligand administration. Two additional baseline scans were obtained for 18F-2 and 18F-4 on a 12-y-old female (6.1 kg) and a 9-y-old female (9.7 kg) monkey, respectively, for comparison with baseline scans obtained in the 7-y-old male. Eight PET scans were obtained in total.
Metabolite Analysis and Arterial Input Function Measurement
Procedures for measurement of the arterial input function, including sample preparation, metabolite analysis, and data processing, have been described previously (20). Arterial samples were collected at preselected time points, and the radioactivity concentrations in the whole blood and plasma were measured. During the 4-h baseline scans, samples at 3, 8, 15, 30, 60, 90, 120, 180, and 240 min (3, 8, 15, 30, 60, 90, and 120 min for the 2-h scans) after injection were processed and analyzed by high-performance liquid chromatography using a modified column-switching system (23) to determine the fraction of unmetabolized tracer over the course of the scan. A biexponential function was fitted to the measured parent fractions to produce a continuous function describing the parent fraction over time. The input function was calculated as the product of the total plasma activity and interpolated parent fraction at each time point. The measured input function values were fitted to a sum of 3 exponentials, and the fitted values were used as inputs for kinetic analyses.
Plasma Free Fraction (fP) and Log D Measurement
The fP was measured via ultrafiltration of 0.3-mL aliquots of plasma spiked with a small amount (∼740 kBq) of radioligand, repeated in triplicate. The amount of radioactivity in the filter and filtrate was counted and fP calculated as the ratio of the concentration (radioactivity/mL) of the filtrate to the total activity. The log D of each tracer was determined by the shake-flask method as described previously (24).
Image Analysis and Kinetic Modeling
Procedures for PET image reconstruction, definition of regions of interest (ROIs), and kinetic analysis have been detailed previously (20). Emission data were attenuation corrected using the transmission scan, and dynamic images (33 frames over 120 min or 57 frames over 240 min) were reconstructed using a filtered backprojected algorithm with a Shepp-Logan filter. ROIs were defined from a single representative anatomic rhesus MR image registered to a template image. Registration parameters were derived to apply ROIs to each PET scan, and time–activity curves were generated for the following 16 cortical and subcortical brain regions: amygdala, brain stem, caudate, cerebellum, cingulate cortex, frontal cortex, globus pallidus, hippocampus, insula, nucleus accumbens, occipital cortex, pons, putamen, substantia nigra, temporal cortex, and thalamus.
Regional volumes of distribution (VT, mL·cm−3) were determined by kinetic analysis of the time–activity curves, using the metabolite-corrected arterial plasma input function according to 1-tissue- and 2-tissue-compartment (1TC and 2TC, respectively) models and the multilinear analysis-1 (MA1) method as described previously (25,26). Standard errors in VT estimates from different models were compared to determine the optimal model for analysis.
Comparison of VT between tracers was used to determine the relative regional nondisplaceable binding potential (BPND) by graphical methods (27). In this analysis,  of one tracer is plotted on the x-axis and
  of another is plotted on the y-axis. A linear regression yields the following equation:
 Eq. 1More negative values for the y-intercept indicate
  >
>  and vice versa. Because fP was measured for all tracers, the ratio of equilibrium dissociation constants (KD) between the tracers can be determined from the slope of the regression (27).
S1R occupancies with SA4503 were calculated using VT values from all 16 ROIs to create occupancy plots according to the method of Cunningham et al. (28). For 18F-2 and 18F-4, regional BPND values were calculated using the nondisplaceable volume of distribution (VND) obtained from the occupancy studies, where BPND = (VT/VND) – 1 (26).
RESULTS
Radiochemistry
All tracers were synthesized in greater than 96% radiochemical purity and high specific activity (349.4 GBq/μmol average at the end of synthesis, n = 7). Total synthesis time was 110 ± 30 min. Radiochemical yields (±SD where applicable) were 2.0%, 6.2% ± 1.7% (n = 2), 0.66%, and 6.5% ± 9.2% (n = 3), respectively, for 18F-1, 18F-2, 18F-3, and 18F-4.
In Vivo Evaluation in Rhesus Monkeys
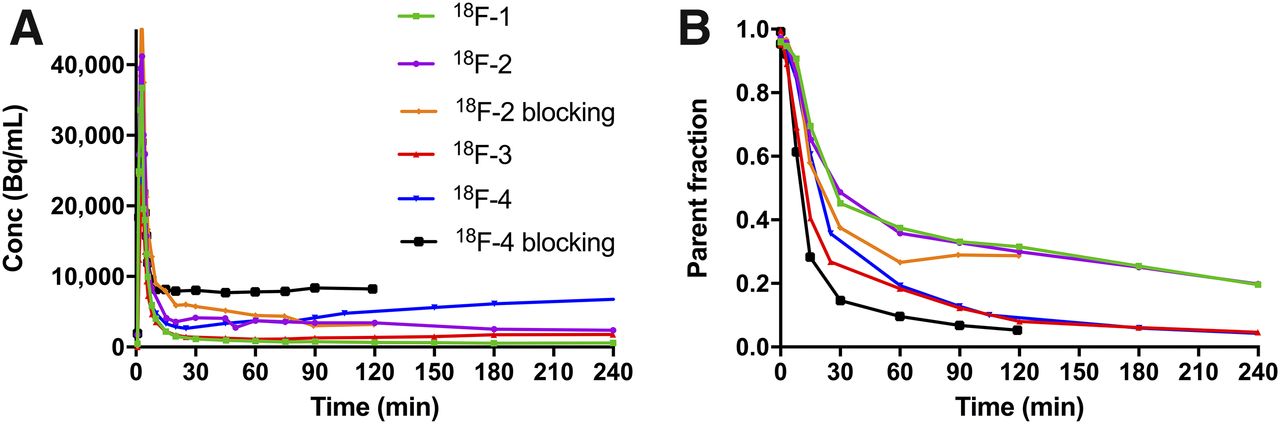
After a bolus injection of the tracers (179.8 ± 12.8 MBq; specific activity, 315.3 GBq/μmol average at time of injection; injected mass, 0.34 ± 0.25 μg; n = 6), total plasma activity and parent activity exhibited a rapid rise and clearance, followed by a stabilization or slow decrease over time for 18F-1 to 18F-3, and a slight increase for 18F-4 (Fig. 3A). Metabolism rates were moderate, with 37%, 35%, 18%, and 19% of parent fraction, respectively, for 18F-1, 18F-2, 18F-3, and 18F-4 at 60 min after injection (Fig. 3B). Blocking with SA4503 increased plasma activity particularly for 18F-4 (Fig. 3A) and increased metabolism for 18F-2 and 18F-4 (Fig. 3B). Typical metabolite profiles over time under baseline conditions are presented in Supplemental Figures 1–4 (supplemental materials are available at http://jnm.snmjournals.org). Polar metabolites have been previously suggested for these tracers that should not enter the brain and interfere with PET quantitation (14,15,17).

Plasma analysis of the 4 radiotracers in the same monkey. (A) Total radioactivity in plasma over time. (B) Time course of parent fraction from 4-h baseline and 2-h blocking scans with SA4503.
Plasma fP values were measured at 2%, 2%, 8%, and 17%, respectively, for 18F-1, 18F-2, 18F-3, and 18F-4, consistent with their respective measured Log D values of 2.80, 2.80, 2.55, and 2.50. A summary of in vitro Ki, fP, and Log D values are shown in Table 1.
Comparison of Ki, Selectivity, Lipophilicity, and fP
Regional time–activity curves (Fig. 4) were generated and analyzed with 1TC and 2TC models (26), as well as the MA1 method (25) using the metabolite-corrected arterial plasma input function. The 1TC model was found to provide better fits than the 2TC model, with the 2TC model producing high SEs in VT estimates across many regions (e.g., >20% SE in 28% of regions under all conditions, and >150% SE in 75% of regions for 18F-4 under blocking condition). Therefore, the 1TC would be considered an appropriate model for analysis of imaging data. Regional VT values estimated by MA1 showed good correlation with 1TC values (e.g., for 18F-4, VT (MA1) = 0.975 VT (1TC) + 1.239, r2 = 0.996). Listed in Table 2 are the 1TC-derived VT values for the tracers across brain regions, under both baseline and blocking conditions. The time stability of VT values was also determined for the 4 tracers, revealing bias and regional errors associated with shorter scan times (Fig. 5).

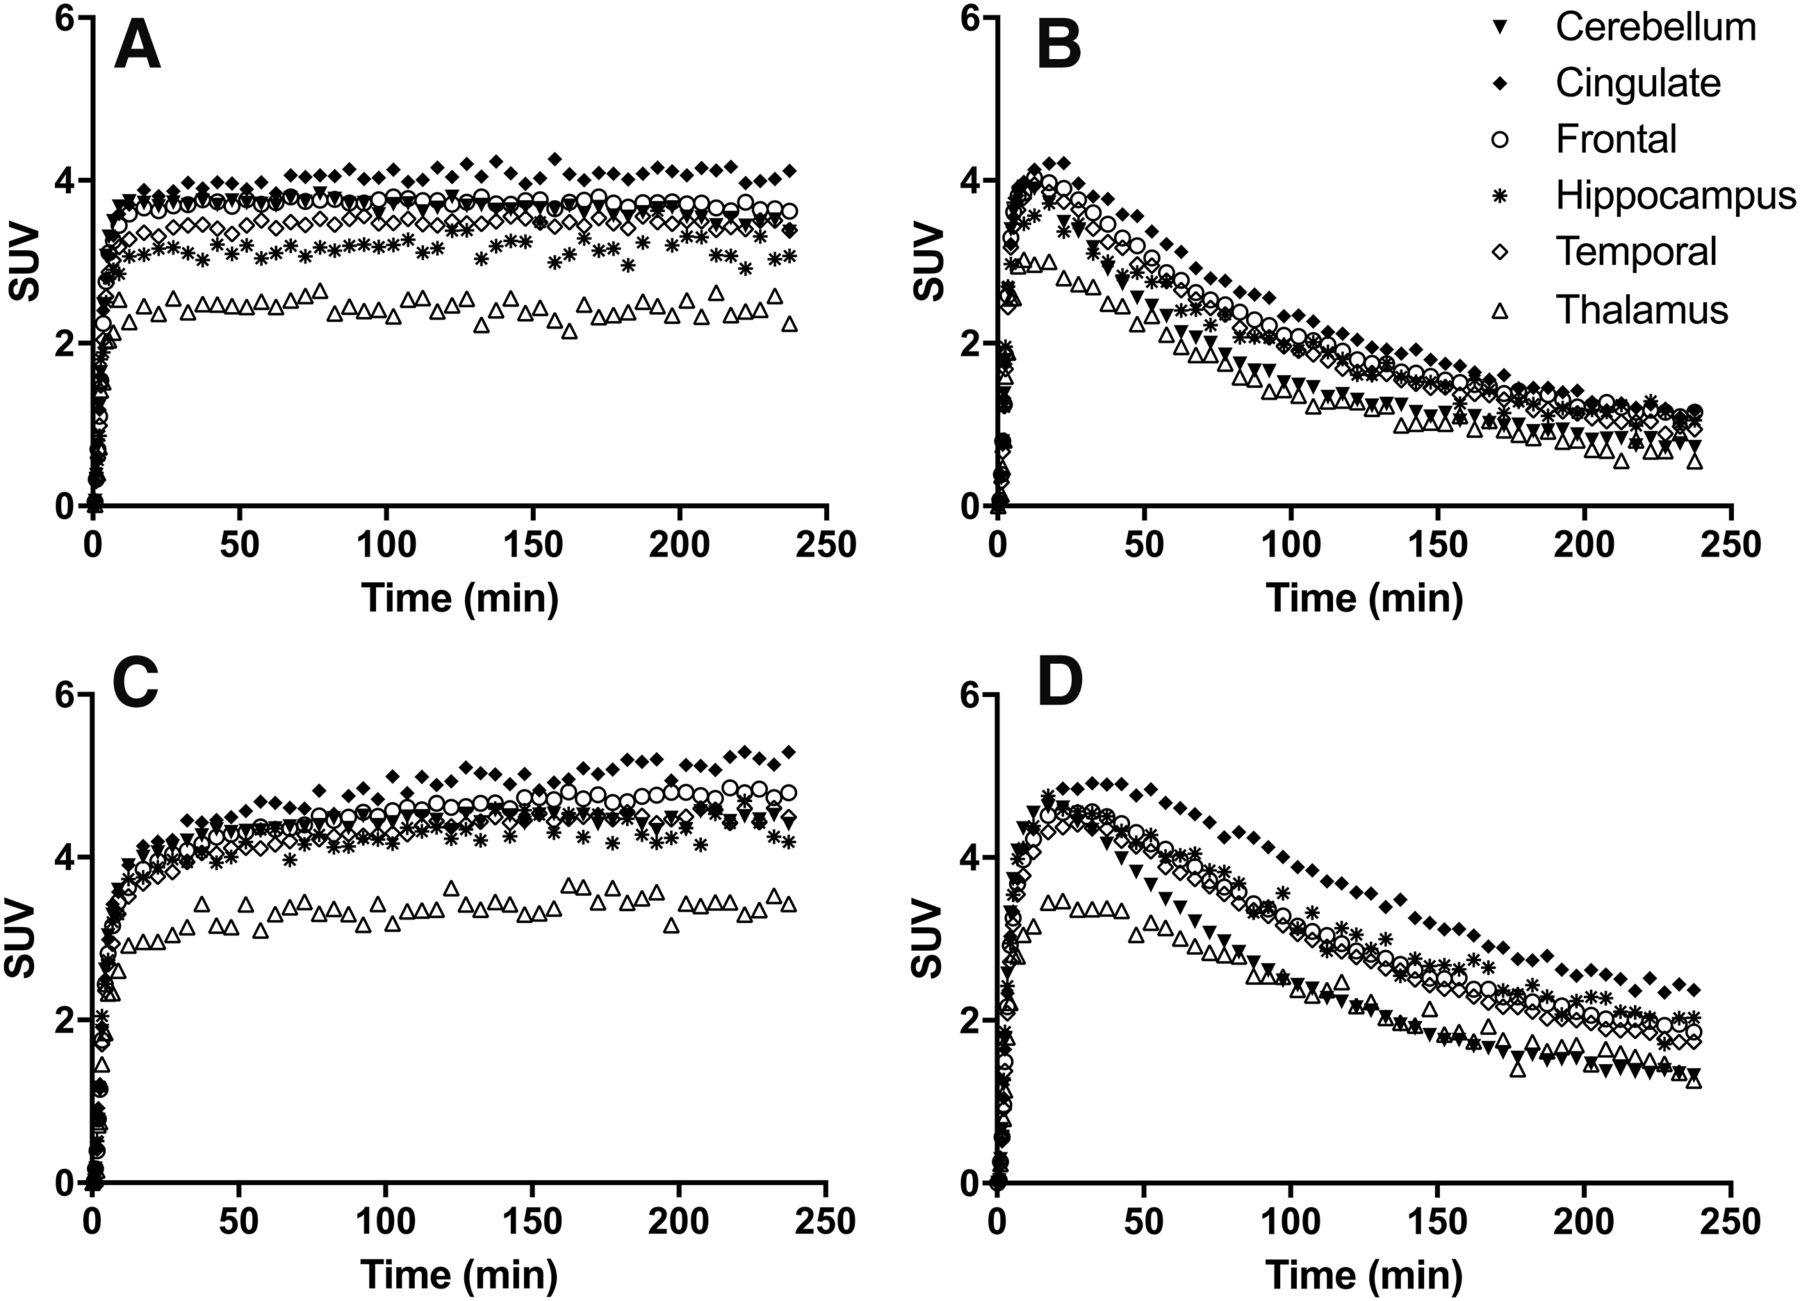
Time–activity curves of 18F-1 (A), 18F-2 (B), 18F-3 (C), and 18F-4 (D) in selected brain regions from baseline scans in the same monkey. For clarity of presentation, not all brain regions are displayed.
Comparison of 1TC-Derived VT Values for the 4 Tracers Across Different Brain Regions

Time stability of VT for the 4 tracers. Times refer to midtimes of each 10-min acquisition. Data from 60 to 240 min were analyzed in 30-min increments, and VT expressed as percentage of value derived with complete dataset (240 min). Each point is average VT from 16 ROIs. Deviation from 100% of mean value indicates bias associated with shorter scanning times, whereas SD indicates regional error associated with shorter scanning times. Bias and error for 18F-3 at 60 min was too large (>10,000%) to display.
Blocking with SA4503 reduced VT values for 18F-2 and 18F-4 in all brain regions, indicating the lack of a suitable reference region for S1R in monkey (Table 2). Receptor occupancies by 0.5 mg/kg SA4503 were 85% and 95% for 18F-2 and 18F-4, respectively (Supplemental Fig. 5). Values of VND were calculated for 18F-2 and 18F-4 from the occupancy plots using 1TC- and MA1-derived VT values (28), yielding VND (1TC) = 6.87 and VND (MA1) = 7.30 for 18F-2 and VND (1TC) = 9.29 and VND (MA1) = 10.44 for 18F-4. These values were then used to calculate the BPND, as a measure of specific binding signal, across the brain regions (Table 3). Relative BPND and KD for all tracers were also assessed by the graphical methods of Guo et al. (27) by comparing baseline VT values, which showed a rank order of 18F-3 > 18F-1 > 18F-4 > 18F-2 for BPND and 18F-4 > 18F-2 > 18F-1 > 18F-3 for KD.
1TC-Derived BPND Values of 18F-2 and 18F-4 Across Different Brain Regions
DISCUSSION
In this article, we describe the evaluation of 4 18F-labeled S1R tracers in nonhuman primates to compare their pharmacokinetic and binding characteristics and assess feasibility for use in human subjects.
In the rhesus monkey brain, all 4 tracers demonstrated high uptake, as shown in time–activity curves presented in Figures 4A–4D. Activity peaked between 10 and 20 min after injection, indicating fast uptake kinetics. Fast tracer washout was observed for 18F-2 and 18F-4, with much slower washout for 18F-1 and 18F-3. Time–activity curves depict 18F-4 as having the most heterogeneous uptake across brain regions, further displayed in summed images of the adult male monkey (Figs. 6A–6D). For all tracers, uptake was highest in the cingulate cortex, insula, and frontal cortex; intermediate in the hippocampus, temporal, and occipital cortices; and lowest in the caudate and thalamus (Figs. 4A–4D). Although this distribution pattern is in agreement with results from an in vivo imaging study with 11C-SA4503 and in vitro autoradiography study with (+)-3H-3-PPP in rhesus monkey brains (29,30), it differs somewhat from ex vivo autoradiography studies with 18F-3 and 18F-4 in rats (14,19), which showed high accumulation in the temporal cortex, frontal cortex, and vermian lobule of the cerebellum; moderate uptake in the hippocampus, hypothalamus, and thalamus; and low accumulation in the nucleus accumbens. Studies with 18F-fluspidine in mice (16) showed the highest uptake in the facial nucleus, moderate uptake in the cerebellum, and low binding in the thalamus and caudate/putamen. PET imaging studies using 18F-1 and 18F-2 in pigs (17) demonstrated narrow regional differences, with the highest uptake in the midbrain, pons, and thalamus; moderate uptake in the hippocampus and temporal and occipital cortices; and lowest uptake in the frontal cortex. The distribution patterns of these 4 tracers in monkeys also align well with that of 11C-SA4503 in humans (31), with high uptake in cortical and limbic areas and lower uptake in caudate, putamen, and thalamus. Species differences in tracer uptake between rodents, pigs, and primates highlight the importance of tracer evaluation in nonhuman primates before translation to humans.

PET images (coronal, transverse, and sagittal views) summed from 30 to 45 min of baseline scans for 18F-1 (A), 18F-2 (B), 18F-3 (C), and 18F-4 (D).
Regional VT values appear to be sex-independent because a comparison baseline scan for 18F-4 in a 9-y-old female rhesus monkey gave numbers similar to those from the 7-y-old male (Table 2). However, the baseline VT values obtained with 18F-2 in the 12-y-old female were higher than those from the 7-y-old male, which could be due to individual animal variation in S1R expression, or age effect, as Matsuno et al. reported increased S1R density in aged rhesus monkeys (29).
A comparison of VT estimates versus scan time demonstrated the bias and regional error associated with shorter scan times (Fig. 5). With 60 min of scan data, VT values for both 18F-2 and 18F-4 were within 10% difference of those derived from the full 240 min data, and within 5% difference when estimated with 90 min of scan data. Tracers 18F-1 and 18F-3 demonstrated much larger bias and greater errors with shorter scan times, only approaching within 5% difference from the 240-min VT values at 210 min of scanning time. VT values for 18F-1 were underestimated whereas those of 18F-3 were overestimated with shorter acquisition times (Fig. 5). For these reasons, 18F-2 and 18F-4 gave reliable VT estimates at 90 min, whereas 18F-1 and 18F-3 required much longer scan times.
On the basis of their extremely slow tissue kinetics, 18F-1 and 18F-3 were deemed unsuitable for PET neuroimaging of S1R in humans and therefore not selected for the blocking studies. VND for 18F-2 and 18F-4 was estimated from the occupancy plots and used to calculate BPND, with 1TC-derived values displayed in Table 3. These values demonstrate higher specific binding signals for 18F-4 than 18F-2. A graphical comparison of VT as a relative measure of BPND (27) revealed a BPND rank order of 18F-3 > 18F-1 > 18F-4 > 18F-2, further supporting the results derived from the blocking studies. The higher BPND values for 18F-1 and 18F-3 than 18F-2 and 18F-4 are likely due to their lower Ki values (i.e., higher S1R binding affinity), but higher affinity also contributes to slow and unfavorable binding kinetics in this instance. A comparison of the relative dissociation constants at equilibrium (KD) yielded a KD rank order of 18F-4 > 18F-2 > 18F-1 > 18F-3, which in general is consistent with in vitro Ki measurements (i.e., Ki values for 18F-4 and 18F-2 are higher than those for 18F-1 and 18F-3), but also reveals some differences between in vivo KD and in vitro Ki values (Table 1). In addition to species-specific variation, these differences between in vitro and in vivo affinities could be due to interlaboratory variations in methodologies and techniques, or temperature effects, because in vitro Ki measurements were performed at room temperature, whereas in vivo measurements were at body temperature (37°C). It should be noted, however, that this method of graphical comparison is less useful for 18F-1 and 18F-3 because they display nearly irreversible kinetics.
The irreversible nature of binding for 18F-1 was confirmed in an in vitro experiment to measure the individual rate constants (kon, koff) and the KD for 18F-1 and 18F-2, which generated a KD value of 0.099 nM for 18F-2 on cloned human S1R and kon and koff values of 3.46 × 10 M−1min−1 and 0.0342 min−1, respectively. However, for 18F-1, koff was extremely slow and could not be reliably measured (Supplemental Figs. 6 and 7; Supplemental Table 1).
18F-2 and 18F-4 may offer advantages over previously developed S1R PET tracers. 11C-SA4503 has been studied in rhesus monkeys (12,29), showing high uptake and regional distribution similar to 18F-2 and 18F-4 and with reasonable subtype selectivity for S1R (S1R/ S2R = 103). However, it demonstrates slow washout for the time scale of a 11C-labeled PET tracer (32) and requires an on-site cyclotron for production. Subsequent studies (33–35) with 11C-SA4503 found lower subtype selectivity (S1R/ S2R = 13.3–55.0) than previously reported, and when combined with its affinity for VAChT (Ki = 50 nM, Ki VAChT/Ki S1R = 11.3) (34), it may exhibit greater nonspecific binding than 18F-2 and 18F-4. A more recent S1R tracer, 18F-FTC-146, has been evaluated in mice, rats, and squirrel monkeys (36,37). It demonstrated high binding specificity and selectivity (Ki of 0.0025, 364, and 463 nM, respectively, for S1R, S2R, and VAChT) as well as favorable kinetics and promising imaging properties in the squirrel monkey brain (36). Nonetheless, 18F-FTC-146 was also found to have skull uptake in squirrel monkeys, potentially confounding PET quantitation in the brain and thus limiting its utility (36). Defluorination and bone uptake of many 18F-labeled tracers may occur in lower species but not in humans (38), so further studies are warranted for 18F-FTC-146. Defluorination was not observed for 18F-2 and 18F-4. Alongside these possible advantages over previously reported S1R tracers, 18F-2 and 18F-4 display fast kinetics and high regional BPND values, the requisite PET imaging characteristics to image and quantitate S1R in the primate brain.
CONCLUSION
In this report, we compare the binding and kinetic properties of 4 18F-labeled spirocyclic piperidine derivatives in nonhuman primates. Among these tracers, 18F-2 and 18F-4 exhibit favorable metabolic profiles, fast brain uptake kinetics, and high specific binding signals in rhesus monkeys. Tracer 18F-4 has 10-fold-higher fP, 3-fold-higher BPND, and greater VT values than 18F-2 when compared in the same monkey. Both tracers also give reliable VT estimates with short (90 min) scan times. Taken together, these results indicate that tracers 18F-2 and 18F-4 possess the requisite kinetic and imaging properties as viable PET tracers for imaging S1R in the primate brain, and thus warrant further evaluation in humans.
DISCLOSURE
No potential conflict of interest relevant to this article was reported.
Acknowledgments
We thank the staff at the Yale PET Center for their expert technical assistance.
Footnotes
Published online Feb. 23, 2017.
- © 2017 by the Society of Nuclear Medicine and Molecular Imaging.
REFERENCES
- Received for publication December 8, 2016.
- Accepted for publication February 9, 2017.


Jump to section
Related Articles
Cited By...
- No citing articles found.