


Abstract
In this study, we investigated the effects of chronic administration of an inhibitor of the β-site amyloid precursor protein-cleaving enzyme 1 (BACE1) on Alzheimer-related pathology by multitracer PET imaging in transgenic APPPS1-21 (TG) mice. Methods: Wild-type (WT) and TG mice received vehicle or BACE inhibitor (60 mg/kg) starting at 7 wk of age. Outcome measures of brain metabolism, neuroinflammation, and amyloid-β pathology were obtained through small-animal PET imaging with 18F-FDG, 18F-peripheral benzodiazepine receptor (18F-PBR), and 18F-florbetapir (18F-AV45), respectively. Baseline scans were acquired at 6–7 wk of age and follow-up scans at 4, 7, and 12 mo. 18F-AV45 uptake was measured at 8 and 13 mo of age. After the final scans, histologic measures of amyloid-β (4G8), microglia (ionized calcium binding adaptor molecule 1), astrocytes (glial fibrillary acidic protein), and neuronal nuclei were performed. Results: TG mice demonstrated significant age-associated increases in 18F-AV45 uptake. An effect of treatment was observed in the cortex (P = 0.0014), hippocampus (P = 0.0005), and thalamus (P < 0.0001). Histology confirmed reduction of amyloid-β pathology in TG-BACE mice. Regardless of treatment, TG mice demonstrated significantly lower 18F-FDG uptake than WT mice in the thalamus (P = 0.0004) and hippocampus (P = 0.0332). Neuronal nucleus staining was lower in both TG groups in the thalamus and cortex. 18F-PBR111 detected a significant age-related increase in TG mice (P < 0.0001) but did not detect the treatment-induced reduction in activated microglia as demonstrated by histology. Conclusion: Although 18F-FDG, 18F-PBR111, and 18F-AV45 all detected pathologic alterations between TG and WT mice, only 18F-AV45 could detect an effect of BACE inhibitor treatment. However, changes in WT binding of 18F-AV45 undermine the specificity of this effect.
Alzheimer disease is a progressive neurodegenerative disease pathologically characterized by amyloid-β plaques, neurofibrillary tangles, inflammation, and neuronal loss (1). Molecular imaging techniques such as PET are powerful tools to noninvasively monitor these pathologic features and are equally applicable in humans and animal models. Amyloid plaques are imaged using PET tracers, such as 18F-florbetapir (18F-AV45), which bind to the β-pleated sheet structure in these deposits (2). Inflammation can be assessed using agents targeting the mitochondrial membrane 18-kDa translocator protein (3), and the glucose analog 18F-FDG is used as a surrogate marker of neural activity to monitor neuronal loss (4).
Being noninvasive, PET enables repeated measures of animals at baseline and continually during disease and treatment, thus presenting an ideal drug-screening tool with high translatability to the clinic. The objective of this study was to investigate the effects of chronic administration of a β-site amyloid precursor protein (APP)–cleaving enzyme (BACE) inhibitor (JNJ-49146981) (5) on Alzheimer disease–related pathology by multitracer small-animal PET imaging in transgenic APPPS1-21 (TG) mice. The amyloidogenic pathway is initiated through proteolytic processing of amyloid precursor protein by BACE1. Inhibition of BACE1 activity by genetic (6–8) or pharmacologic (9–13) means strongly supports a therapeutic benefit demonstrating reductions in amyloid-β levels and rescued cognitive deficits in animal models, and several clinical trials of BACE inhibitors are under way (14). TG mice recapitulate certain features of Alzheimer disease, including amyloid-β deposition, gliosis, loss of dendritic spines, and cognitive deficits (15–17). Wild-type (WT) and TG mice underwent treatment with vehicle or BACE inhibitor, and outcome measures of amyloid pathology, brain function, and neuroinflammation were obtained through small-animal PET imaging with 18F-FDG, 18F-peripheral benzodiazepine receptor (18F-PBR) 1, and 18F-AV45, respectively. Although the effects of an antiamyloid antibody (18) and a γ-secretase modulator (19) have been previously evaluated with small-animal PET imaging, to our knowledge this is the first report of small-animal PET monitoring of BACE inhibition.
MATERIALS AND METHODS
Animals
Animals were treated in accordance with the European Ethics Committee (decree 86/609/CEE) with the approval of the local Animal Experimental Ethical Committee of the University of Antwerp, Belgium (2014-65). The animals were group-housed, 7 per cage, under environmentally controlled conditions (12-h light–dark cycle, 20°C–24°C, and 40%–70% relative humidity) in individually ventilated cages with food (ssniff R/M-H; Bio Services) and water ad libitum. TG mice coexpress the human Swedish double amyloid precursor protein mutation KM670/671NL and the human mutated PS1 L166P driven by the neuron-specific Thy-1 promoter. Aβ deposition begins as early as 6 wk of age, but no mature tau tangles are formed (15). Also, activated microglia surrounding the deposits, as well as increased astrogliosis, are present at 6 wk (15). Age-matched C57BL/6 littermates were used as controls. All mice (n = 112) were female and were received in kind from Janssen Pharmaceutica NV.
Treatment
JNJ-49146981 was synthesized at Janssen Pharmaceutica as described in patent literature (5). The chemical structure of JNJ-49146981 is shown in Supplemental Fig. 1 (supplemental materials are available at http://jnm.snmjournals.org). JNJ-49146981 is a potent brain-penetrating BACE inhibitor with a half-maximal inhibitory concentration of 4.6 nM in an enzymatic BACE1 assay and 0.9 nM in a cellular assay measuring reduction in Aβ42 levels (20). Further pharmacokinetic details are provided in the supplemental materials.
TG mice (n = 56) and their WT littermates (n = 56) were randomly divided into 2 groups to receive either the BACE inhibitor (60 mg/kg) or vehicle treatment, resulting in 4 groups of 28 mice each: WT-VEH, WT-BACE, TG-VEH, and TG-BACE. Vehicle mice received a 40% Captisol (Cydex Pharmaceuticals) solution, prepared by dissolving 40 g of Captisol in 100 mL of sterile water. BACE inhibitor solution was prepared by dissolving 60 mg of the active compound in 0.5 mL of 1N acetic acid, 5 mL of 40% Captisol solution, and 4.5 mL of sterile water. Both treatments were initiated at 7 wk of age and applied daily (for ∼12 mo) via oral gavage with a stainless steel feeding tube (20 gauge × 38 mm; Instech Laboratories).
Image Acquisition and Processing
An 18- to 19-MBq injection of radiotracer was administered through the tail vein (maximum volume, 200 μL) to awake mice. Before scanning, the animals were anesthetized by inhalation of isoflurane (5% for induction; 2% for maintenance during preparation and scanning) supplemented with oxygen. The following imaging protocols were used, depending on the radiotracer: a 45-min uptake period followed by a 20-min scan for 18F-FDG, a 40-min uptake period and 20-min scan for 18F-PBR111, and a 30-min uptake period and 20-min scan for 18F-AV45. The animals were awake during the uptake period. For 18F-FDG, the animals were kept fasting overnight (10–14 h) before scanning, and plasma glucose levels were measured using a blood glucose meter (One Touch Ultra 2; LifeScan) immediately before tracer injection.
Tracer Radiosynthesis
18F-AV45 was synthesized from the tosyloxy precursor AV-105 by modification of the method described by Yao et al. (21) on a FluorSynthon I synthesis module (Comecer Netherlands) that was adapted for fully automated production of 18F-AV45. 18F-FDG was prepared using a cassette-based FASTlab synthesis module (GE Healthcare) and was diluted with 0.9% NaCl for injection. 18F-PBR111 was prepared from the p-toluenesulfonyl precursor using automated methods on a Tracerlab FXFN (GE Healthcare) by adapting a previously described procedure (22).
PET Imaging and Analysis
All PET imaging was performed in a head-to-head configuration. The respiration rate and body temperature of the animal were constantly monitored during the entire scanning period. The core body temperature was maintained by flowing heated air through the imaging cell. PET imaging was performed using an Inveon PET/CT scanner (Siemens Preclinical Solutions) (23). The scanner uses 1.59 × 1.59 × 10 mm lutetium oxyorthosilicate crystals grouped into blocks of 20 × 20 crystals. The energy and timing window were set to 350–650 keV and 3.432 ns, respectively. The PET images were reconstructed using 2-dimensional ordered subset expectation maximization (24) with 4 iterations and 16 subsets after Fourier rebinning (25). Corrections were applied for normalization, dead time, randoms, CT-based attenuation, and single-scatter simulation, as developed by Watson et al. (26). PET images were reconstructed on a 128 × 128 × 159 grid with a pixel size of 0.776 mm and a slice thickness of 0.796 mm. CT imaging was done using a 220° rotation with 120 rotation steps. Voltage and amperage were set to 80 keV and 500 μA, respectively. The CT images were reconstructed using the Feldkamp filtered-backprojection algorithm.
Image Processing
Images were processed using PMOD software (version 3.6; PMOD Technologies). Each individual PET image was transformed into the space of a predefined mouse brain template (27) by matching the individual CT images to the CT images of the template and applying the same transformation to the subject’s PET images. These spatially normalized images were then analyzed using an MRI mouse whole-brain volume-of-interest template (27) available in the same software package and a priori coregistered to the mouse brain CT template. Volume-of-interest statistics in kBq/cm3 were generated in the cortex, thalamus, and hippocampus and used to calculate the SUV (average tissue activity concentration [kBq/cm3]/injected dose [kBq]/body weight [g]) for 18F-PBR111 and 18F-AV45 imaging data. SUVs were corrected for blood glucose levels (SUVglc, mg/dL) for the 18F-FDG imaging data.
Immunohistochemistry
Staining was performed with 4G8, ionized calcium–binding adaptor molecule 1 (Iba-1), glial fibrillary acidic protein (GFAP), and neuronal nuclei (NeuN).
The mice were sacrificed by decapitation, after which the brains were removed from the skull, fixed overnight in a formalin-based fixative, embedded in paraffin, and sliced (5 μm) with a microtome. Sections were dewaxed with xylene and rehydrated by submerging in a graded series of ethanol with decreasing concentrations. For sections to be stained with the 4G8 antibody, antigen was retrieved in 70% formic acid (diluted in distilled water). For sections to be stained for NeuN and GFAP, heat-induced antigen retrieval was performed in citrate buffer (pH 6.0). For all sections, endogenous peroxidase activity was blocked with 3% hydrogen peroxide. Samples were incubated for 1 h with primary antibodies (Table 1) in antibody diluent with background-reducing components (DAKO). After extensive washing, peroxidase-labeled antimouse secondary antibody (Envision; DAKO) was applied for 30 min, followed by chromogenic labeling with 3,3-diaminobenzidine (DAKO). The slides were counterstained with hematoxylin, dehydrated, and permanently mounted (Vectamount; Vector Labs).
Number of Animals in Each Treatment Group Scanned at Each Time Point
Imaging was performed with a NanoZoomer slide scanner (Hamamatsu Photonics) and analyzed with Matlab/Phaedra. Regions of interest were manually delineated in accordance with the Franklin and Paxinos atlas (28), and for each region of interest the percentage of 3,3-diaminobenzidine–labeled area per total area was calculated. For microglia (Iba1), two thresholds were defined, one including total Iba1 labeling (resting + activated microglia) and one taking only activated microglia into account (Supplemental Fig. 2).
Statistical Analysis
Statistical analysis was conducted in JMP Pro (version 12; SAS Institute Inc.) and GraphPad Prism (version 6; GraphPad Software). We used a linear mixed model to investigate the relationship between tracer uptake and genotype, age, and treatment. Age, genotype, and treatment were investigated as fixed effects, and mouse identification number was incorporated as a random intercept to model subject-specific responses. We additionally tested for genotype × age and between genotype × treatment interactions in this model. A quadratic age variable (age2) was included in the analysis of 18F-FDG to account for a curvilinear response. The correlation between small-animal PET data and ex vivo histology was analyzed using Pearson correlation. Histology was analyzed with either a 2-way ANOVA or an unpaired Student or Welch t test. The Cohen d statistic was calculated to compare effect sizes between histologic and PET measures of microglia and amyloid burden in TG-VEH and TG-BACE mice. Significance levels are given to 4 decimal points.
RESULTS
Animals
During the study, 1 WT-VEH mouse was euthanized because of body weight issues. In addition, 6 TG-BACE mice, 8 TG-VEH mice, and 1 WT-BACE mouse died spontaneously. The number of animals in each treatment group for every time point is shown in Table 1. BACE-treated animals developed hair depigmentation manifesting as gray patches of fur, as has been previously described (29).
18F-AV45 Imaging
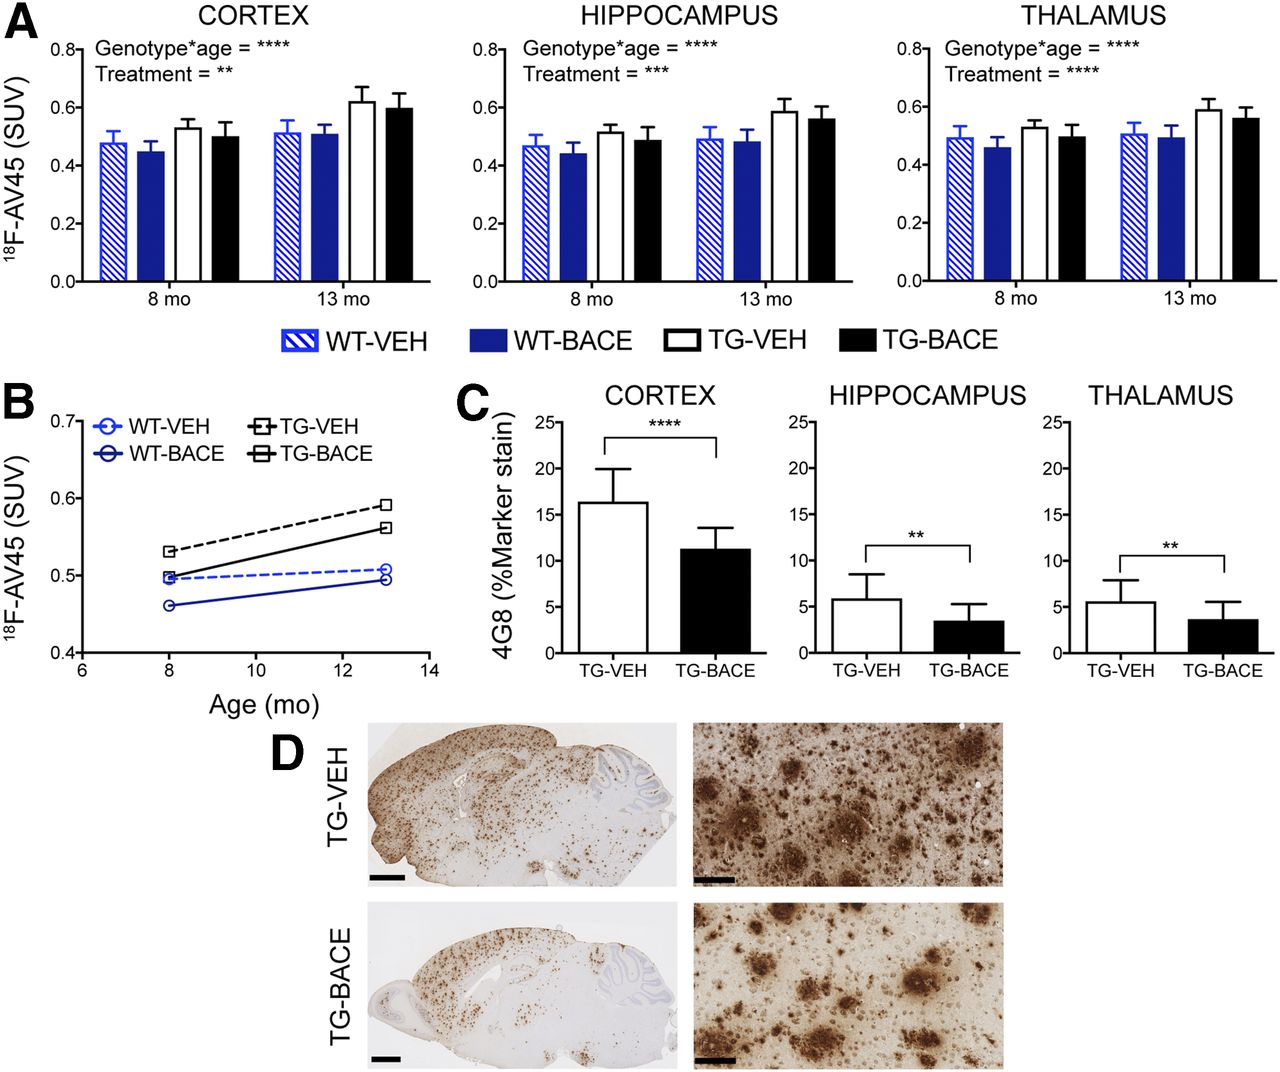
Figure 1 shows the average 18F-AV45 uptake per animal group at 8 and 13 mo. Graphical analysis of 18F-AV45 uptake is shown in Figures 2A and 2B. A significant interaction of genotype × age on 18F-AV45 was detected in the cortex, thalamus, and hippocampus (all P < 0.0001), resulting from increasing 18F-AV45 uptake from 8 to 13 mo. A significant effect of treatment was observed in the cortex (P= 0.0014), thalamus (P < 0.0001), and hippocampus (P = 0.0005). A genotype × treatment interaction was not observed.
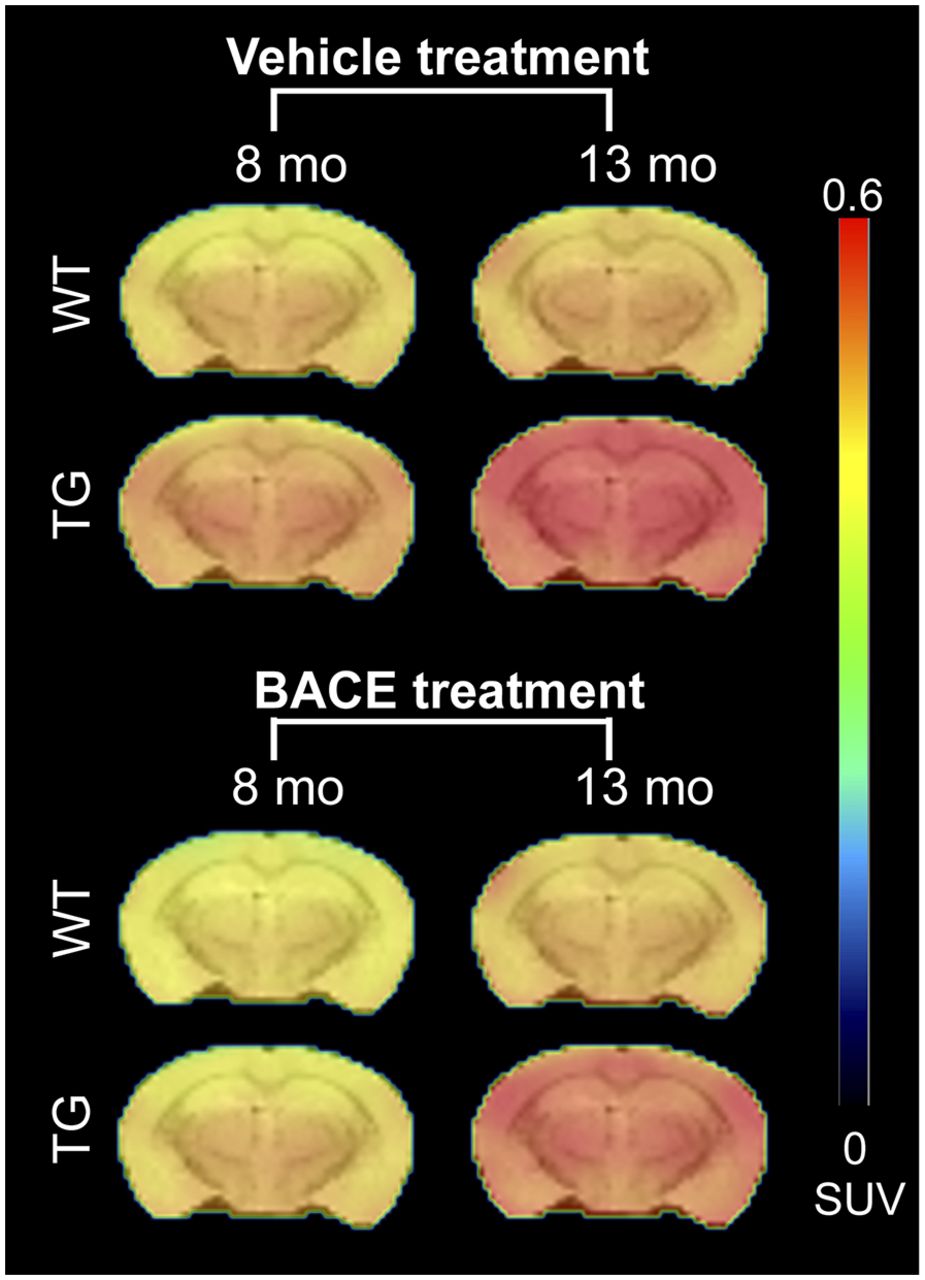
Average PET images of 18F-AV45 uptake in all animal groups, overlaid on MRI T2 template for anatomic reference.

Progression of 18F-AV45 uptake and its relationship to 4G8 staining. (A) 18F-AV45 uptake (mean + SD) in cortex, hippocampus, and thalamus. (B) Longitudinal trajectory of mean 18F-AV45 uptake in thalamus. (C) 4G8 staining for amyloid-β (mean + SD) in cortex, hippocampus, and thalamus. (D) Representative images of 4G8 staining in TG mice. Scale bar = 1.25 mm (left) and 100 μm (right: cortex). *P < 0.05; **P < 0.01; ***P < 0.001; ****P < 0.0001.
4G8 staining demonstrated a clear reduction in plaque load in TG-BACE mice, as shown in Figure 2C. This reduction was significant in the cortex (P < 0.0001, Cohen d = 1.7166), thalamus (P = 0.0043, Cohen d = 0.9302), and hippocampus (P = 0.0016, Cohen d = 1.8255). Minimal plaque staining was observed in the cerebellum of TG mice. There was a moderate positive correlation between 4G8 staining and 18F-AV45 uptake (r = 0.4686, P < 0.0001). Representative images of 4G8 staining in TG mice are shown in Figure 2D. The effect sizes for differences in 18F-AV45 uptake between TG-VEH and TG-BACE mice at 13 mo were lower than those detected with histology, with Cohen d = 0.4742, 0.8168, and 0.6585 for the cortex, thalamus, and hippocampus, respectively.
18F-FDG Imaging
Figure 3 shows the average 18F-FDG uptake per animal group for each time point, and graphical analysis of 18F-FDG uptake is shown in Figures 4A and 4B. Age had a significant linear (P < 0.0001) and quadratic (P < 0.0001) effect on 18F-FDG in all regions, supporting an age-related increase in tracer uptake that becomes less pronounced with time. Genotype had a significant main effect on 18F-FDG uptake in the thalamus (P = 0.0004) and hippocampus (P = 0.0332), with TG mice demonstrating lower 18F-FDG uptake in these regions than WT mice. No genotype × age or genotype × age2 interaction was found, showing that age-related changes in 18F-FDG uptake were not affected by genotype. No effect of treatment and no genotype × treatment interaction were found, indicating that BACE treatment did not influence 18F-FDG uptake.
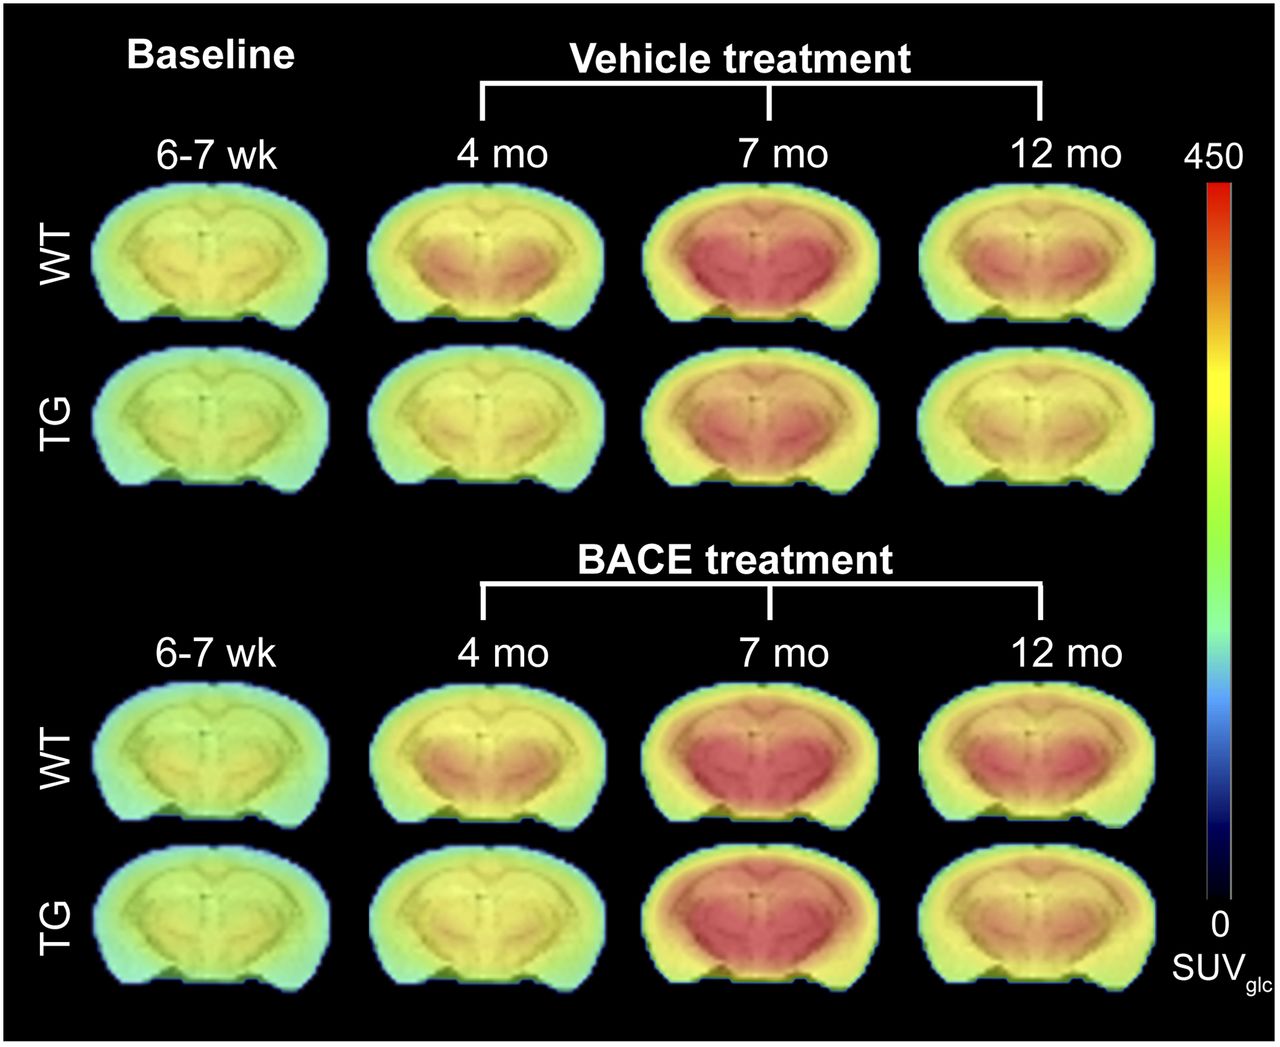
Average PET images of 18F-FDG uptake in all animal groups, overlaid on MRI T2 template for anatomic reference.
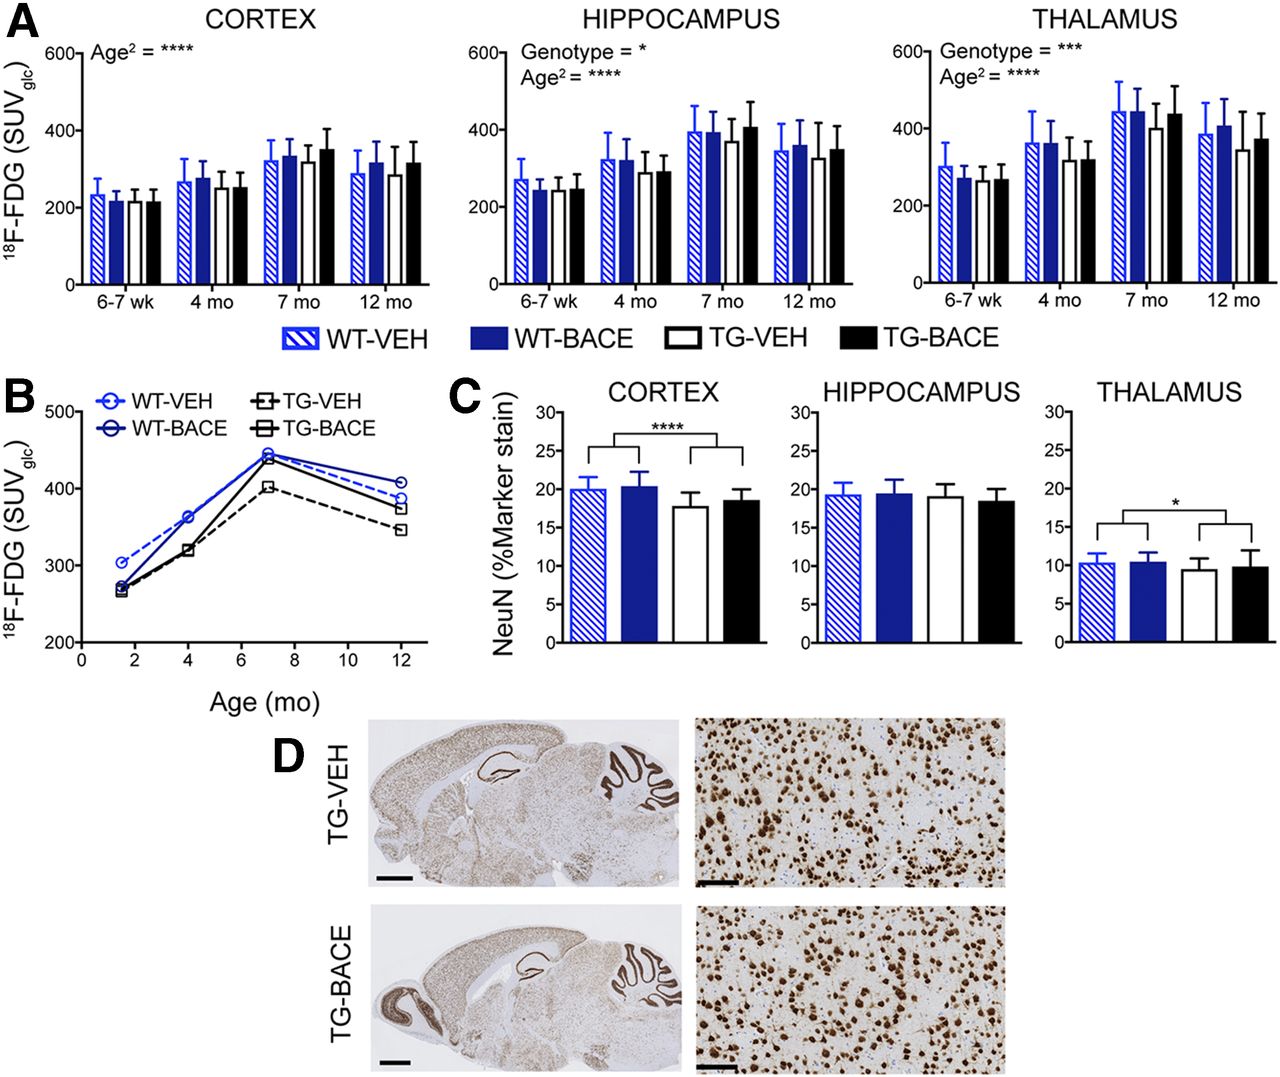
Progression of 18F-FDG uptake and its relationship to reduced NeuN staining. (A) 18F-FDG uptake (mean + SD) in cortex, hippocampus, and thalamus. (B) Longitudinal trajectory of mean 18F-FDG uptake in thalamus. (C) NeuN staining for neuronal nuclei (mean + SD) in cortex, hippocampus, and thalamus. (D) Representative images of NeuN staining in TG mice. Scale bar = 1.25 mm (left) and 100 μm (right: cortex). *P < 0.05; **P < 0.01; ***P < 0.001; ****P < 0.0001.
As shown in Figure 4C, TG mice demonstrated lower NeuN staining, and genotype was found to have a significant effect in the cortex (P < 0.0001) and thalamus (P = 0.0160). A weak negative relationship was found between 18F-FDG uptake and NeuN staining in TG mice (r = −0.2219, P = 0.0136). Representative images of NeuN staining in TG mice are shown in Figure 4D.
18F-PBR111 Imaging
Figure 5 shows the average 18F-PBR111 uptake per animal group for each time point. Graphical analysis of 18F-PBR111 uptake is shown in Figures 6A and 6B. A significant genotype × age interaction was detected in all brain regions, with TG mice demonstrating increased 18F-PBR111 uptake with age (P < 0.0001). No effect of treatment was detected.
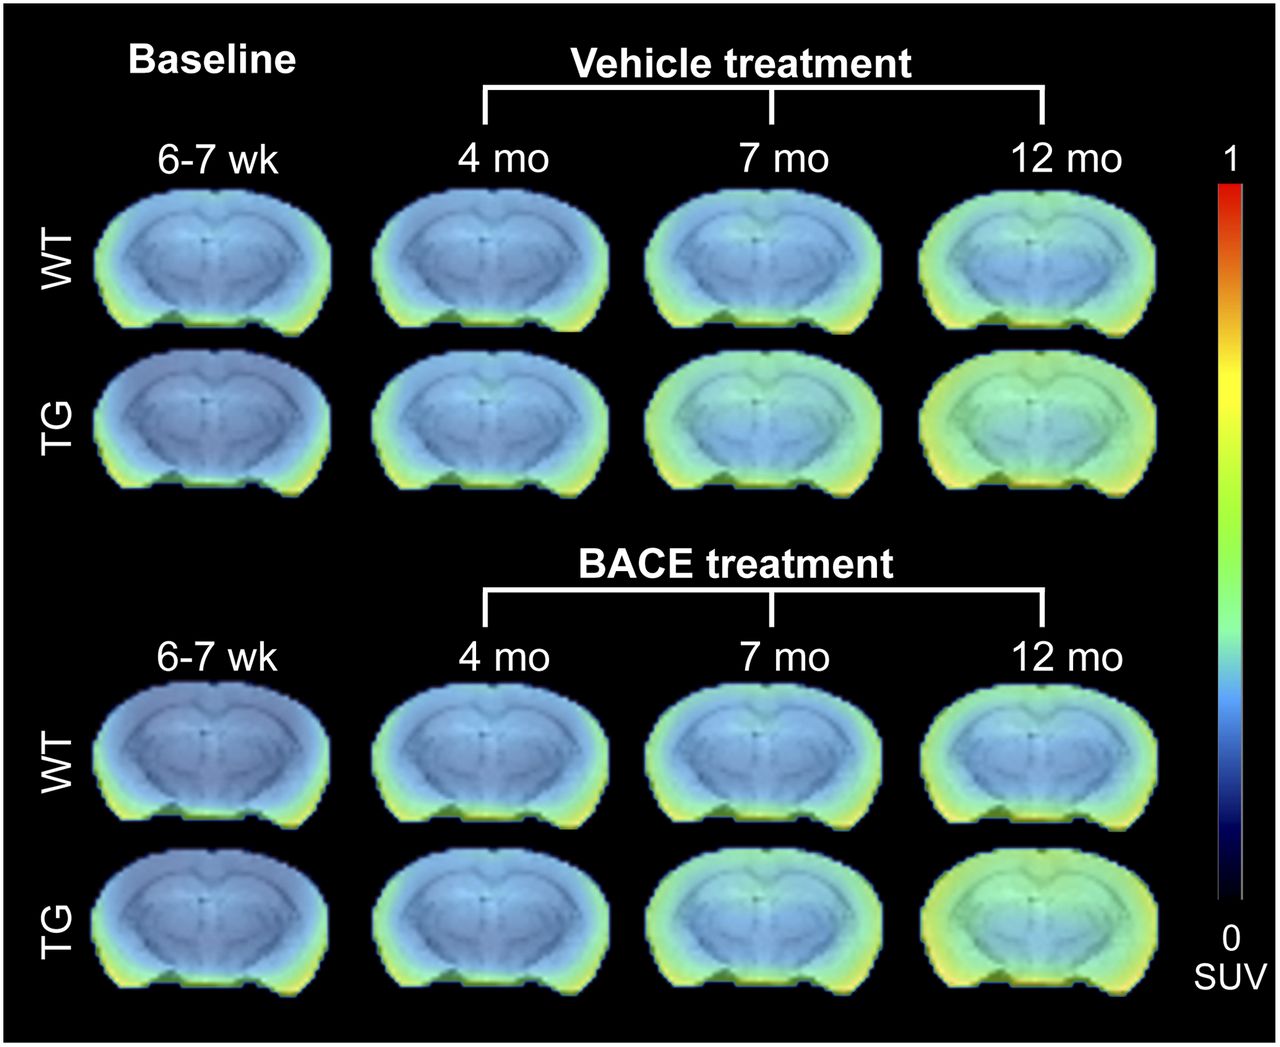
Average PET images of 18F-PBR111 uptake in all animal groups, overlaid on MRI T2 template for anatomic reference.
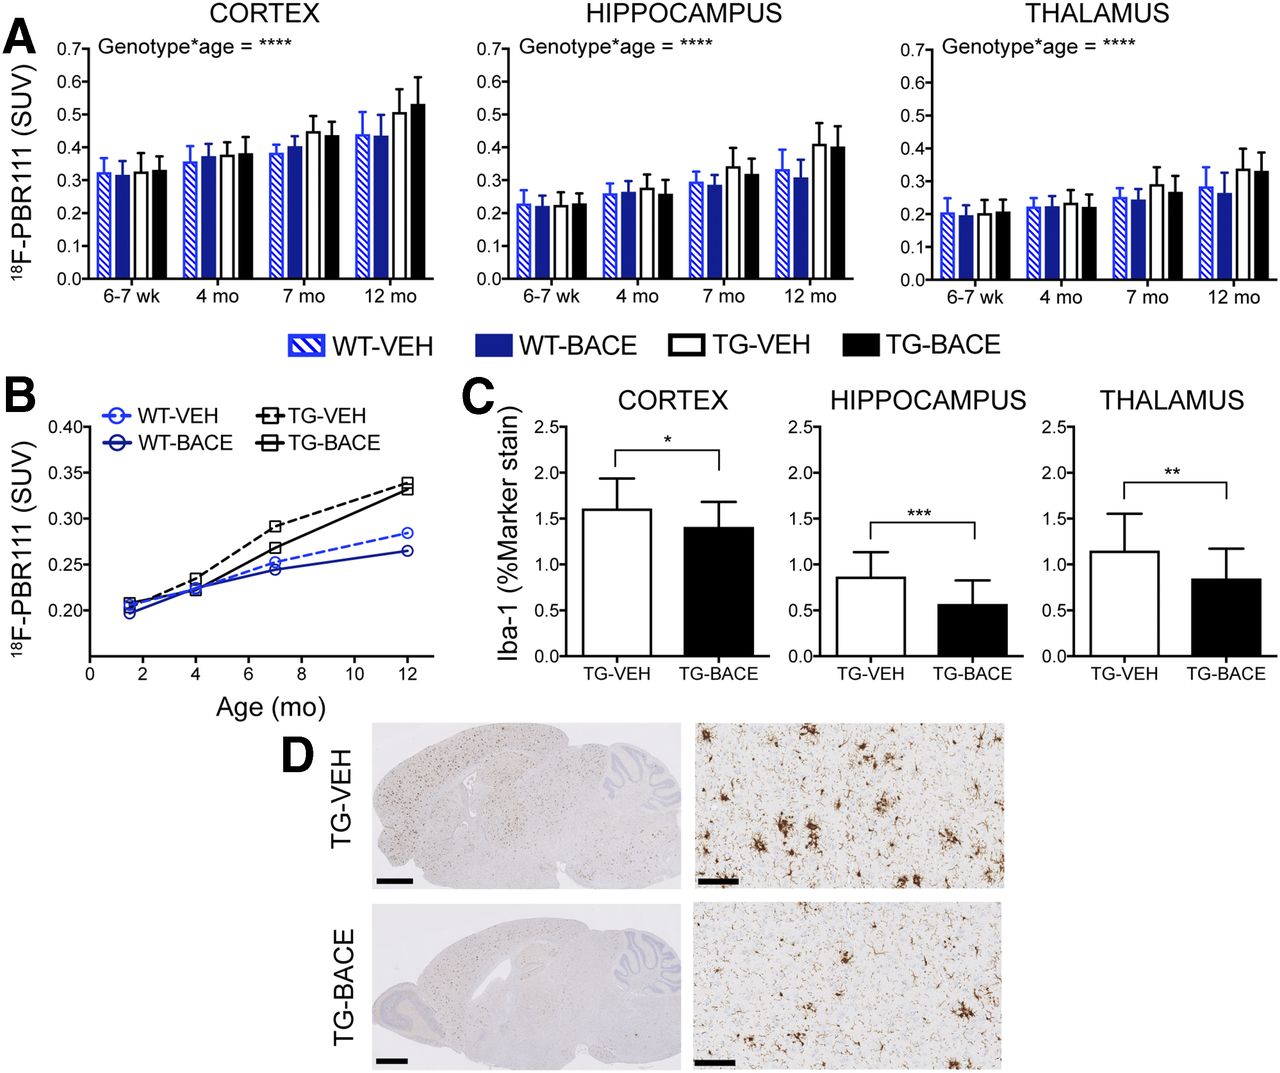
Progression of 18F-PBR111 uptake and its relationship to Iba-1 staining. (A) 18F-PBR111 uptake (mean + SD) in cortex, hippocampus, and thalamus. (B) Longitudinal trajectory of mean 18F-PBR111 uptake in thalamus. (C) Iba-1 staining for microglia (mean + SD) in cortex, hippocampus, and thalamus. (D) Representative images of Iba-1 staining in TG mice. Scale bar = 1.25 mm (left) and 100 μm (right: cortex). *P < 0.05; **P < 0.01; ***P < 0.001; ****P < 0.0001.
The TG groups did not differ in total number of microglia (Supplemental Fig. 3). When resting microglia were excluded from Iba-1 analysis, TG-BACE demonstrated a significantly lower number of activated microglia in the cortex (P = 0.0353, Cohen d = 0.6670), thalamus (P = 0.0096, Cohen d = 0.8359), and hippocampus (P = 0.0006, Cohen d = 1.1419) than TG-VEH mice (Fig. 6C). 18F-PBR111 demonstrated a low positive correlation with ex vivo Iba-1 measurements of activated microglia (r = 0.3435, P < 0.0001). Representative images of Iba-1 staining in TG mice are shown in Figure 6D. The effect sizes for differences in 18F-PBR111 uptake between TG-VEH and TG-BACE mice at 12 mo were considerably lower than those shown by histology, with Cohen d = 0.1254 and 0.1941 for the thalamus and hippocampus, respectively. GFAP levels were significantly higher in TG-VEH mice than TG-BACE mice in the cortex (P = 0.0318), thalamus (P = 0.0245), and hippocampus (P = 0.0318) (Supplemental Fig. 4A). 18F-PBR111 uptake demonstrated a weak negative correlation with GFAP staining (r = −0.1275, P = 0.1549) (Supplemental Fig. 4B).
DISCUSSION
In this study, we investigated the effects of chronic administration of a BACE inhibitor on Alzheimer disease–related pathology by multitracer small-animal PET imaging in TG mice.
18F-AV45 has been implemented in animal models to monitor changes in amyloid pathology with age (30,31). It has been shown that other amyloid tracers, such as 11C-PiB and 18F-florbetaben, are capable of detecting a treatment effect with amyloid-modulating therapies in transgenic mouse models (18,19). 18F-AV45 uptake was higher in TG mice and increased with age. A treatment effect was observed; however, it was not specific to TG mice. At 8 mo, 18F-AV45 uptake in WT-BACE mice was lower than that in WT-VEH mice. These findings are anomalous, as WT mice do not develop plaque pathology. 18F-AV45 demonstrates high nonspecific binding; for this reason, normalization of regional tracer uptake to a reference region is recommended. Although the cerebellum in TG mice displayed minimal plaque pathology, 18F-AV45 uptake was higher in TG mice than WT mice, and cerebellum thus could not be used as a reference region. The significant genotypic differences in 18F-AV45 uptake in TG mice in this study contrast with our previous investigation, which did not find significant differences in 18F-AV45 uptake in 12-mo-old TG mice. This difference is likely attributable to the higher number of animals in the current study (32).
Replication of the hypometabolic phenotype with small-animal imaging appears highly dependent on the animal model used. We previously demonstrated hypometabolism in 12-mo-old TG mice with in vivo 18F-FDG imaging, confirmed by ex vivo 14C-2-deoxyglucose autoradiography (32). Assuming that hypometabolism is a downstream consequence of amyloid-β pathology, we hypothesized that reductions in 18F-FDG in TG mice would worsen with increasing age and that lowering amyloid-β pathology would prevent or slow changes in brain metabolism. Although 18F-FDG uptake was significantly reduced in the thalamus and hippocampus of TG mice, 18F-FDG uptake actually increased with age. Takkinen et al. also performed a longitudinal investigation of 18F-FDG uptake in TG mice at 6, 12, and 15 mo of age. They similarly found reduced 18F-FDG uptake in TG mice in comparison to WT and an age-dependent increase in 18F-FDG uptake in both genotypes (33). In a previous longitudinal investigation of the double transgenic APPswe × PSI.MI46V mouse model, we also reported a lack of association between worsening amyloid-β pathology and reductions in 18F-FDG uptake (34). It is possible that the observed hypometabolism in these models is a result of neurodevelopmental changes induced by transgene expression and that, in this way, altered brain metabolism would be independent of changes in amyloid-β levels. Regarding the lack of treatment effect on 18F-FDG response, it should be noted that improvements in 18F-FDG uptake through amyloid-β reduction have not been demonstrated in human Alzheimer disease. Several approved symptomatic therapies, such as cholinesterase inhibitors, have been shown to influence 18F-FDG uptake in patients (35,36), and investigation of 18F-FDG as an outcome measure in response to such therapies in amyloid precursor protein models would provide further insight into the utility of this tracer as a preclinical biomarker. Moreover, 18F-FDG imaging detected age-dependent decreases in the tauopathy mouse model tauVLW (37) and thus may be more applicable in models with tau pathology. Because activated glial cells also take up 18F-FDG, we additionally investigated the relationship between 18F-FDG and inflammatory markers and found a weak negative relationship between in vivo 18F-FDG uptake and both Iba-1 and GFAP staining (Supplemental Figs. 5A and 5B). Because brain metabolism is the summation of numerous processes, an ex vivo correlate for 18F-FDG imaging is difficult. Here, we considered neuronal loss as a potential mechanism underlying hypometabolism. Regardless of treatment, TG mice demonstrated lower NeuN staining than WT mice. Given the trajectory of 18F-FDG uptake in TG mice and the lack of correlation between NeuN staining and 18F-FDG uptake, it is highly unlikely that neuronal loss mediates the observed hypometabolism. Quantification of NeuN staining was performed by a nonstereologic method, which has several limitations. Use of unbiased stereologic methods would have provided higher levels of sensitivity and accuracy in determining neuronal numbers (38).
The translocator protein radioligands 18F-GE180, 11C-PBR28, and 18F-DPA-714 have demonstrated age-related increases in PS2APP, APPPS1-d9, 5xFAD, and TG mouse models (33,39). Additionally, chronic BACE inhibitor treatment (NB-360) has previously been shown to reduce glial cells in APP51/16 mice (12), and thus we herein evaluated the ability of 18F-PBR111 to detect changes in neuroinflammation in response to disease and treatment. In this study, we found a significant genotype × age interaction on 18F-PBR111 uptake in the cortex, thalamus, and hippocampus, indicating the ability of this tracer to monitor worsening inflammation with disease progression. This finding agrees with a previous demonstration of age- and genotype-related increases in 18F-DPA-714 binding in TG mice (33). However, the correlation between 18F-PBR111 uptake and the microglial marker Iba-1 was only moderate, and in vivo imaging did not detect the reduction of activated microglia in BACE-treated TG mice demonstrated by histology. The poor sensitivity of 18F-PBR111 could be due to the release of 18F-fluoride during its metabolism (40), as uptake of 18F-fluoride by skull bone greatly complicates tracer quantification in brain tissue. Because activated astrocytes can also bind translocator protein radioligands, the poor correlation between Iba-1 and 18F-PBR111 could be due to astrocytic binding of 18F-PBR111. However, we found no correlation between GFAP staining and 18F-PBR111, indicating that activated microglia likely underlie the increased retention of 18F-PBR111 in TG mice. The translocator protein radioligands 18F-GE180 and 11C-PBR28 have demonstrated strong correlations with histologic measures of neuroinflammation, additionally demonstrated increased retention at young ages (5–6 mo) in transgenic mice (38,41), and may thus be more suitable for small-animal imaging.
Considering the multitracer and longitudinal design of the current study, we used static PET scans to minimize scan duration and anesthesia exposure. As a result, tracer uptake was quantified by semiquantitative methods, which have several drawbacks (42). However, absolute quantification or reference tissue modeling was not feasible given that the use of plasma-derived input functions is not possible for longitudinal studies and suitable region references were not available.
CONCLUSION
18F-AV45, 18F-FDG, and 18F-PBR111 detected pathologic differences between WT and TG mice. Only 18F-AV45 could detect a treatment-induced reduction in pathology. However, changes in WT binding of 18F-AV45 undermine the specificity of this effect. For 18F-FDG, it is highly unlikely that neuronal loss mediates the observed hypometabolism, and 18F-PBR111 was not sensitive enough to detect a treatment effect, likely because of radioactivity uptake in the skull bone.
DISCLOSURE
This work was funded by Antwerp University and its University Hospital, Antwerp, Belgium, through a postdoctoral research position for Steven Deleye, an assistant professor position for Leonie Wyffels and Jeroen Verhaeghe, an associate professor position for Steven Staelens, and a full professor position for Sigrid Stroobants. Ann-Marie Waldron is supported through an IWT scholarship (Agency for Innovation by Science and Technology). Astrid Bottelbergs, Xavier Langlois, and Mark Schmidt are with Janssen Pharmaceutica. No other potential conflict of interest relevant to this article was reported.
Acknowledgments
We thank Philippe Joye (Molecular Imaging Center Antwerp) and Caroline Berghmans for support with in vivo experiments, Dr. José Ignacio Andrés (Janssen Research and Development) for preparation of the AV-105 cold reference, Dr. Hilde Vermeirsch (Histogenex) for ex vivo validation processing, and Erik Franssen for statistical assistance.
Footnotes
Published online Jun. 13, 2017.
- © 2017 by the Society of Nuclear Medicine and Molecular Imaging.
REFERENCES
- Received for publication December 6, 2016.
- Accepted for publication May 31, 2017.


Jump to section
Related Articles
Cited By...
- Relationship between reactive astrocytes, by [18F]SMBT-1 imaging, with amyloid-beta, tau, glucose metabolism, and microgliosis in mouse models of Alzheimers disease
- Submillimeter-Resolution PET for High-Sensitivity Mouse Brain Imaging
- Longitudinal PET Monitoring of Amyloidosis and Microglial Activation in a Second-Generation Amyloid-{beta} Mouse Model
- Antibody-Based In Vivo PET Imaging Detects Amyloid-{beta} Reduction in Alzheimer Transgenic Mice After BACE-1 Inhibition