


Article Figures & Data
Figures
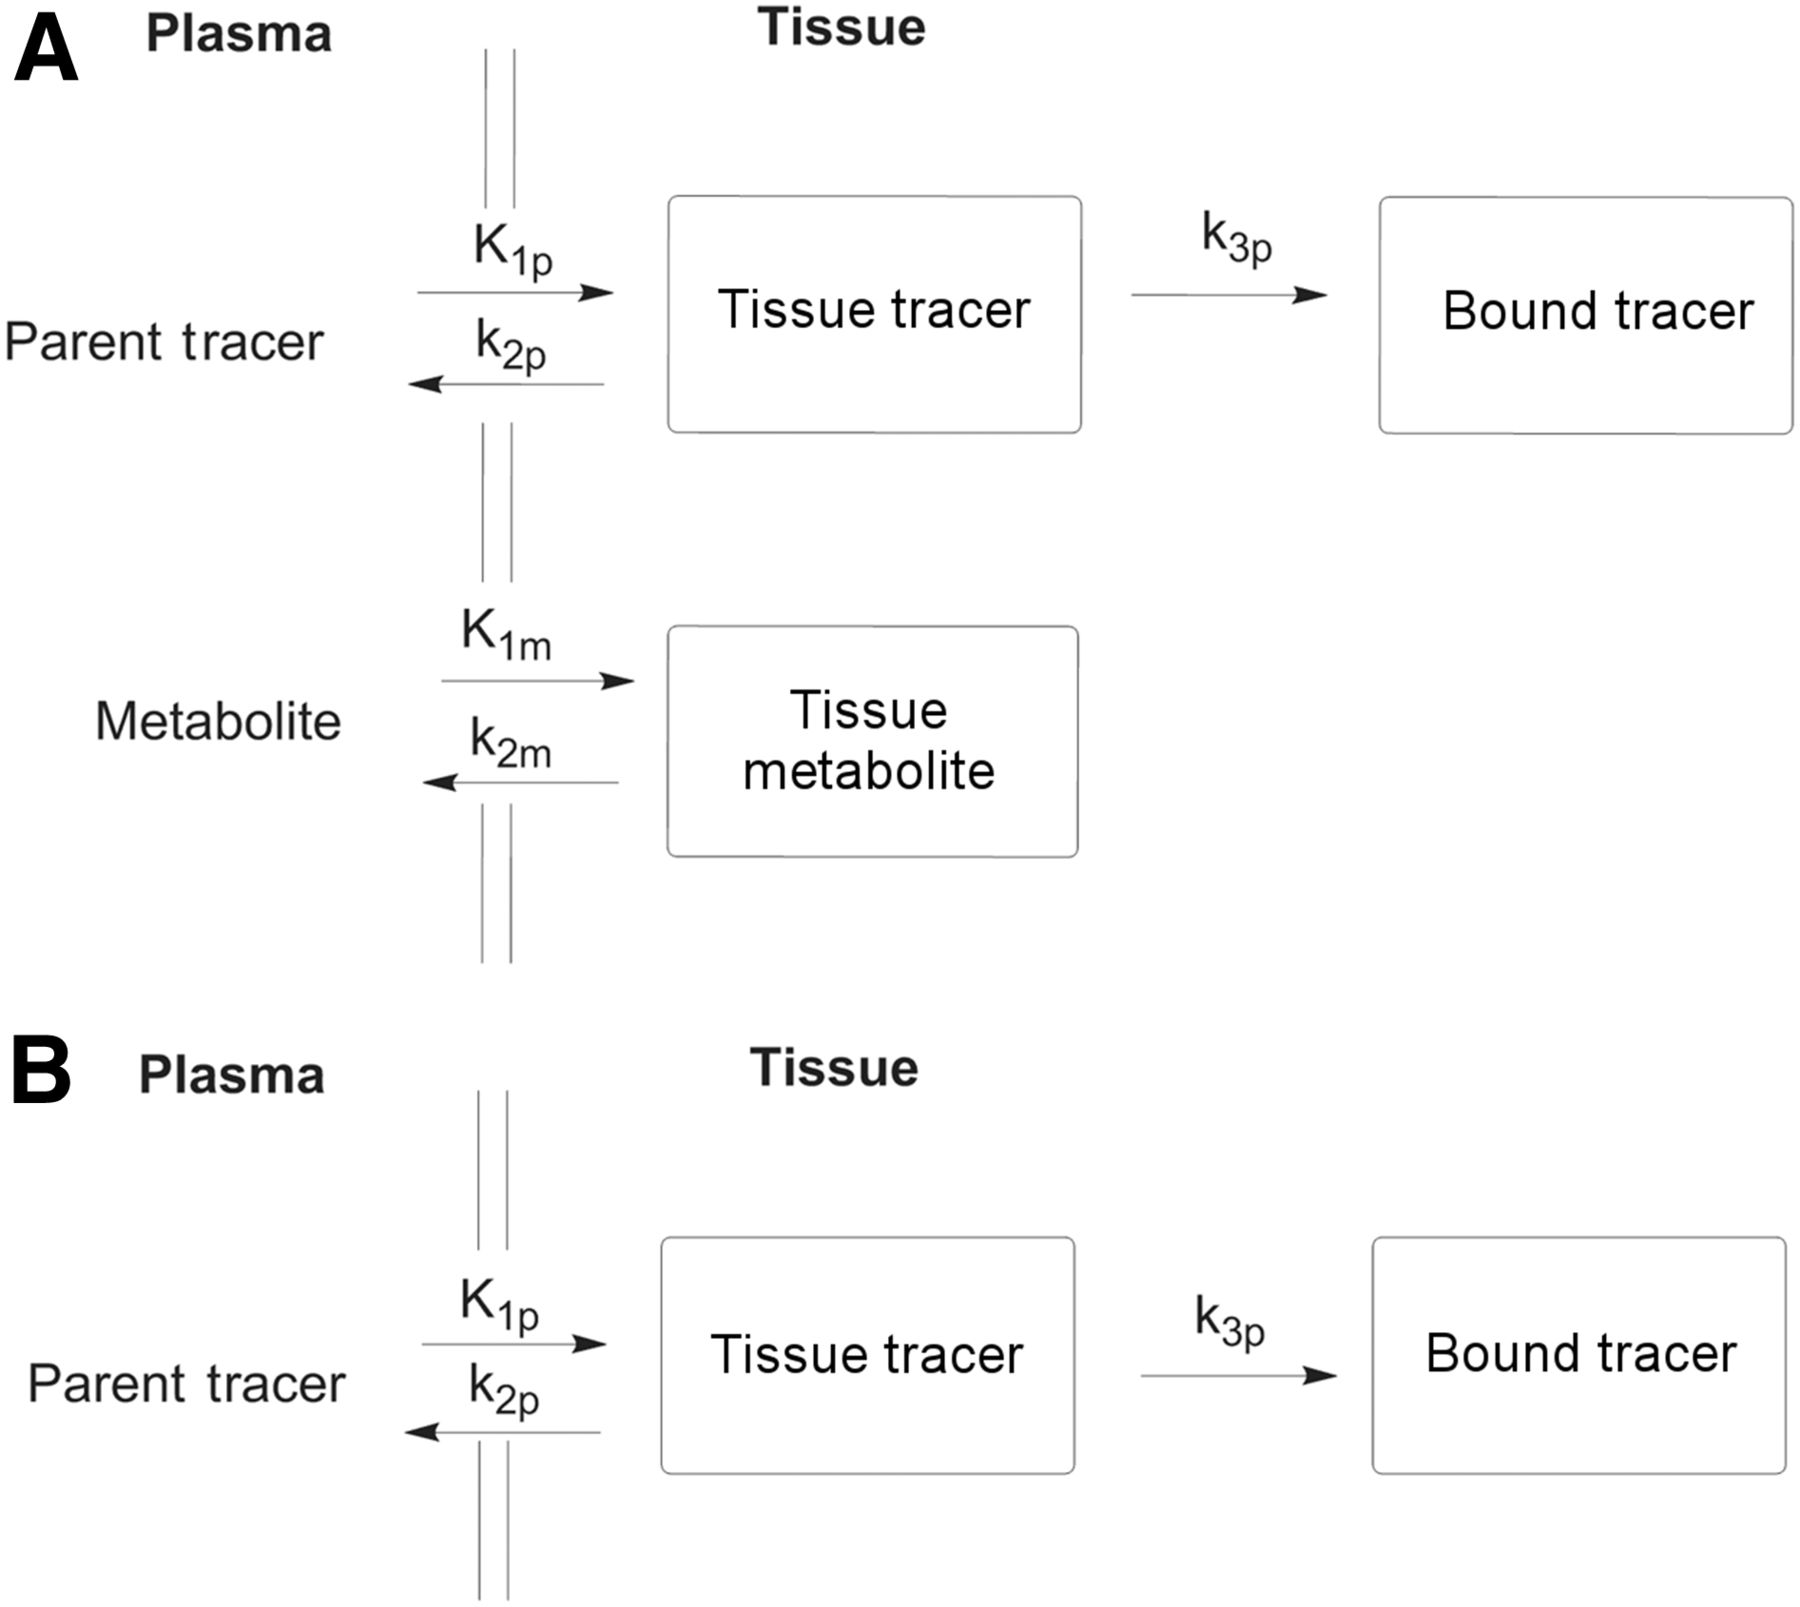
- FIGURE 1.
Compartmental models applied for 18F-FHNP kinetic analysis: irreversible 3TCM (A) and irreversible 2TCM (B). K1p = uptake constant of intact parent (mL/g/min); k2p = clearance rate of intact parent (1/min); k3p = selective binding of intact parent (1/min); K1m = uptake constant of metabolites (mL/g/min); k2m = clearance rate of metabolites (1/min).
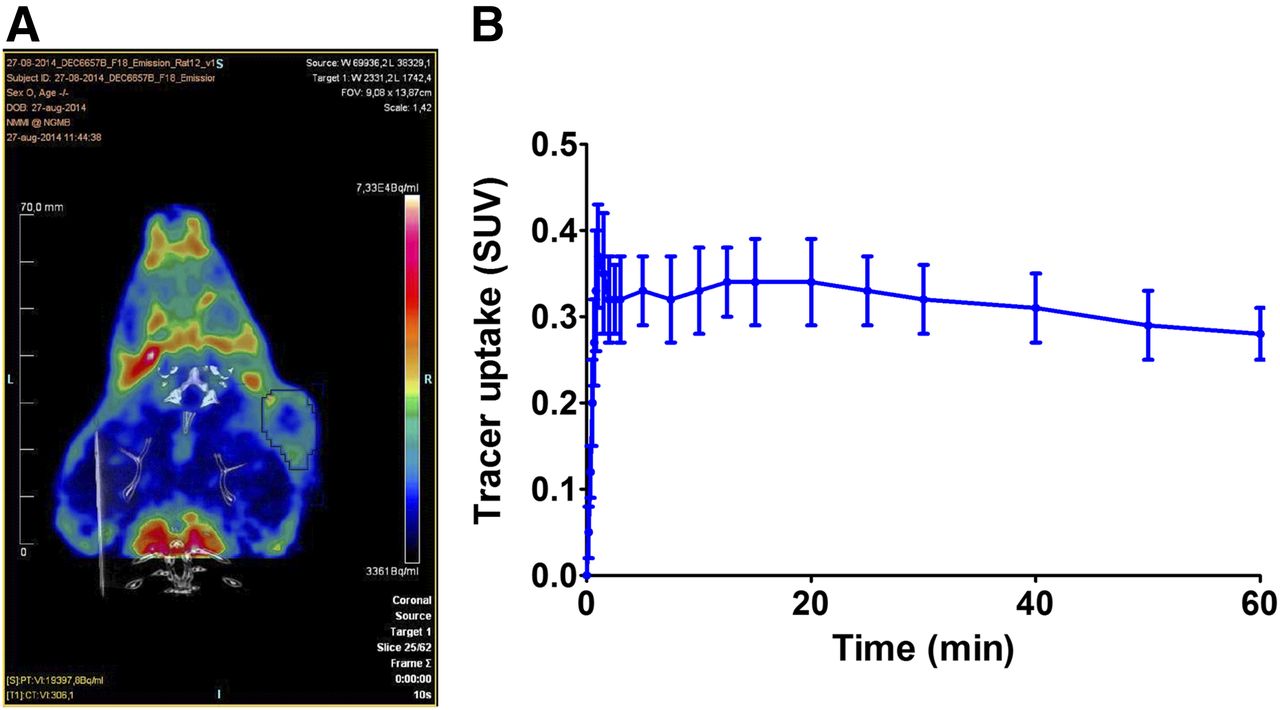
- FIGURE 2.
(A) Coronal small-animal PET/CT fusion images of rat bearing SKOV3 xenograft injected with 18F-FHNP (21.5 MBq). (B) Averaged time–activity curve of 18F-FHNP uptake in SKOV3 xenografts (n = 9).
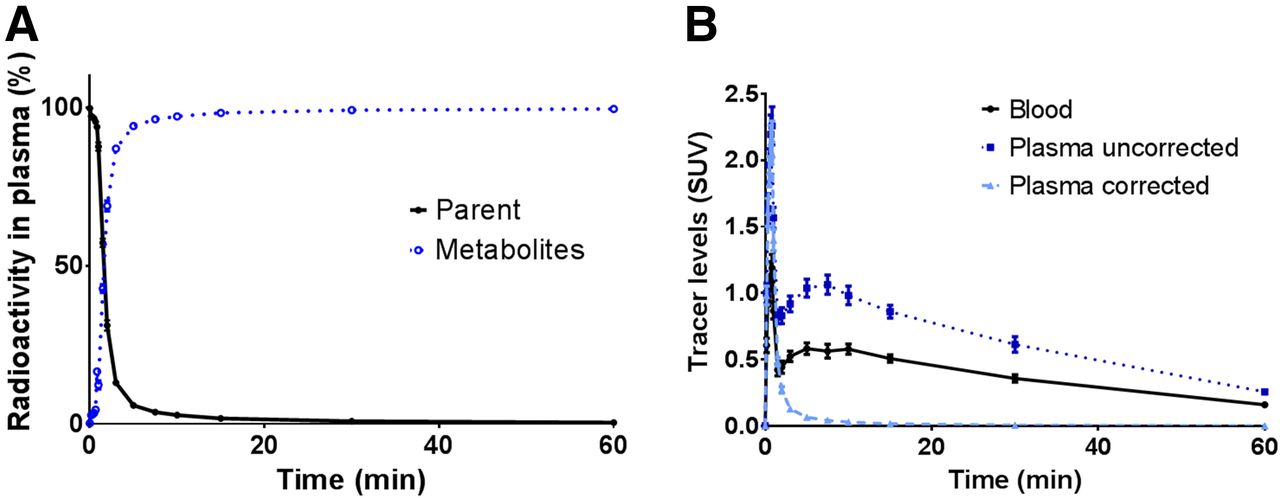
- FIGURE 3.
Metabolism (A) and metabolite-corrected (B) plasma curves for 18F-FHNP.
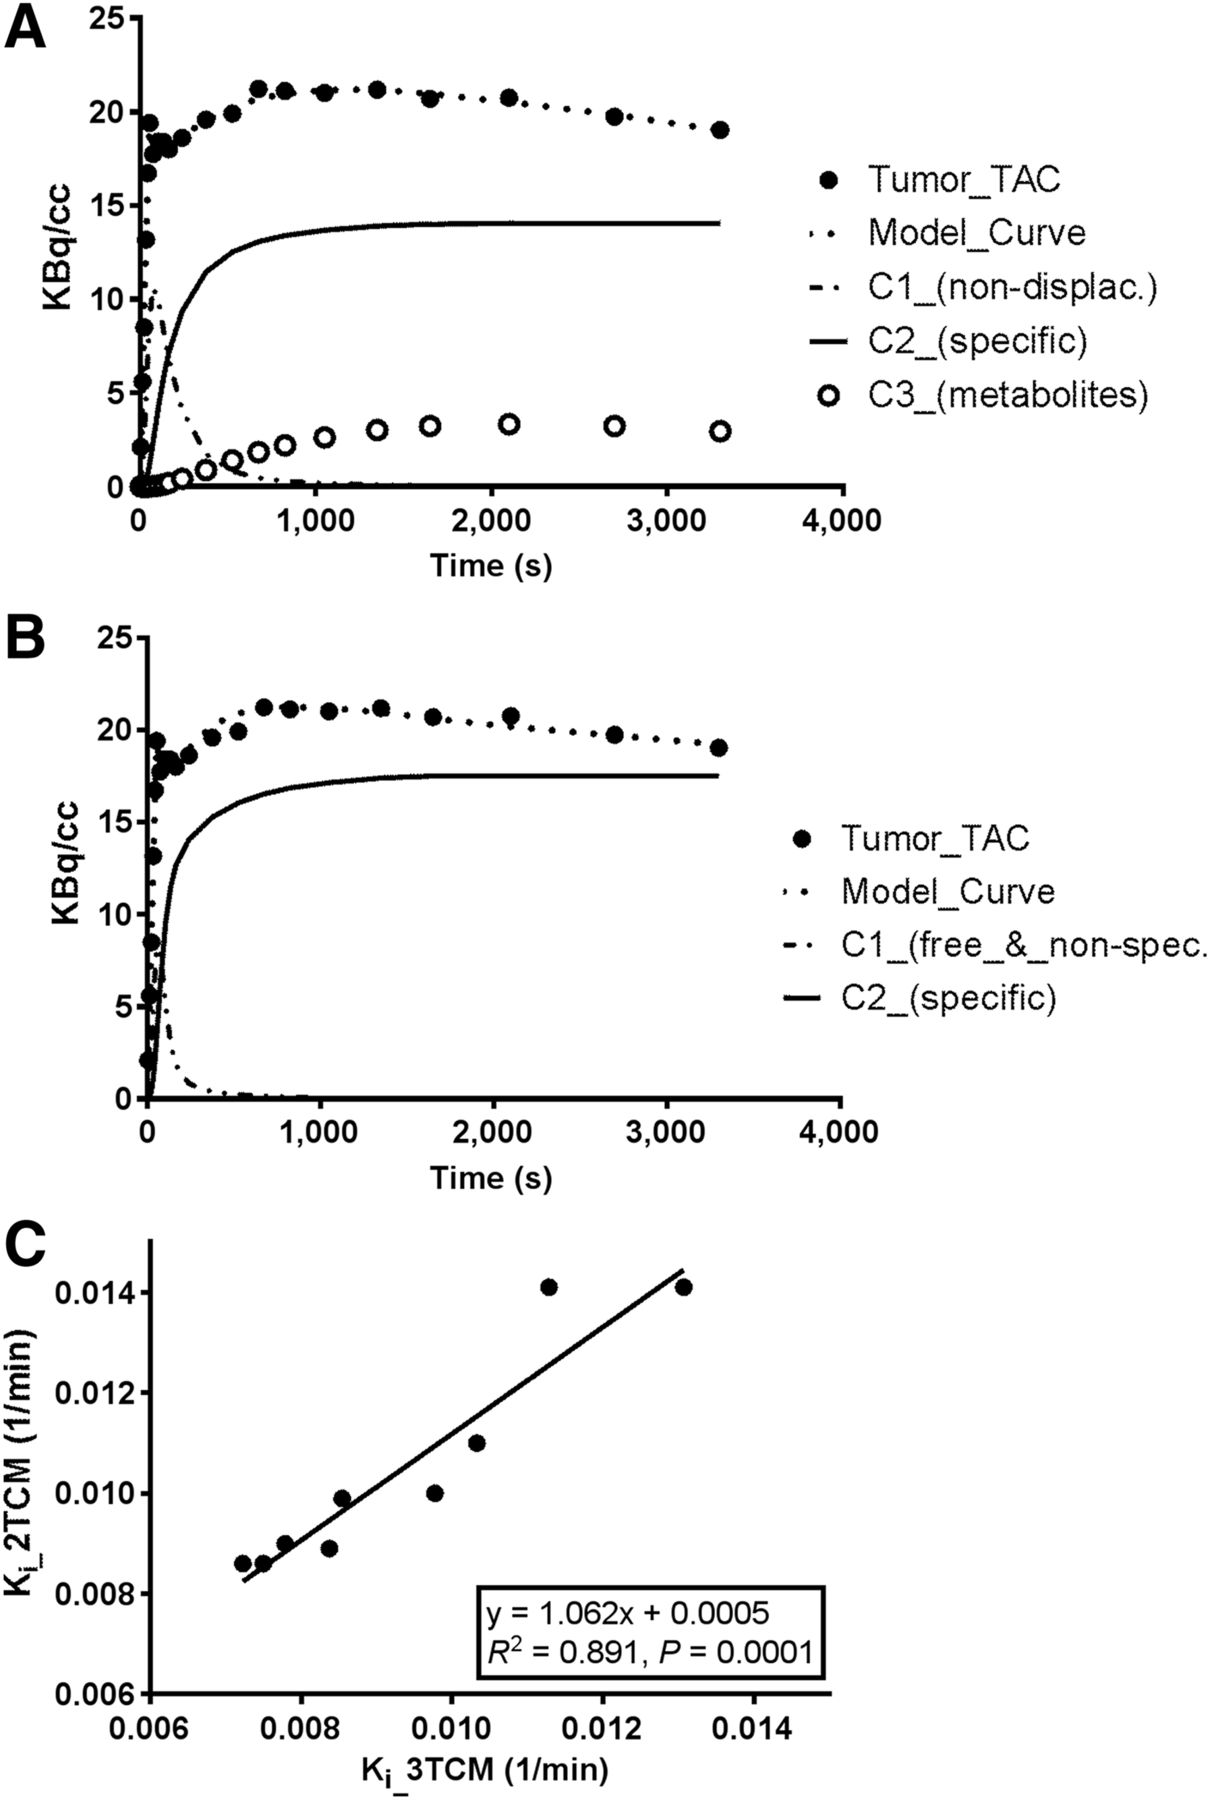
- FIGURE 4.
(A and B) Representative examples of 18F-FHNP time–activity curves in SKOV3 xenograft and corresponding 3TCM (A) and 2TCM (B) fits, in which C1, C2, and C3 stand for compartments 1, 2, and 3, respectively. (C) Correlation between Ki values from kinetic analysis using 2TCM and 3TCM.
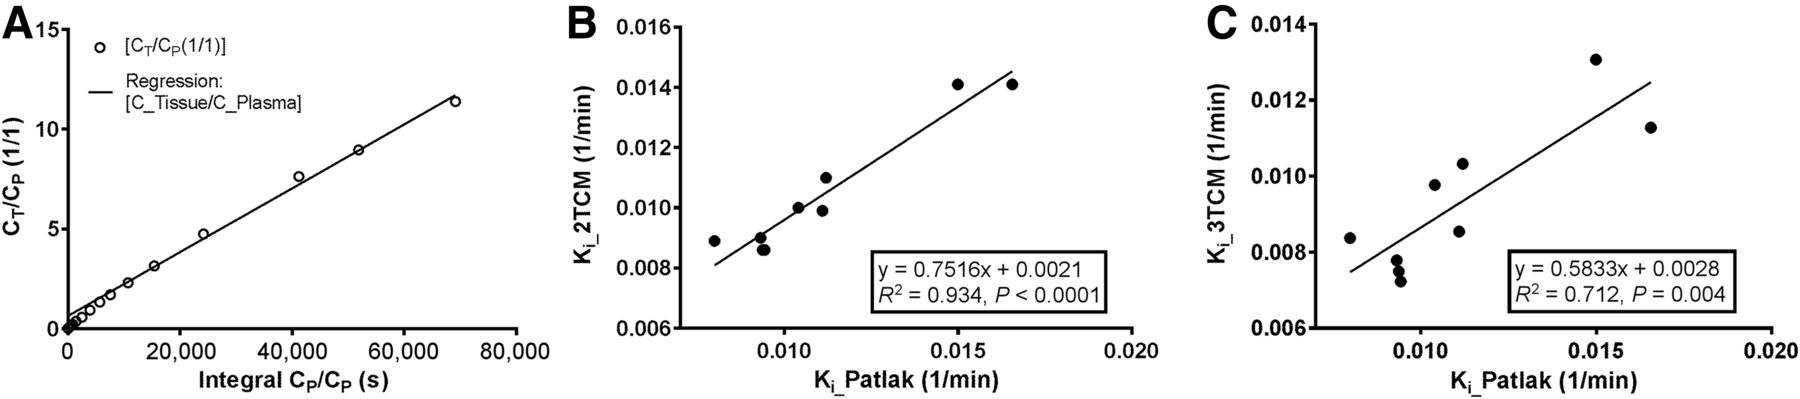
- FIGURE 5.
(A) Representative image of Patlak graphical analysis of 18F-FHNP uptake in SKOV3 xenograft, in which CT and CP stand for tissue and plasma compartments, respectively. (B and C) Correlation between Patlak graphical analysis and Ki values from kinetic analysis using 3TCM (B) or 2TCM (C).
- FIGURE 6.
Correlation of Ki values obtained from kinetic analysis using 2 TCM (n = 9) with ERβ (A) and ERα (B) density obtained from Western blotting assay.


Tables
3TCM Model 2TCM (parent) Parent Metabolite Blood volume 0.017 ± 0.008 0.016 ± 0.069 K1 (mL/g/min) 0.022 ± 0.010 0.0315 ± 0.020 0.023 ± 0.043 k2 (1/min) 1.069 ± 2.619 1.391 ± 2.527 1.706 ± 2.711 k3 (1/min) 0.584 ± 1.105 0.431 ± 0.493 — Ki (1/min) 0.010 ± 0.002 0.0093 ± 0.002 — Akaike information criterion 90.3 ± 15.8 85 ± 14.6 — - TABLE 2
Comparison of SUVs Obtained from PET Data 50–60 Minutes After Injection of 18F-FHNP and Ki Values Obtained from 2TCM Fit for All Groups
Parameter SUV Ki (1/min) Estradiol Control (n = 9) 0.28 ± 0.04 0.0105 ± 0.0020 0.003 μg/g (n = 4) 0.26 ± 0.05 0.0105 ± 0.0034 0.03 μg/g (n = 5) 0.25 ± 0.06 0.0100 ± 0.0030 0.3 μg/g (n = 5) 0.18 ± 0.05* 0.0073 ± 0.0020* Genistein Control (n = 9) 0.28 ± 0.04 0.0105 ± 0.0020 0.5 μg/g (n = 5) 0.25 ± 0.01 0.0082 ± 0.0014 5 μg/g (n = 4) 0.21 ± 0.03* 0.0076 ± 0.0011* ↵* P < 0.05 when compared with controls.
Supplemental Data
Files in this Data Supplement:


Jump to section
Related Articles
Cited By...
- No citing articles found.