


Abstract
Lung cancer heterogeneity makes response to therapy extremely hard to predict. Patient-derived xenografts (PDXs) are a reliable preclinical model that closely recapitulates the main characteristics of the parental tumors and may represent a useful asset for testing new therapies. Here, using PET imaging, we investigated whether lung cancer PDXs reproduce the metabolic characteristics of the corresponding parental tumors. Methods: We performed longitudinal 18F-FDG PET studies on 9 different PDX groups obtained by implanting primary-cancer fragments harvested from patients into mice. The SUVmax of each PDX was calculated and compared with the SUVmax of the corresponding parental tumor. Results: Tumor growth rate and uptake varied among the different PDXs and confirmed the preservation of individual characteristics. The intragroup reproducibility of PET measurements was good. Furthermore, PDXs from tumors with a higher metabolic rate displayed a rank order of uptake similar to that of the parental tumors. Conclusion: PDXs reproduced the glucose metabolism of the parental tumors and therefore represent a promising preclinical model for the early assessment of therapy efficacy.
Lung cancer is a heterogeneous disease characterized by poor outcome and limited response to pharmacologic treatment. The expanding knowledge about genetics and molecular biology has led to reconsideration of the classic histologic classification (1), suggesting personalized target-based or chemotherapeutic strategies according to the different molecular subtypes of tumors (2,3). Despite some efficacy in selected groups of patients treated with epidermal growth factor receptor or anaplastic lymphoma kinase inhibitors (4–6), this target-based approach has only marginally increased the overall survival of patients. Treatment of lung cancer still represents a major challenge since the presence of multiple modified pathways and the occurrence of therapy-induced mutations greatly limits efficacy (7). Development of second-generation kinase inhibitors, multitargeted combination therapy, and novel immune system–stimulating drugs may represent a novel strategy to reduce treatment failure (8).
Among other determinants of chemoresistance, cancer stem cells (CSCs, defined as the subset of tumor cells endowed with greater tumor-forming potential) have been suggested as another key factor in the limited efficacy of therapy because of their intrinsic chemoresistance and ability to support tumor regrowth (9,10). Development of agents targeting critical steps in CSC-deregulated pathways (i.e., Wnt, Notch, and Hedgehog) holds promise as an innovative therapeutic approach (11). In this context, we have previously shown that in lung cancer, CD133+ cells endowed with stemlike properties are resistant to cisplatin treatment (10), and we recently identified CD133+/CXCR4+/EpCAM− cells as metastasis-initiating (12).
Considering the high heterogeneity of lung cancer, preclinical models that recapitulate the specific genetic and cellular characteristics of primary tumors represent a major need in the identification and development of anticancer drugs. Patient-derived xenografts (PDXs), obtained by direct implantation of tissue fragments into immunocompromised mice, are of particular interest because they retain the morphology, architecture, and molecular signatures of the parental tumor more closely than is possible for in vitro established cell lines (13–15). PDXs have been used to identify specific determinants of therapeutic response (16,17) and even to predict the response of individual tumors to treatment (18–20). We previously reported the generation of non–small cell lung cancer (NSCLC) PDXs that closely maintained the biologic characteristics of the parental tumors, including histology, immunophenotype, resistance to platinum-based therapy, and CD133+ CSC content (21), and we demonstrated the potential for using PDXs to investigate the dynamics of CSCs during pharmacologic treatment (22).
The potential of PDXs to reproduce the metabolic characteristics of the corresponding parental tumors has, however, not been investigated. This has important clinical implications because metabolic reprogramming is now recognized as a hallmark of cancer cells (23) and several preclinical and clinical studies have indicated that in vivo imaging of the Warburg effect with 18F-FDG serves as a noninvasive surrogate marker for early prediction of prognosis and for assessment of the response to pharmacologic treatment, including targeted therapies (24–26). Even for lung cancers detected by screening, stratification of patients on the basis of 18F-FDG uptake (quantified as SUVmax) has been shown to have prognostic value (27). In particular, we observed that an SUVmax of less than 2.5 defined a homogeneous group of small, stage Ia, tumors (median diameter, 11 mm; range, 5–16 mm) with a 100% 5-y survival. In contrast, an SUVmax of more than 8 defined a group of mostly advanced cancers (only 8% stage Ia) whose 20% survival indicated a highly metastatic biologic profile (27).
Specific mutations can also influence metabolic activity; in particular, mutation or overexpression in tyrosine kinase receptors, PI3K/Akt/mTOR, RAS/RAF/MAPK, or liver kinase B1 (LKB1) results in increased activation of downstream signaling pathways that participate in reprogramming of tumor cell metabolism and influence uptake (28,29).
To investigate whether NSCLC PDXs maintain the metabolic characteristics of the parental tumors, we selected from our previously established NSCLC PDXs those deriving from patients who underwent a presurgery 18F-FDG PET measurement, and we compared the SUVmax of the PDX with that of the corresponding parental tumor. Furthermore, we assessed whether other features of PDXs, such as tumor engraftment, growth rate, and CSC content, are associated with SUVmax. PDXs originating from tumors with an SUVmax of more than 8 correlated well with the SUVmax of the parental tumors, underscoring the potential for using 18F-FDG PET in PDXs during preclinical development of novel therapeutic approaches.
MATERIALS AND METHODS
PDX Establishment
The Internal Review and the Ethics Boards of Fondazione IRCCS Istituto Nazionale dei Tumori (Milan, Italy) approved this study, and all subjects gave written informed consent (10). Tumor specimens from patients who underwent presurgical 18F-FDG PET were selected. Patient 18F-FDG SUVmax was masked from the researchers who participated in the preclinical PET study.
Female CD-1 nude or SCID mice (7–10 wk old) were purchased from Charles River Laboratories. The animals were kept under specific pathogen-free conditions and were handled and maintained according to the ethical regulations of the Institutional Animal Care and Use Committee of Fondazione IRCCS Istituto Nazionale dei Tumori and IRCCS Ospedale San Raffaele. The PDX models were established as previously described (21).
PET Analysis and Quantification
Groups of animals (5 or 6 per group) underwent 18F-FDG PET weekly for a month, starting when the tumor size was consistent with the spatial resolution of the preclinical PET scanner (4–5 mm). At the first PET scan, tumor volume varied from 50 to 139 mm3. Weekly, the animals were monitored for weight loss and tumor size, which was measured with a caliper (volume = (a × b2)/2, with a being the long side and b the short side). PET analysis and quantification were as previously described (26).
Tumor growth rate was calculated during the exponential growth phase and was quantified using specific growth rate (1/d) as ln(V2/V1)/(t2 − t1), with V being tumor volume and t the time of measurement (30), and then was correlated with uptake expressed both as SUVmax and as tumor-to-background ratio. Specific growth rate was evaluated during different time frames to include only the linear part of the growth curve.
Measurement of CD133+ and CD133+/CXCR4+/EpCAM− Cells on PDXs
CD133+ CSCs and the disseminating CD133+/CXCR4+/EpCAM− subset were detected using previously described procedures (10,12).
Statistical Analysis
Results are expressed as mean ± SD or SEM where indicated. Correlation (R2) was determined using the parametric Pearson test (2-tailed, 95% confidence interval) with Prism software (Graph Pad) and was considered statistically significant when the P value was less than 0.05. Linear regression was also calculated using Prism.
RESULTS
Establishment of PDXs from Varying Parental Tumors
Nine different PDX groups were evaluated during the study (Table 1): 7 derived from adenocarcinomas, 1 from a squamous cell carcinoma, and 1 from a large cell carcinoma. The groups had different clinical stages (1 stage IV, 4 stage IIIA, 2 stage IIB, and 2 stage IA), different degrees of lymph node involvement (4 N2, 2 N1, and 3 N0), and different degrees of CD133+ CSC content (4 had >15% CD133+ cells, 2 had 1%–15%, and 3 had <1%). Different driver mutations were also observed (2 groups showed mutations in KRAS, 4 in LKB1, and 1 in ERBB2). The groups also had different latency times (time from implantation to presence of palpable tumor; range, 11.6–61.7 d) and specific growth rates (range, 0.05 to 0.13) (Table 2). All these data confirm the unique nature of individual PDXs. In particular, 6 groups were from parental tumors with an SUVmax of more than 8, but the other 3 were from parental tumors with an SUVmax of less than 6: two greater than 2.5 and one less than 2.5.
Parental Tumor Phenotype
PDX Phenotype
Reproducibility, Intragroup Homogeneity, and Intergroup Heterogeneity of PDX SUVmax
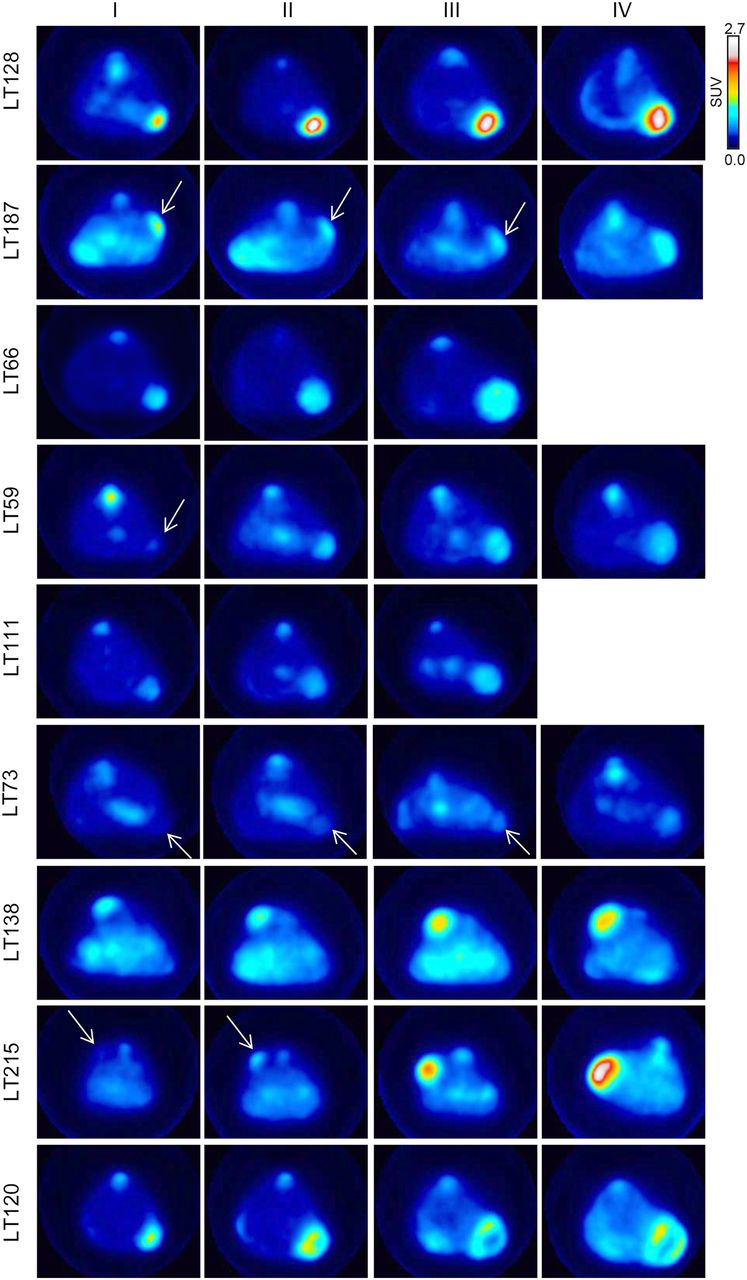
Under PET examination, the PDXs showed variable uptake (Table 2), as reflects the heterogeneity observed in the parental tumors. In some PDXs, uptake was high and the tumors were easily detectable (e.g., LT128, LT187, LT66, and LT120); in others, uptake was low and the tumors poorly detectable (e.g., LT73) (Fig. 1). During the observation time, mouse weight remained stable and no other clinical or behavioral changes were observed with the exception of LT138, which induced cachexia at later time points (Supplemental Fig. 1; supplemental materials are available at http://jnm.snmjournals.org). In some PDXs (LT66, LT111, LT120, LT128, and LT138), necrosis was visible on the PET images when the tumors grew larger than 300 mm3, but when we evaluated for correlations at volumes of 150 mm3, 18F-FDG was homogeneously distributed within the tumors.

18F-FDG PET scan of representative mouse for each group, intravenously injected with 4.2 ± 0.3 MBq after overnight fasting. Arrows indicate tumors.
Among the group of low-metabolism PDXs, LT215 (parental tumor SUVmax, 4.5) displayed an abrupt and sudden increase in size and uptake between the second and the third scans (from 66.1 ± 35 to 137 ± 57 mm3 and from an SUVmax of 0.62 ± 0.1 to 1.3 ± 0.3) as shown in Figure 1. Interestingly, this tumor had no nodal involvement at diagnosis but was associated with a synchronous brain metastasis.
To evaluate the influence of serial passages in the murine host on tumor metabolism, we evaluated uptake in the same PDX (LT66) at 2 different serial passages (p18 and p34). LT66 displayed a similar rate of growth at both p18 and p34, as well as a similar SUVmax (p18: SUVmax, 1.27 ± 0.15, and tumor volume, 874.40 ± 273.18 mm3; p34: SUVmax, 1.28 ± 0.14, and tumor volume, 785.42 ± 303.21 mm3) (Fig. 2A). We observed a general but not continuous increase in necrosis after p10, with comparable amounts of necrotic areas, slightly higher than in parental tumor but similar to each other.
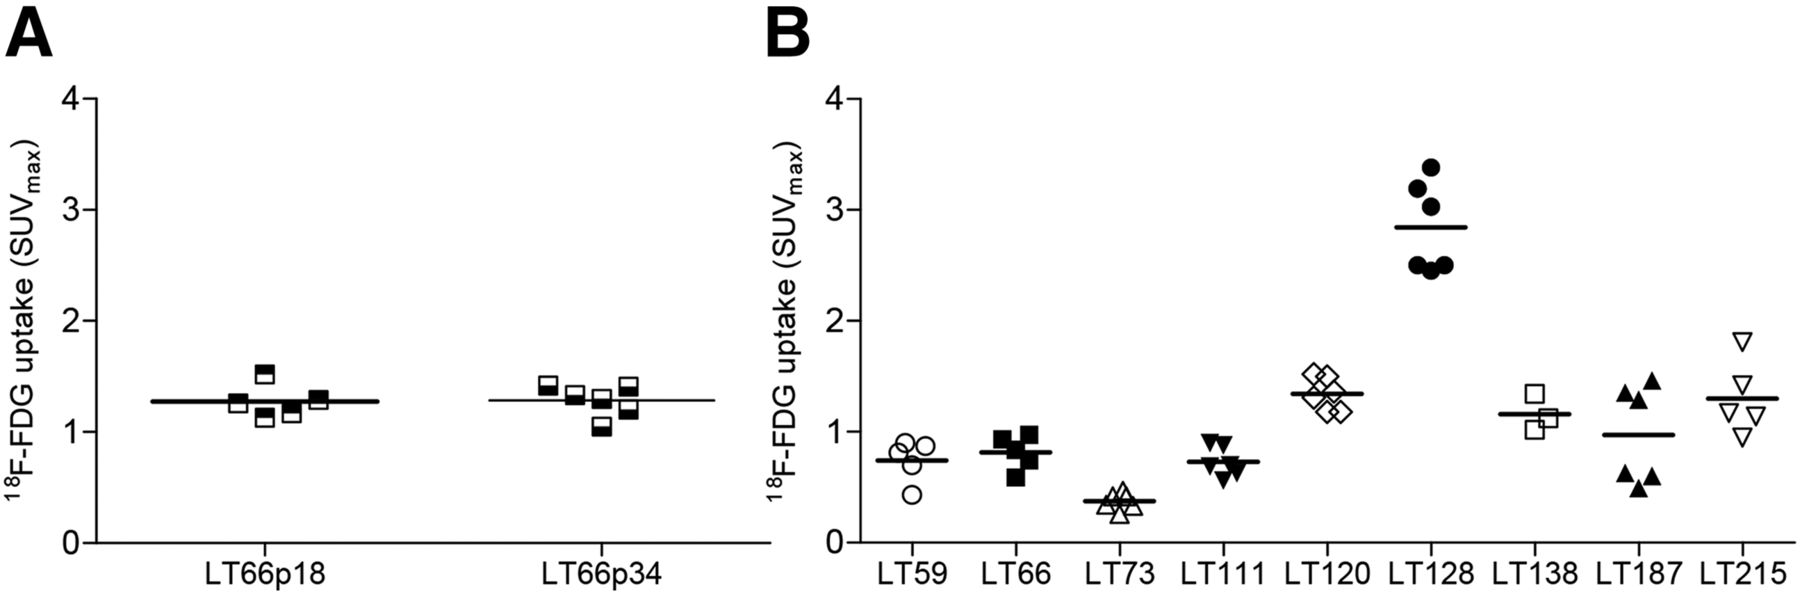
(A) SUVmax distribution in LT66 PDX with similar tumor dimensions (about 800 mm2) after 18 and 34 in vivo passages. (B) Measurement of uptake in multiple exponentially growing PDXs.
Intramodel metabolic variability was generally low except for LT128 and LT187 (Fig. 2B; Supplemental Fig. 2), which displayed a bimodal distribution. In both cases, half the PDXs analyzed showed a higher uptake, which could reflect differences in the cell populations of the parental tumors.
Correlation of Uptake with Clinicopathologic Characteristics of Tumors
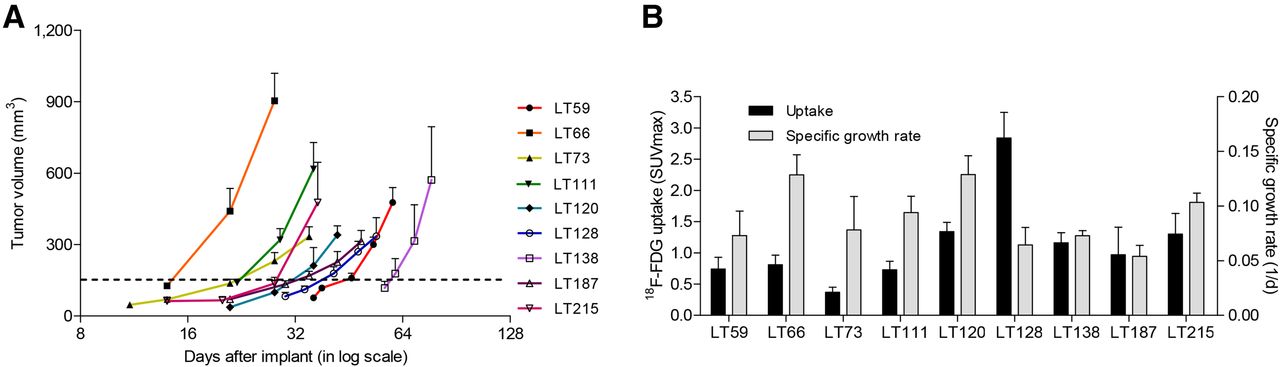
Association analysis showed that neither tumor growth rate nor CD133+ CSC content was related to SUVmax or change in SUVmax (Figs. 3A and 3B). However, when outliers (>6%) were removed, a slight positive correlation in PDXs was observed between SUVmax and the relative disseminating-CSC content (CD133+/CXCR4+/EpCAM−) within the CSC pool (R2 = 0.79, P = 0.06).

(A) Tumor growth rate in different PDX groups (n = 4–6 per each group). Error bars express SEM. (B) Lack of correlation between tumor growth rate and uptake in PDXs. Error bars express SD.
Finally, when we considered the group of PDXs as a whole, we found no statistical correlation between uptake in the PDXs and uptake in the corresponding parental tumors (Fig. 4A). In detail, the 3 PDXs from parental tumors with an SUVmax of less than 8 and absence of nodal involvement failed to maintain the rank order of SUVmax of the corresponding parental tumors (Table 3). In contrast, the PDXs from the remaining parental tumors (with nodal involvement and an SUVmax of more than 8) tended to have glucose metabolism similar to that of the parental tumors (R2 = 0.72, P < 0.05) (Fig. 4B).

(A) Lack of correlation between parental tumors and corresponding PDXs. (B) Significant correlation after exclusion of PDXs from parental tumors with SUVmax < 8 (red points). Even when highest SUVmax point was eliminated, correlation remained good (R2 = 0.62). Uptake is expressed as SUVmax.
Comparison of SUVmax Between Parental Tumors and PDXs
DISCUSSION
Being able to evaluate the efficacy of treatment early is of fundamental importance in the clinical management of patients. 18F-FDG PET represents an interesting tool for the early assessment of drug efficacy (25,31) and can be used to image PDXs, which reproduce the characteristics of the parental tumor regarding immunohistochemical markers, genetic alterations, and maintenance of cellular heterogeneity (20,21). Here, using PET imaging, we evaluated glucose metabolism in PDXs from NSCLC patients who underwent 18F-FDG PET. The tumors of the patients had different clinicopathologic characteristics, and the growth rates and glycolytic phenotypes of the PDXs were highly variable.
18F-FDG uptake can be affected by modifications and rearrangements in some genes, such as ALK, EGFR, KRAS, ERBB2, and LKB1. Recently, Choi et al. observed that lung cancer patients with ALK rearrangement showed higher glucose metabolism than patients with EGFR mutations or wild-type patients for both genes (32). In other tumor types, mutations in KRAS/BRAF or in LKB1 are generally related to a high-glycolysis phenotype (29,33,34).
Among our highly glycolytic PDXs, LT128 and LT66 displayed mutations both in the KRAS gene (c.34G > T) and in the LKB1 gene (c.920 + 2T > A and c.298C > T, respectively), which could partially explain the high uptake. Also, LT73 and LT138 showed mutations in the LKB1 gene (c.859A > T and c.354delC, respectively) but not in the KRAS gene and displayed a different SUVmax. The correlation between specific gene alterations and glycolytic phenotype should therefore be investigated in greater detail, potentially taking into account interactions among multiple mutations.
In comparing uptake in PDXs with that in the corresponding parental tumors, we observed that PDXs from tumors with an SUVmax of more than 8 showed the same uptake behavior as the parental tumors. This subgroup represents higher-glycolysis tumors, which have higher metastatic potential and the worst prognosis among screening-detected lung cancers (Fig. 4B) (27). For patients with such tumors, identification and development of pharmacologic treatment remains an unmet clinical need. In our previous study, the glycolytic phenotype of tumor cells influenced the response to VEGF-targeted treatment and the acquisition of resistance, which could be monitored by PET imaging (26). In this context, metabolic alterations could be an interesting target for novel therapeutic approaches (26,34).
SUVmax did not correlate between the 3 PDXs from tumors with an SUVmax of less than 8 and their corresponding parental tumors. Two of these were from low-stage tumors (IA), one of which was carrying an LKB1 mutation (c.354delC). The third (LT215) was from a small primary tumor (T2) with an SUVmax of 4.5, no evidence of lymph node involvement, but synchronous brain metastasis. This PDX displayed a sudden and abrupt increase in size and uptake, possibly reflecting the aggressiveness of the parental tumor. We hypothesized that when the PDX was smaller, during the early phase of engraftment, it recapitulated the glucose metabolism of the parental tumor but that a subpopulation of cells with a more aggressive phenotype already present in the parental tumor possibly then took over (Fig. 1). As previously stated, the SUVmax of PDXs from poorly glycolytic parental tumors lacking nodal involvement failed to maintain the glycolytic phenotype of the parental tumors (Fig. 4A; Table 3). Considering that engraftment is generally more difficult for such PDXs, we assume that selection of PDXs with more resistant cells and higher glucose metabolism might have supported the engraftment.
Concerning model reproducibility, we observed that uptake, measured during the exponential phase after engraftment and at comparable tumor size, was homogeneous within the same PDX group with the exception of LT128 and LT187, which showed similar although bimodal metabolic behavior that could reflect differences in the cell populations of the parental tumors. In our platform of 38 lung cancer PDXs, we have consistently observed that PDXs maintain the parental tumor characteristics (histologic type, main histologic patterns, marker expression, genetic profile, stromal content, degree of necrosis, and stem cell content) for several passages in the animal (>p10) (21). In the single case analyzed in this study, we observed the same metabolic phenotype regardless of the number of passages. PDXs are generated by subcutaneous implantation of a small fragment of parental tumor into a mouse, after which the engrafted tumor is reduced into fragments and transferred to other animals. Although—in view of this possible source of variability—a certain intralesional variability could sometimes be observed, the intragroup reproducibility of the measurements was remarkable.
As previously indicated, PDXs recapitulated the biologic characteristics of the corresponding parental tumors, including CD133+ CSC content and resistance to platinum therapy (10,21). Stem cell–like properties are closely related to chemoresistance phenotype, but because of the low number of CSCs within parental tumors, it is difficult to use CSC markers in clinical practice and it is challenging to visualize them with molecular imaging (35). Like Gaedicke et al., we found no correlation between CD133 expression and glucose metabolism as measured by SUVmax (36). In fact, in that study CD133+ cells could be imaged only by using a specific 64Cu-conjugated antibody-based tracer. However, we observed a tendency for tumors with a higher SUVmax to have a greater relative disseminating-CSC content (CD133/CXCR4/EpCAM−), which we recently identified as being modulated by microenvironmental cues and related to a bad clinical outcome in NSCLC patients (12). This could indicate a propensity for tumors with high glycolytic activity to induce selective enrichment of CSCs with disseminating ability, possibly providing a link between high SUVmax and worst prognosis.
Strategies to improve imaging of CSCs will be needed to evaluate the potential clinical relevance of CSC tracking. In a recent study on a mouse model of colon carcinoma (colon-26), Yoshii et al. observed high uptake of 64Cu-diacetyl-bis(N4-methylthiosemicarbazone) within regions with a high density of CD133+ cells whereas regions with a high uptake of 18F-FDG had the lowest presence of CD133+ (37). Moreover, in mice implanted with Lewis lung carcinoma cell line LLC1, Oh et al. found an accumulation of 64Cu-diacetyl-bis(N4-methylthiosemicarbazone) in tumor regions comprising quiescent but clonogenic cells with low glucose metabolism (38). Altogether, these studies suggest that specific tracers identifying a CSC subset with relative quiescence and low metabolic activity might be more useful than 18F-FDG and might be implemented in association with PET to gain more information on tumor response during treatment.
CONCLUSION
Lung PDXs from parental tumors with an SUVmax of more than 8 mirror not only the histologic characteristics and CSC content of the parental tumors but also their metabolic activity, suggesting greater usefulness in more aggressive tumors with higher metabolism. The combined use of PDXs and metabolic imaging could therefore represent a powerful preclinical tool for drug discovery and testing.
DISCLOSURE
This work was supported by AIRC (Associazione Italiana per la Ricerca sul Cancro; IG13403 to Luca Roz, IG14318 to Gabriella Sozzi, IG15928 to Ugo Pastorino, and 12162 [“Innovative Tools for Cancer Risk Assessment and Early Diagnosis,” 5x1000]); the European Community Seventh Framework Program (FP7/2007-2013); grant HEALTH-F2-2010-258677 from Collaborative Project CURELUNG to Luca Roz; and grants RF-2010-2306232 and 2310201 from the Italian Ministry of Health to Gabriella Sozzi and Ugo Pastorino, respectively. No other potential conflict of interest relevant to this article was reported.
Acknowledgments
We thank Pasquale Simonelli for technical assistance with the imaging experiments.
Footnotes
- © 2017 by the Society of Nuclear Medicine and Molecular Imaging.
REFERENCES
- Received for publication March 30, 2016.
- Accepted for publication June 22, 2016.


Jump to section
Related Articles
Cited By...
- No citing articles found.