


Abstract
The enzyme phosphodiesterase 2A (PF-05270430) is a potential target for development of novel therapeutic agents for the treatment of cognitive impairments. The goal of the present study was to evaluate the PDE2A ligand 18F-PF-05270430, 4-(3-fluoroazetidin-1-yl)-7-methyl-5-(1-methyl-5-(4-(trifluoromethyl)phenyl)-1H-pyrazol-4-yl)imidazo[1,5-f][1,2,4]triazine, in nonhuman primates. Methods: 18F-PF-05270430 was radiolabeled by 2 methods via nucleophilic substitution of its tosylate precursor. Tissue metabolite analysis in rodents and PET imaging in nonhuman primates under baseline and blocking conditions were performed to determine the pharmacokinetic and binding characteristics of the new radioligand. Various kinetic modeling approaches were assessed to select the optimal method for analysis of imaging data. Results: 18F-PF-05270430 was synthesized in greater than 98% radiochemical purity and high specific activity. In the nonhuman primate brain, uptake of 18F-PF-05270430 was fast, with peak concentration (SUVs of 1.5–1.8 in rhesus monkeys) achieved within 7 min after injection. The rank order of uptake was striatum > neocortical regions > cerebellum. Regional time–activity curves were well fitted by the 2-tissue-compartment model and the multilinear analysis-1 (MA1) method to arrive at reliable estimates of regional distribution volume (VT) and binding potential (BPND) with 120 min of scan data. Regional VT values (MA1) ranged from 1.28 mL/cm3 in the cerebellum to 3.71 mL/cm3 in the putamen, with a BPND of 0.25 in the temporal cortex and 1.92 in the putamen. Regional BPND values estimated by the simplified reference tissue model (SRTM) were similar to those from MA1. Test–retest variability in high-binding regions (striatum) was 4% ± 6% for MA1 VT, 13% ± 6% for MA1 BPND, and 13% ± 7% SRTM BPND, respectively. Pretreatment of animals with the PDE2A inhibitor PF-05180999 resulted in a dose-dependent reduction of 18F-PF-05270430 specific binding, with a half maximal effective concentration of 69.4 ng/mL in plasma PF-05180999 concentration. Conclusion: 18F-PF-05270430 displayed fast and reversible kinetics in nonhuman primates, as well as specific binding blockable by a PDE2A inhibitor. This is the first PET tracer with desirable imaging properties and demonstrated ability to image and quantify PDE2A in vivo.
Schizophrenia is a chronic, highly debilitating psychiatric disorder (1). This disease displays positive symptoms (hallucinations, paranoia, delusions), negative symptoms (apathy, alogia, affective flattening), and cognitive symptoms (deficits in memory, attention, executive function) (2). Up to 75% of schizophrenic patients suffer from cognitive impairment (3), whose treatment remains a critical unmet medical need, because current antipsychotics most effectively alleviate positive symptoms and modestly improve negative symptoms but have little to no effect on cognitive deficits (4,5). The phosphodiesterase 2A (PDE2A) is a dual-substrate enzyme with the highest levels of expression within the limbic and basal ganglia brain circuitry found to be dysfunctional in schizophrenia and thus has been proposed as a target for drug development for this disorder (6,7).
PDE2A protein expression is prominent in the cortex, hippocampus, subiculum, amygdala, caudate, putamen, nucleus accumbens, and ventral tegmental areas and is similarly distributed across rodents, dogs, nonhuman primates (NHPs), and humans (6). PDE2A is concentrated within the synaptic compartments of many glutamatergic structures and thereby potentially positioned to selectively modulate the cyclic nucleotide signaling cascades regulating neurotransmission within the brain circuits involved in schizophrenia (8). Dysfunction of the N-methyl-d-aspartate (NMDA) glutamatergic system has been implicated in the pathogenesis of schizophrenia, because NMDA antagonists (e.g., ketamine) reproduce in healthy subjects the symptoms of schizophrenia, including cognitive impairment and negative symptoms (9). PDE2A inhibitors have been shown to increase cyclic nucleotide levels in vitro; to enhance long-term potentiation, a measure of synaptic plasticity, in hippocampal slices; and to improve learning and memory in vivo (10). Taken together, these findings suggest that PDE2A inhibitors could positively affect cognitive endpoints in schizophrenia.
We have previously reported a novel series of PDE2A inhibitors (11). As part of the development program, we sought to unequivocally establish the ability of key compounds to permeate the blood–brain barrier and bind to PDE2A to potentially serve as therapeutics for cognitive impairment associated with schizophrenia. One way to do this is by developing a PDE2A PET ligand for use in the assessment of drug candidates via target occupancy (TO) studies. So far, there has been only one report of an attempt to develop PET imaging agents for PDE2A, but no suitable radioligand was found (12). We have previously defined a set of selection criteria for novel radiotracers for the central nervous system through a systematic analysis of physicochemical properties of validated PET ligands (13). Application of these criteria to our PDE2A inhibitor library led to the identification of PF-05270430, 4-(3-fluoroazetidin-1-yl)-7-methyl-5-(1-methyl-5-(4-(trifluoromethyl)phenyl)-1H-pyrazol-4-yl)imidazo[1,5-f][1,2,4]triazine (Fig. 1), as a promising tracer candidate. In addition to its subnanomolar affinity to PDE2A enzyme (IC50 = 0.53 nM) and exquisite selectivity over other PDEs and a broad panel of central nervous system targets (all < 30% inhibition at 1 μM), PF-05270430 fits our defined favorable PET property space nicely (Supplemental Table 1; supplemental materials are available at http://jnm.snmjournals.org). In this article, we report the radiosynthesis of 18F-PF-05270430 as the first PET radioligand for PDE2A, its radioactive metabolite profiles in both rats and NHPs, and imaging evaluation in NHPs. The companion paper reports the tracer’s radiation dosimetry in NHP, toxicology data summary, safety, tolerability, and test–retest reproducibility evaluation in healthy human subjects (14).
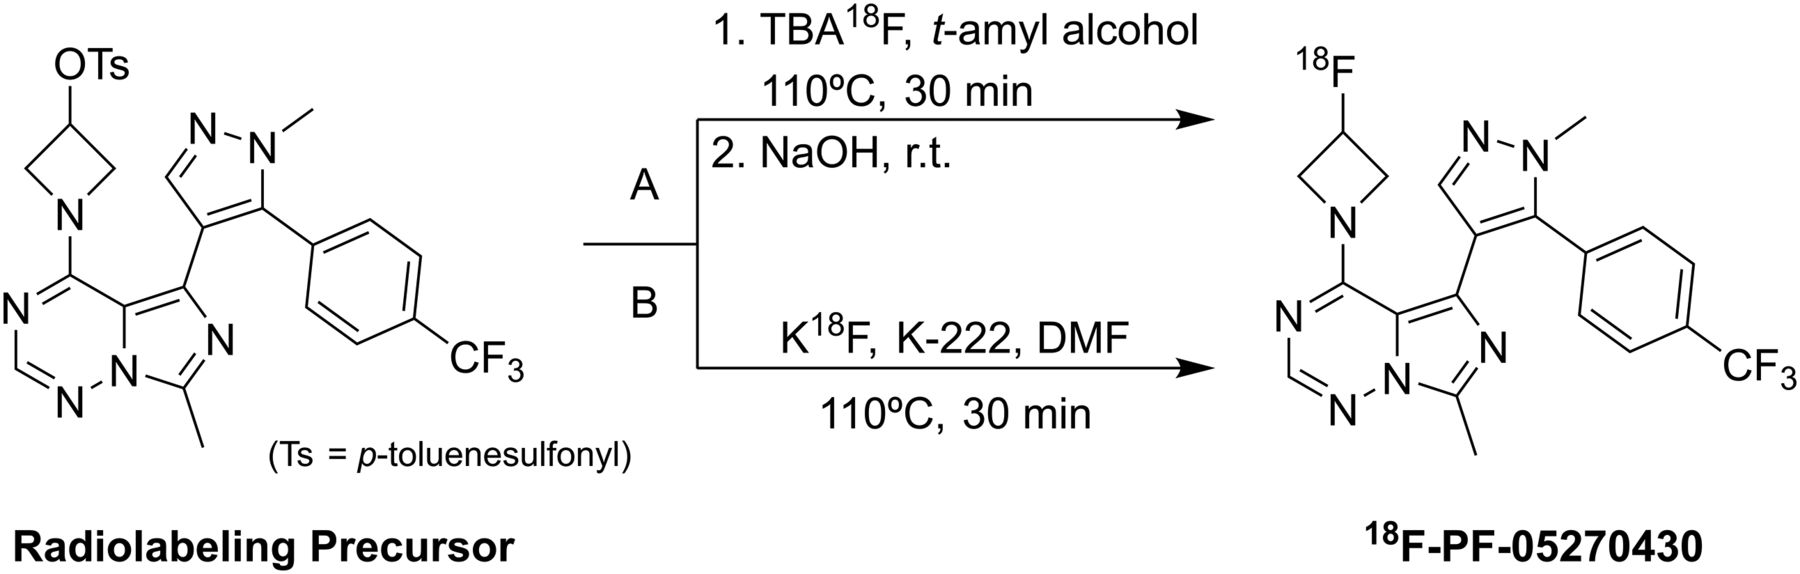
Radiosynthesis of 18F-PF-05270430 with two methods (A and B).
MATERIALS AND METHODS
All experiments involving laboratory animals were performed in accordance with federal, state, local, and institutional guidelines governing the use of laboratory animals in research and were reviewed and approved by the Institutional Animal Care and Use Committee at Pfizer and Yale University.
Synthesis of PF-05270430 and Radiolabeling Precursor for 18F-PF-05270430
Synthesis of PF-05270430 and the tosylate radiolabeling precursor were prepared according to procedures reported previously (13).
Radiosynthesis of 18F-PF-05270430
18F-PF-05270430 was synthesized from the tosylate precursor via 2 methods (A and B), as shown in Figure 1.
Method A (Tetrabutylammonium)
This method of 18F-PF-05270430 radiosynthesis was reported previously (13).
Method B (Kryptofix-222)
Radiosynthesis was performed on the TRACERLab FXFN automated synthesis module (GE Healthcare). 18F-fluoride was produced via the 18O(p, n)18F nuclear reaction by bombarding 18O-water with a proton beam using the PETtrace cyclotron (GE Healthcare) and delivered to the synthesis module where it was trapped on an 18F-separation ion-exchange cartridge. 18F-fluoride was then eluted from the cartridge into the reactor with a 1.0- to 1.4-mL solution of Kryptofix-222 (10 mg) and K2CO3 (1–2 mg) in acetonitrile/water (1:0.4, v/v). Preparation of the anhydrous 18F-fluoride-Kryptofix-222 complex by azeotropic distillation with acetonitrile followed the procedure previously reported (15). After the reactor was cooled to 60°C, 1.5 mg of the precursor in 0.5 mL of anhydrous N,N-dimethylformamide (DMF) were added and the mixture heated at 110°C for 30 min. The reaction mixture was cooled to 60°C, diluted with 15 mL of 1 mM HCl, and passed through a Waters C-18 Light SepPak cartridge that was preconditioned with 5 mL of EtOH followed by 5 mL of deionized water. The cartridge was eluted with 1.5 mL of acetonitrile/absolute ethanol (2:1, v/v) into a receiving vial containing 3.5 mL of 0.1 M ammonium formate with 0.5% acetic acid. The combined solution was then loaded onto a Genesis C18 high-performance liquid chromatography (HPLC) column (4 μm, 10 × 250 mm; Grace) eluting at a flow rate of 5 mL/min with 33% acetonitrile and 67% of 0.1 M ammonium formate with 0.5% acetic acid (v/v). The product fraction was collected, diluted with 50 mL of deionized water, and passed through a second Waters C18 Light SepPak. The cartridge was rinsed with 10 mL of 1 mM HCl, dried, then eluted with 1 mL of absolute ethanol (U.S. Pharmacopeia grade [USP]), followed by 3 mL of USP saline, into a product vial containing 7 mL of USP saline and 40 μL of 4.2% sodium bicarbonate (USP). This mixture was then passed through a membrane filter (0.22 μm) and collected in a sterile vial.
Chemical purity, radiochemical purity, and specific activity of the radiotracer were determined by analytic HPLC equipped with both a radioactivity detector and an ultraviolet detector (detection wavelength set at 254 nm) and a Gemini C18 column (5 μm, 4.6 × 250 mm) eluting at a flow rate of 1.5 mL/min with 45% acetonitrile and 55% of 0.1 M ammonium formate with 0.5% acetic acid. The identity of the radiolabeled compound was determined by coinjection with PF-05270430.
Metabolite Analysis in Rats
Two male Sprague–Dawley rats from Charles River (body weight, 306 and 344 g) were briefly anesthetized (2%–3% isoflurane in O2) for tail vein injection of 18F-PF-05270430 (67.1 and 69.1 MBq, respectively), then allowed to recover for tracer uptake. Rats were anesthetized again at 30 min after tracer injection and sacrificed by decapitation. The blood and striatum samples were collected and placed in preweighed tubes for further processing. Unchanged tracer in plasma and brain samples was measured using HPLC. Detailed procedures are described in the supplemental materials.
PET Imaging Procedures in Rhesus Monkeys
PET imaging studies with 18F-PF-05270430 were conducted in rhesus monkeys and consisted of 2 parts. In part 1, test–retest experiments were performed with 2 monkeys (1 male, 8.85 kg; and 1 female, 7.0 kg) to determine the reproducibility of binding parameters measured with 18F-PF-05270430. In part 2, blocking experiments were conducted to assess the binding specificity of the radiotracer.
Animals were immobilized with ketamine (10 mg/kg intramuscularly) and anesthetized with 1%–2% isoflurane in oxygen. PET imaging was performed on a Focus220 scanner (Siemens Medical Solutions). A 9-min transmission scan was obtained before radiotracer injection for attenuation correction. Emission data were collected in list-mode for 120 or 180 min and reformatted into 33 or 45 successive frames of increasing duration (6 × 10 s, 3 × 1 min, 2 × 2 min, 22 [34] × 5 min).
Metabolite Analysis and Generation of Input Functions
The arterial input functions were generated for all scans. Arterial blood samples were drawn at 3, 8, 15, 30, 60, 90, and 120 min after tracer injection for analysis of unmetabolized fraction of the tracer using the column-switching HPLC method (16). Detailed procedures are described in the supplemental materials. The final plasma input function was calculated as the product of the total plasma activity curve and the parent fraction curve.
Measurement of Plasma Free Fraction
An ultrafiltration-based method was used for measuring the free fraction (fp) of 18F-PF-05270430 in plasma, as described previously (17).
Test–Retest Study
Each monkey underwent 2 PET scans on separate days. 18F-PF-05270430 was administered intravenously over 3 min by an infusion pump. Emission data were acquired for 180 min. Dynamic images were reconstructed with a filtered backprojection algorithm. Regions of interest (ROIs) were manually delineated on a single representative anatomic rhesus monkey MR image registered to a template image. Regions used in this study were the putamen, caudate, nucleus accumbens, cingulate cortex, frontal cortex, temporal cortex, occipital cortex, and cerebellum. Registration parameters were obtained to apply the ROIs to individual PET scans, and regional time–activity curves were generated for the ROIs.
Values of regional distribution volume (VT) and binding potential (BPND) were computed using 1-tissue and 2-tissue (2T) compartment models (18), as well as the multilinear analysis-1 (MA1) method (19). For MA1, data were fitted starting at time t* = 30 min. The simplified reference tissue model (SRTM) was also used to estimate BPND using the cerebellum as the reference region (20).
The mean and SD of the percentage difference between test (T) and retest (R) scans were calculated as follows:
Blocking Experiments
Two blocking studies with the PDE2A inhibitor PF-05180999 (11) were performed in 2 different animals with 120 min of scan after injection of 18F-PF-05270430. Doses of 0.2 and 2.0 mg/kg of PF-05180999 were administered subcutaneously 90 min before tracer injection. Venous blood samples were collected at 0, 60, 90, 120, 150, and 180 min after injection to measure plasma drug exposure (detailed analysis procedures are described in the supplemental materials). For each study, radiotracer concentrations were measured in the same ROIs as the test–retest study.
Regional VT and BPND values were calculated using MA1 (t* = 30 min) and SRTM. The percentage change between control (C) and blocking (B) scans was computed as follows:
Target Occupancy (TO) Study in Cynomolgus Monkeys
Two male cynomolgus monkeys (5–6 y old) were used. For each monkey, a baseline PET scan and blocking scans with various doses of PF-05180999 (0.2, 0.4, 0.5, 0.6, and 2.0 mg/kg) were obtained. PF-05180999 was administered subcutaneously 1 h before 18F-PF-05270430 injection. Dynamic PET scans of 90 min were conducted on a Focus220 scanner. Methods on PET scanning and BPND calculation were described previously (13). Blood samples were collected via the jugular vein at 0, 45, and 90 min after 18F-PF-05270430 injection to measure the plasma concentration of PF-05180999 during the PET scan period (details are provided in the supplemental materials).
PDE2A TO by PF-05180999 was calculated as the percentage difference in BPND between the baseline and blocking scans. The TO values in putamen and caudate were averaged to give the whole striatal occupancy. Finally, the striatal TO values from the 10 blocking scans (2 animals with 5 blocking drug doses each) were compared with the mean PF-05180999 plasma concentrations during the 90-min scan period to establish the TO versus plasma exposure relationship.
Pharmacokinetic/pharmacodynamic analysis was performed using NONMEM (NONMEM software system, version VI; GloboMax LLC). A sigmoid Emax model (21) was used to correlate TO to observed plasma drug concentrations.
RESULTS
Radiosynthesis of 18F-PF-05270430
When radiosynthesis method A was applied, 3,034 ± 407 MBq of 18F-PF-05270430 were obtained from 76 ± 5 GBq of 18F-fluoride in 81 min from the end of bombardment (8.0% ± 1.7% decay-corrected yield, n = 3). Radiochemical purity was greater than 99%, with a specific activity of 405 ± 14 MBq/nmol at the end of synthesis. With method B, DMF was used as reaction solvent, and radiolabeling was performed for 30 min at 110°C as in method A, except that Kryptofix-222/K2CO3 was used, yielding 3,053 ± 901 MBq of 18F-PF-05270430 from 74.4 ± 17.7 GBq of 18F-fluoride in 127 ± 11 min from the end of bombardment. The radiochemical yield was 4.2% ± 1.3% (decay-corrected, n = 19). The radiochemical purity of the final product was greater than 98%, with a specific activity of 115.2 ± 76.7 MBq/nmol (end of synthesis).
Metabolite Study in Rats
Limited metabolism studies were performed in rats at 30 min after tracer injection to determine whether any radioactive metabolites entered the brain. The results showed that even though only 30% and 46% of 18F-PF-05270430 remained in the plasma of 2 rats after 30 min, most of the radioactivity in the striatum (93% and 95%, respectively) was associated with the parent tracer (more details are provided in the supplemental materials).
PET Imaging Studies in Rhesus Monkeys
Test–Retest Study
The activity dose of 18F-PF-05270430 was 166 ± 18 MBq, with a specific activity of 69 ± 40 MBq/nmol at the time of injection (n = 4).
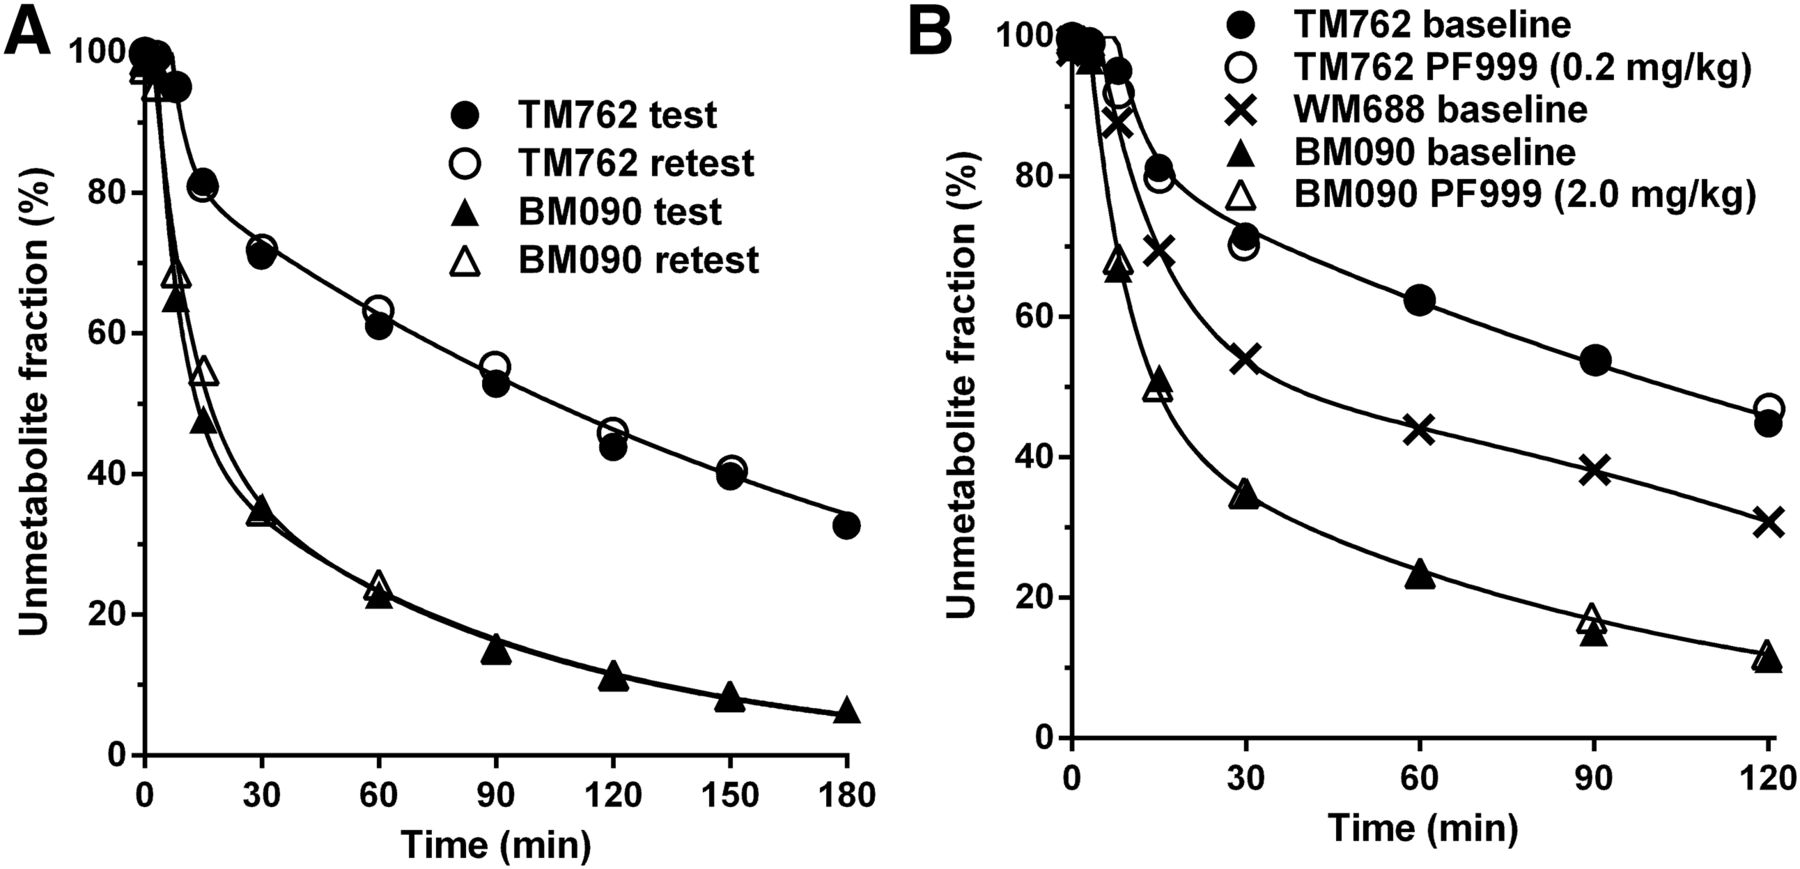
The metabolism rate of 18F-PF-0527430 was different between monkeys but consistent between test and retest scans in the same animal (Fig. 2A). Parent fractions at 30 min after radiotracer injection were 71% ± 0.6% for subject TM762 and 35% ± 0.3% for BM090. Free fraction in the plasma was 20% ± 4% (n = 4) and not different between animals.

Unmetabolized 18F-PF-05270430 fraction in plasma over time in test–retest study (A) and in baseline-blocking study (B) in rhesus monkeys. In B, WM688 is a third monkey undergoing baseline scan only.
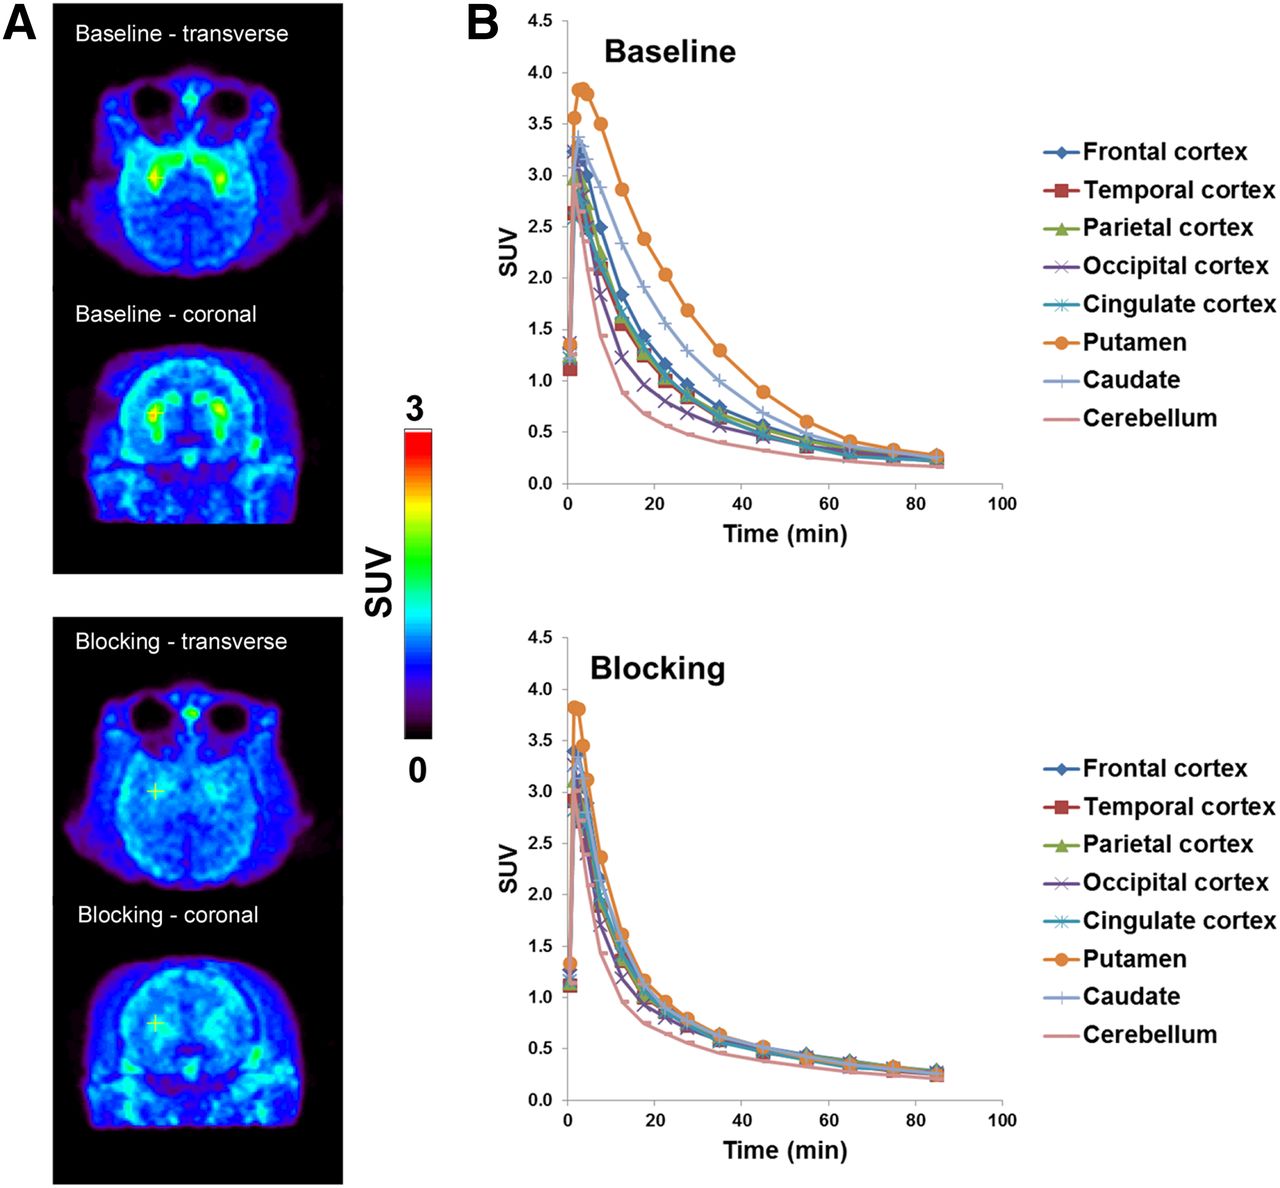
In the brain, distribution of 18F-PF-05270430 was heterogeneous, with high uptake in the putamen and caudate and low uptake in other regions (Fig. 3A). 18F-PF-05270430 displayed fast uptake kinetics, with activity levels peaked at approximately 7 min, followed by a rapid clearance in all brain regions (Fig. 3B).

(A) 18F-PF-05270430 SUV images (summed 20–40 min) from baseline scan (middle column) and blocking scan (right column) with PF-05180999 (2.0 mg/kg) in rhesus monkey. Coregistered MRI slices (left column) are also displayed. (B) Corresponding time–activity curves from baseline (left) and blocking (right) scans.
Fitting of regional time–activity curves by the 2T model was better than the 1-tissue-compartment model. However, the 2T model either produced implausible parameters or did not converge in some regions. Excluding such regions, analysis by the MA1 method produced results consistent with those from the 2T model, and there was excellent agreement in VT and BPND values estimated by MA1 and 2T. Values of BPND derived from SRTM were well correlated with those from 2T but with a slope somewhat skewed from the line of identity. Given the quality of fit and comparison with BPND values estimated from 2T, MA1 was selected as the method of choice for analysis.
Distribution volumes computed with 120 min of scan data were similar to those with 180-min data (VT 120 min = 1.02 VT 180 min – 0.07, R2 = 1.00). Therefore, 120 min of the scan data were used for calculating outcome measures.
Mean VT and BPND values obtained with MA1 and SRTM are shown in Table 1. VT values were highest in the striatum, intermediate in the neocortical regions, and lowest in the cerebellum. The coefficient of variation (COV) was 2%–6% for VT. In the high-binding regions (putamen, caudate, and nucleus accumbens), COV was 12%–13% for MA1 BPND and 12%–14% for SRTM BPND. Higher COV was observed in the neocortical regions because of their low BPND values (0.05–0.5).
Outcome Measures Derived from MA1 and SRTM Analysis of 18F-PF-05270430 Imaging Data in Rhesus Monkeys
The test–retest variability across subjects is shown in Table 2. The VT test–retest variability was small across all regions, whereas BPND variability was low in high-binding regions and higher in low-binding regions, as expected. Test–retest variability of VT MA1, BPND MA1, and BPND SRTM was 4% ± 6%, 13% ± 6%, and 13% ± 7%, respectively, in high-binding regions.
Test–Retest Variability of 18F-PF-05270430 Binding Parameters in Rhesus Monkeys
Blocking Experiments
The metabolism rate of 18F-PF-05270430 in blocking studies with PF-05180999 was similar to that of the baseline scans (Fig. 2B). Free fraction displayed no significant difference between baseline (fp = 19.5% ± 0.4%, n = 2) and blocking scans (fp = 19.6% ± 0.5%, n = 2). Interanimal differences in metabolism were noted, however, as reinforced by the result from a baseline scan in a third animal (WM688, Fig. 2B).
Pretreatment with 0.2 mg/kg of PF-05180999 did not show an obvious blocking effect (4% reduction in striatal BPND), whereas a dose of 2.0 mg/kg led to a significant decrease in striatal binding (73% reduction in BPND).
For blocking studies with PF-05180999, VT in the cerebellum increased by 20%–30%. The percentage reduction in BPND derived from MA1 was extremely close to that from SRTM analysis. In high-binding regions, decreases in BPND (SRTM) were 3% ± 10% and 72% ± 3%, respectively, for PF-05180999 doses of 0.2 mg/kg and 2.0 mg/kg. These results are summarized in Supplemental Table 2.
Target Occupancy in Cynomolgus Monkeys
Parts of the results (representative baseline images and time–activity curves) from the cynomolgus monkey study were presented previously (13). Imaging experiments with 18F-PF-05270430 in cynomolgus monkeys demonstrated uptake kinetics and blocking effects similar to those in rhesus monkeys, but brain uptake levels were higher in cynomolgus monkeys (Fig. 4). Dose-dependent blockade of 18F-PF-05270430 binding by PF-05180999 was seen (Supplemental Table 3). The relationship between the plasma concentration of PF-05180999 and striatal TO is plotted in Figure 5. The 10 blocking scans (2 animals with 5 blocking drug doses) resulted in a range of striatal TO values from 3% to 72%, which were consistent with the mean PF-05180999 plasma exposure (40.2–240.0 ng/mL). On the basis of the fitted sigmoid Emax model, PF-05180999 target binding half maximal effective concentration was estimated to be 69.4 ng/mL (90% confidence interval, 57.9–80.9 ng/mL, total plasma concentration).

(A) 18F-PF-05270430 images in cynomolgus monkey brain summed from 0 to 60 min after injection for baseline (top two images) and blocking (bottom two images, 2.0 mg/kg PF-05180999 dose) scans. (B) Corresponding time–activity curves of 18F-PF-05270430 under baseline (top) and blocking (bottom) conditions.
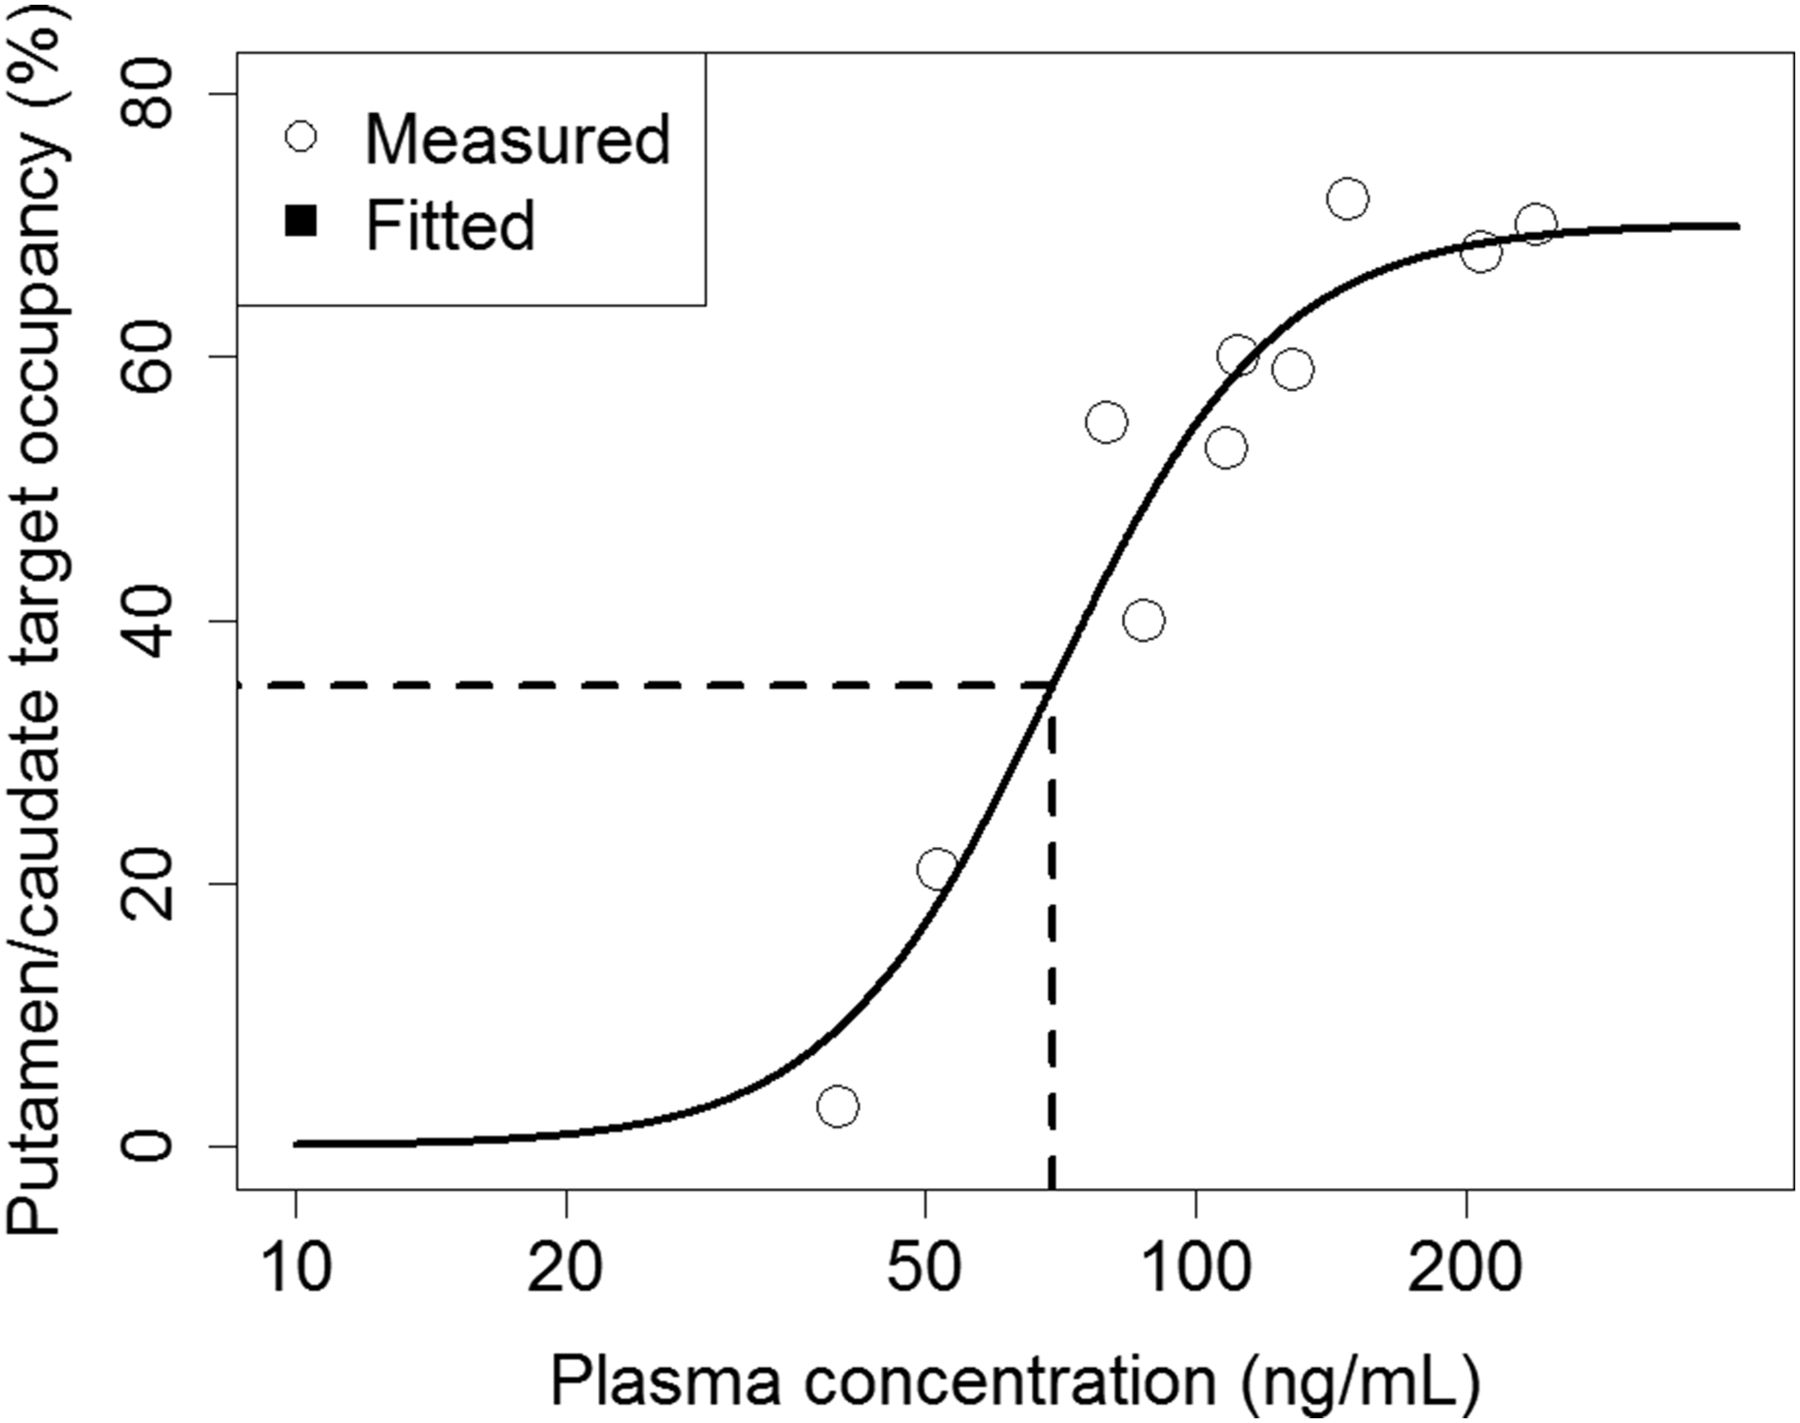
Relationship between PF-05180999 plasma concentration and striatal PDE2A occupancy in cynomolgus monkeys. ○ = measured values. Solid curve is fitted from sigmoid Emax model.
DISCUSSION
The identification, synthesis, and PET imaging characteristics of 18F-PF-05270430 have been described briefly in a previous report (13). In the current study, we present a comprehensive characterization of this novel radioligand.
The radiosynthesis of 18F-PF-05270430 involved nucleophilic displacement of the tosyl group in the azetidine ring of the precursor with 18F-fluoride (Fig. 1). Direct nucleophilic fluorination of 4-membered ring substrates is rare, and to our knowledge, this is the first example of an 18F-labeled azetidine ring in the literature. Radiofluorination in t-amyl alcohol as a solvent (method A) in the presence of quaternary ammonium salt produced 18F-PF-05270430 in higher yield than the traditional radiolabeling in polar aprotic solvents (method B) in the presence of Kryptofix-222/K2CO3. Additionally, radiofluorination in t-amyl alcohol did not require extra time (∼30 min) before radiolabeling to activate and dry the 18F-fluoride by removing a trace amount of water via azeotropic distillation.
Radioactive metabolite analysis in plasma showed comparable results in rats (38% ± 11% of parent at 30 min) and NHPs (35%–72% at 30 min). Analysis of radioactivity in rat striatum indicated that most of the radioactive metabolites did not get into the brain.
18F-PF-05270430 displayed a similar uptake pattern in the brains of rhesus and cynomolgus monkeys. In both species, it demonstrated fast uptake kinetics, with peak activity levels at 5–7 min, which were then followed by a rapid washout from all brain regions. The highest uptake levels were found in the putamen and caudate, intermediate levels in cortical regions, and the lowest in the cerebellum. Higher peak uptake levels were found in cynomolgus monkeys, which could be due to either higher PDE2A levels in the brain or slower metabolism of the ligand in plasma. However, the exact reason is not known at this time, because metabolite analysis was not performed in PET scans with cynomolgus monkeys.
In rhesus monkeys, the MA1 method with 120 min of scan data returned stable measurements of regional VT and BPND for 18F-PF-05270430. SRTM analysis also gave regional BPND values well correlated with those from MA1. The test–retest variability of binding parameters derived from both methods was good (average of ∼4% in VT and ∼13% in BPND). Hence, SRTM was used in the TO study in cynomolgus monkeys.
The cerebellum was used as a reference region, because it had the lowest VT. However, blocking studies with 0.2 and 2.0 mg/kg of PF-05180999 in rhesus monkey showed 22% and 28% increase, respectively, in MA1 cerebellum VT, which was larger than the test–retest variability of cerebellum VT. It should be noted, however, that the percentage blockade of specific binding estimated from SRTM BPND was consistent with that derived from MA1. Nonetheless, further investigation is needed to determine whether the cerebellum may be used as an appropriate reference region in the analysis of 18F-PF-05270430 binding parameters.
18F-PF-05270430 was used to successfully measure the relationship between the plasma concentration of the PDE2A inhibitor PF-05180999 and its TO in cynomolgus monkeys. Drug occupancy studies provide critical information on target engagement of therapeutic agents, which is considered one of the key factors related to the survival rate of drug candidates in clinical trials (22). Once 18F-PF-05270430 is fully validated in human subjects to measure the exposure–TO relationship of PDE2A inhibitors, it can provide valuable information for the selection of optimal doses in efficacy studies of drug candidates for treating schizophrenia patients.
CONCLUSION
In this study, we have demonstrated that 18F-PF-05270430 possesses fast kinetics in NHP brain and can be used to quantify PDE2A binding sites in vivo and measure TO of a PDE2A inhibitor. On the basis of its favorable imaging properties, this novel PDE2A PET ligand has been advanced to further evaluation in humans. Results from the human study are described in the companion paper (14).
DISCLOSURE
The costs of publication of this article were defrayed in part by the payment of page charges. Therefore, and solely to indicate this fact, this article is hereby marked “advertisement” in accordance with 18 USC section 1734. This study was sponsored by Pfizer, Inc. This publication was also made possible by CTSA grant UL1 RR024139 from the National Center for Research Resources (NCRR) and the National Center for Advancing Translational Sciences (NCATS), components of the National Institutes of Health (NIH). Its contents are solely the responsibility of the authors and do not necessarily represent the official view of NIH. Laigao Chen, Kenneth Zasadny, Marc B. Skaddan, Lei Zhang, Christopher J. Helal, Tracey L. Boyden, Cheng Chang, and Anabella Villalobos were employees of Pfizer at the time of this research. Yiyun Huang declares significant financial interest in Pfizer, Inc. No other potential conflict of interest relevant to this article was reported.
Acknowledgments
We acknowledge the expert technical support provided by the staff of the Yale PET Center. We also acknowledge contributions to rat and cynomolgus monkey studies from Pfizer colleagues including Richard Coelho, Gwen Currier, Kuo-Hsien Fan, Kyle Kuszpit, and Aijun Zhu.
Footnotes
↵* Contributed equally to this work.
Published online May 19, 2016.
- © 2016 by the Society of Nuclear Medicine and Molecular Imaging, Inc.
REFERENCES
- Received for publication December 22, 2015.
- Accepted for publication April 14, 2016.


