


Article Figures & Data
Figures
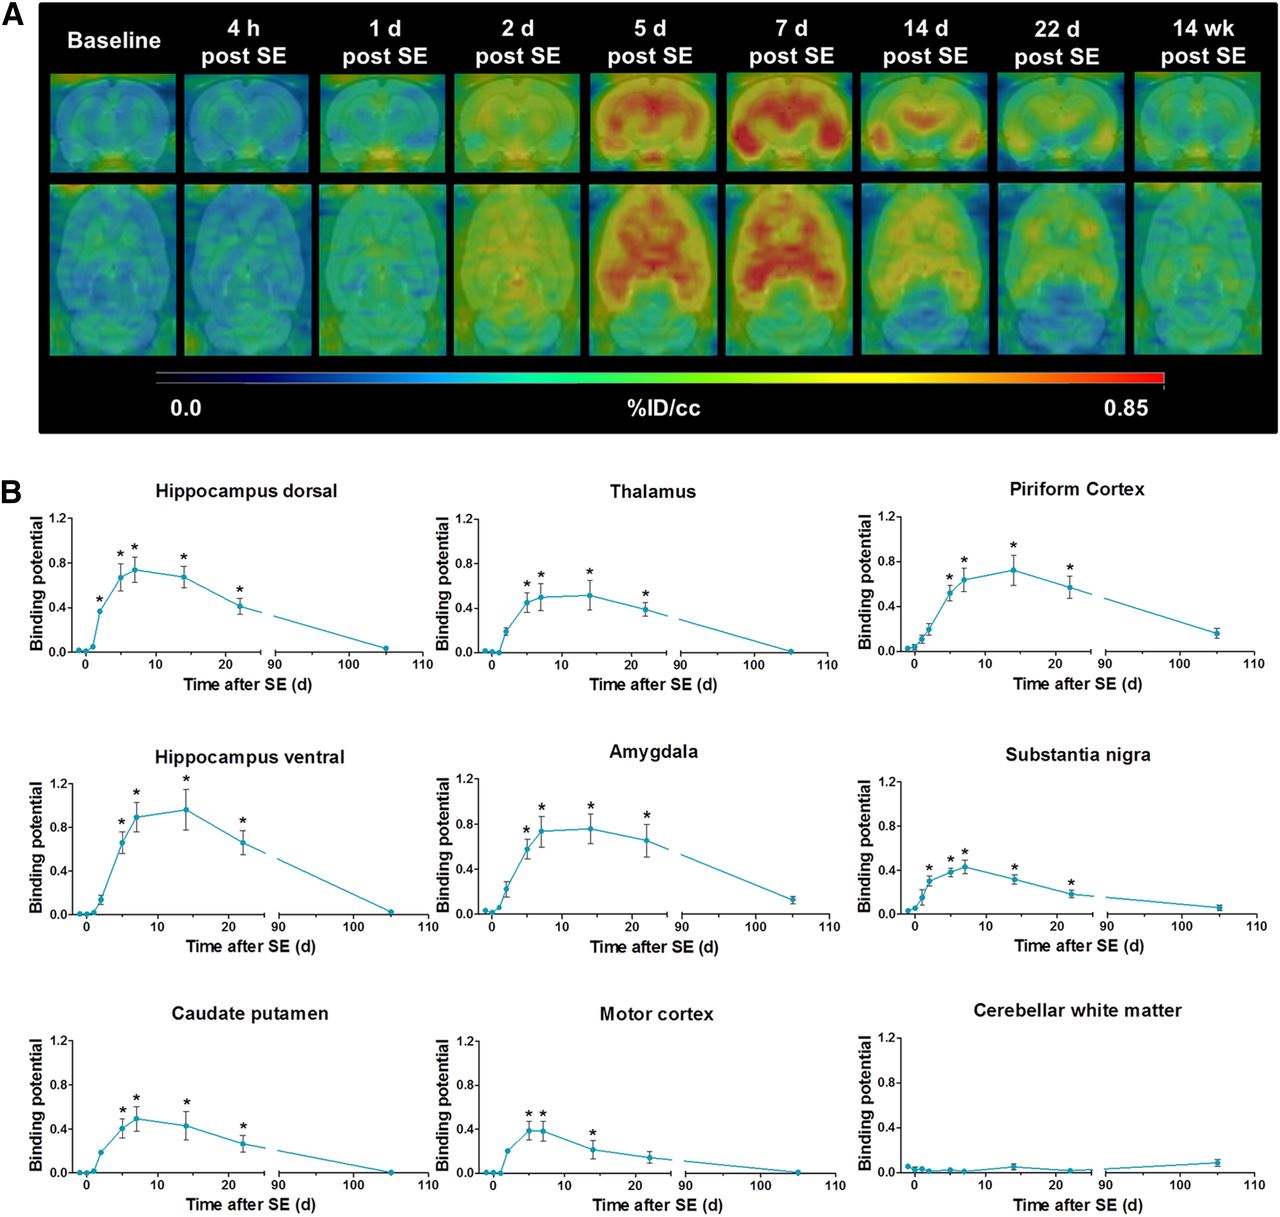
- FIGURE 1.
(A) Representative coronal and horizontal brain images of 11C-PK11195 uptake (%ID/cm3) before and at different time points during epileptogenesis. (B) 11C-PK11195 BPND analyzed by simplified reference tissue model using cerebellar gray matter as reference. Data are mean ± SEM, with a group size of n = 4–8 per time point. Statistical analysis was performed by 1-way ANOVA and Dunnett post hoc test. *Significant differences compared with baseline (P < 0.05).
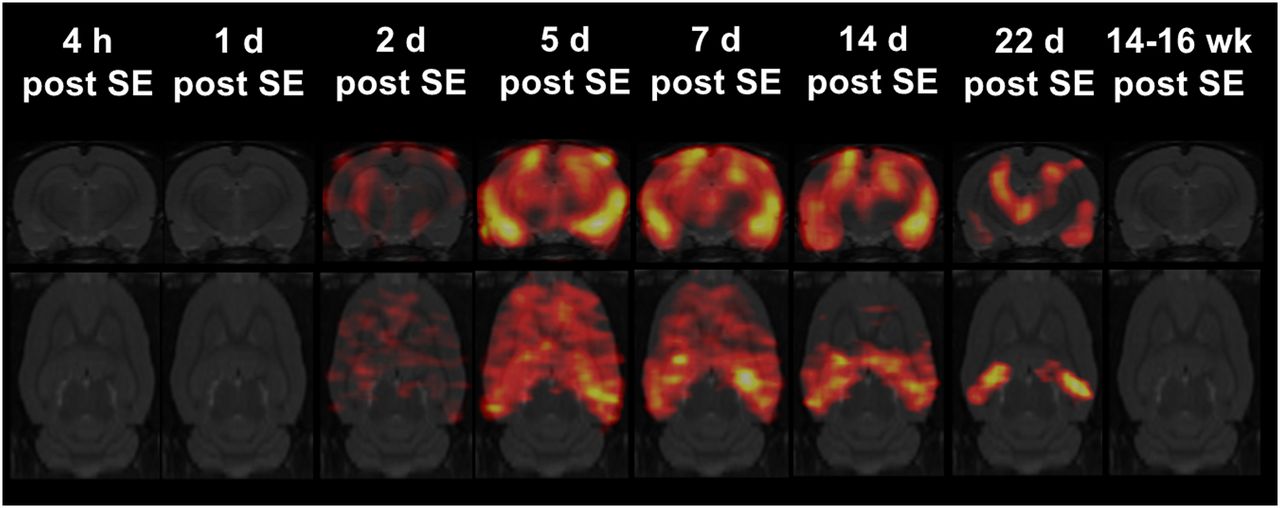
- FIGURE 2.
Statistical parametric mapping analysis of 11C-PK11195 uptake during epileptogenesis using SPM12 software. Coronal and horizontal t-maps resulting from comparisons of 11C-PK11195 uptake between baseline and each time point after SE (at baseline [n = 8]; at 4 h [n = 6] after SE; at 1 [n = 6], 2 [n = 5], 5, 7, 14 [n = 6, respectively], and 22 d [n = 7] after SE; and at 14–16 wk [n = 4] after SE; t test, P < 0.001, minimum cluster size of 100 voxels).
- FIGURE 3.
(A) Representative coronal in vitro 18F-GE180 autoradiography brain images (−3.6 mm relative to bregma) during epileptogenesis. (B) Time course of 18F-GE180 in vitro binding (Bq/pixel). Data are mean ± SEM, with a group size of n = 3–5 per time point. Statistical analysis was performed by 1-way ANOVA and Dunnett post hoc test. *Significant differences compared with baseline (P < 0.05). (C) Correlation of 11C-PK11195 in vivo BPND and 18F-GE180 in vitro binding (Pearson, P < 0.001) and correlation of 11C-PK11195 in vivo uptake and 18F-GE180 in vitro binding (Pearson, P < 0.001).
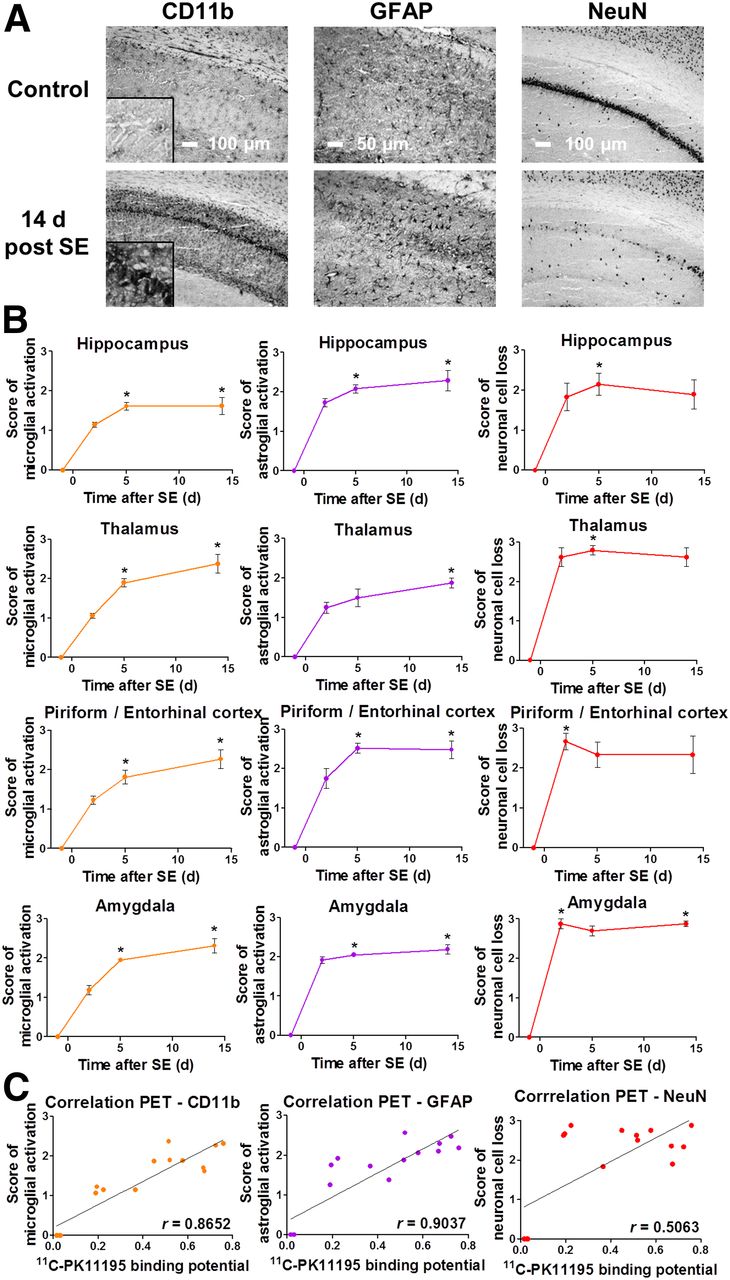
- FIGURE 4.
(A) Representative images of CD11b, GFAP, and NeuN staining in control and 14-d post-SE rats (CA1 region of hippocampus; insert for CD11b displays 4-times-higher magnification of pyramidal cell layer). (B) Semiquantitative evaluation of microglial and astroglial activation as well as neuronal cell loss during epileptogenesis. Data are mean ± SEM, with a group size of n = 3–5 per time point. Statistical analysis was performed by Kruskal–Wallis test and Dunn post hoc test. *Significant differences compared with baseline (P < 0.05). (C) Correlation of 11C-PK11195 in vivo BPND and immunohistochemistry scores (Spearman, P < 0.001 for CD11b and GFAP, P < 0.05 for NeuN).


Additional Files
Supplemental Data
Files in this Data Supplement:


