


Abstract
Pancreatic cancers are thought to be unusually hypoxic, which might sensitize them to drugs that are activated under hypoxic conditions. In order to develop this idea in the clinic, a minimally invasive technique for measuring the oxygenation status of pancreatic cancers is needed. Methods: We tested the potential for minimally invasive imaging of hypoxia in pancreatic cancer patients, using the 2-nitroimidazole PET tracer 18F-fluoroazomycin arabinoside (or 18F-1-α-d-[5-fluoro-5-deoxyarabinofuranosyl]-2-nitroimidazole [18F-FAZA]). Dynamic and static scans were obtained in 21 patients with either locally advanced or metastatic disease. The hypoxic fraction was determined in the 2-h static scans as the percentage of voxels with SUVs more than 3 SDs from the mean values obtained for skeletal muscle. Results: Hypoxia was detected in 15 of 20 evaluable patients, with the hypoxic fraction ranging from less than 5% to greater than 50%. Compartmental analysis of the dynamic scans allowed us to approximate the tumor perfusion as mL/min/g of tissue, a value that is independent of the extent of hypoxia derived from tracer uptake in the 2-h static scan. There was no significant correlation between tumor perfusion and hypoxia; nor did we see an association between tumor volume and hypoxia. Conclusion: Although pancreatic cancers can be highly hypoxic, a substantial proportion appears to be well oxygenated. Therefore, we suggest that a minimally invasive technique such as the one described in this study be used for patient stratification in future clinical trials of hypoxia-targeting agents.
Pancreatic cancers are commonly believed to be unusually hypoxic, perhaps explaining in part their aggressive biology and poor response to standard treatments (1–7) and providing a rationale for treatment protocols incorporating hypoxia-targeted agents (8). However, direct evidence rests largely on inferences drawn from their poor perfusion by radiologic contrast agents (9,10), from histologic staining for surrogate hypoxia markers (2,3), and from animal models (11). The most compelling direct evidence comes from intraoperative pO2 measurements made using the Eppendorf polarographic probe (4).
We observed a wide range in the levels of hypoxia in a series of 16 primary pancreatic cancer xenografts, with strong associations between high levels of hypoxia, rapid growth, and spontaneous metastasis formation (12), and similar heterogeneity of hypoxia in a series of patients given the 2-nitroimidazole tracer pimonidazole before pancreatectomy (13). This heterogeneity highlights the need for a minimally invasive technique to assess hypoxia in pancreatic cancer patients, enabling stratification toward the use of hypoxia-targeted agents.
Small-molecule tracers containing a 2-nitroimidazole undergo single electron reduction to form reactive radicals (14,15), and significant accumulation occurs under hypoxic conditions. They provide a versatile group of hypoxia probes that can be labeled with a radioisotope for noninvasive imaging (16–18). In experimental models, tracer uptake measured by PET correlates with the extent of hypoxia measured by invasive techniques. However, there are several challenges to applying this approach to cancer patients, including the optimization of pharmacologic properties to facilitate tracer uptake in poorly vascularized tissue and the relatively low signal generated compared with other PET tracers.
We used 18F-fluoroazomycin arabinoside (18F-1-α-d-[5-fluoro-5-deoxyarabinofuranosyl]-2-nitroimidazole [18F-FAZA]), which, similar to the recently introduced tracer 18F-HX4, has lower lipophilicity and more rapid clearance from the circulation, relative to earlier tracers (18–22). In keeping with these pharmacodynamic differences, preclinical studies have demonstrated higher tumor-to-background ratios than earlier tracers, making 18F-FAZA and 18F-HX4 attractive for clinical deployment. We used dynamic scanning to assess the kinetics of tracer uptake and estimate tumor perfusion. Hypoxic fraction (HF) was defined in relation to skeletal muscle background. In a group of 20 newly diagnosed pancreatic cancer patients, we observed striking interpatient variation in the extent of tumor hypoxia and poor correlation between hypoxia and tumor perfusion.
MATERIALS AND METHODS
Patients
The study protocol was approved by the University Health Network Research Ethics Board, and a signed written informed consent form was obtained. Patients were eligible based on previously untreated pancreatic adenocarcinoma, laboratory results within acceptable ranges, and ability to lie supine for 60 min. Patients of all disease stages meeting these criteria were eligible.
Twenty-three patients were enrolled in this study. The primary site was subsequently reclassified as duodenum in one patient, and the histology as neuroendocrine cancer in a second, leaving 21 patients with pancreatic duct adenocarcinoma. One patient moved during the static scan, rendering the results uninterpretable, and there was a technical problem saving the dynamic scan data in another patient.
Of the 20 patients with evaluable static scans, 16 were men, and the age range was 46–83 y. The pancreatic tumor location was distributed as following: pancreatic head (8 patients), neck (2 patients), body (3 patients), tail (1 patient), or uncinate process (6 patients). There were 10 patients with local disease, and 10 with metastatic disease involving liver (8), peritoneum (2), lung (1), and liver plus peritoneum (1). For the purpose of this analysis, patients were classified as having localized (10) or metastatic (10) disease.
18F-FAZA
18F-FAZA was produced by the Centre for Probe Development and Commercialization, Hamilton, Ontario, using a TRACERlab FXFN (GE Healthcare) automated synthesis unit with an overall average yield of 10% at the end of synthesis. The radiochemical purity was an average of 97% over 17 productions. The radiochemical purity and all other quality control and production processes met with good manufacturing practices and Health Canada standards.
PET/CT Scans
All PET scans were obtained in 3-dimesnional mode with a dedicated in-line PET/CT scanner (Discovery ST-16; GE Healthcare). Initially, for the purpose of attenuation correction and anatomic registration, a low-dose CT scan of the abdomen was obtained using the following parameters: 120 kV; 120–160 mAs (varied by patient weight); scan width, 2.5 mm; and speed/rotation, 11.25 mm/rotation. Immediately after intravenous injection of 18F-FAZA (5.2 MBq/kg; range, 247–496 MBq), a dynamic PET scan covering the primary tumor with a 150-mm axial field of view was obtained over 60 min. Dynamic PET images were reconstructed by binning data in 10-s intervals from 0 to 2 min, 30-s intervals from 2 to 6 min, 2-min intervals from 6 to 20 min, and 5-min intervals from 20 to 60 min. Finally, at 120 min after injection of 18F-FAZA (range, 118–126 min), a static PET scan covering the abdomen was acquired using 2 fields of view with an 11-slice overlap and actual length of 268 mm.
The primary tumor, normal pancreas, right and left lobes of the liver, and volumes of interest from metastatic sites when present were contoured by an experienced radiologist using the coregistered PET and CT. Skeletal muscle (paravertebral lumbar) served as the reference tissue. SUVs were calculated as the 18F decay-corrected signal intensity normalized by the injected isotope activity per body weight.
HF
HF was calculated using the method described by Mortensen et al. (23,24). For each patient, a voxel-based histogram of 18F-FAZA SUV in normal muscle was calculated and normalized by dividing each voxel SUV by the mean muscle SUV. All of the normalized voxel SUVs were pooled across the 20 patients to form a normalized muscle SUV population distribution with the mean equal to unity. A tumor voxel was defined as being hypoxic if the ratio of its SUV to the mean muscle SUV of the individual patient was greater than 3 times the normalized muscle population SD above the mean (i.e., 1), corresponding to a threshold of 1.35. Mortensen et al. found the equivalent threshold of 1.4 in their study of head and neck squamous cell carcinoma (23). The HF was defined as the number of hypoxic voxels in the region of interest, divided by the total number of voxels. Knowing the voxel size, this result can also be expressed as the hypoxic volume (23). However, we prefer the term hypoxic fraction in alignment with our previous studies and the traditional thinking about hypoxic fraction in relation to radiation treatment response.
Tumor Perfusion Derived from 2-Compartment Model
Thorwarth et al. (25) modeled the behavior of 18F-fluoromisonidazole (18F-FMISO) as 3 coupled kinetic stages from injection to uptake. In stage 1, during the initial minutes after injection, there is fast exchange of 18F-FMISO between blood and the surrounding interstitial compartment driven by the concentration gradient of the tracer. During this early stage, there is a rapid increase of the tracer in the tumor vasculature driven by perfusion, and the tracer concentration gradient between blood, and the interstitium is therefore strongly dependent on perfusion. The tracer subsequently diffuses across the interstitial space (stage 2) and finally is taken up by hypoxic cells (stage 3). 18F-FAZA and 18F-FMISO are expected to have similar kinetic behavior in the initial phase (stages 1 and 2).
On the basis of this prior work, we explored the tracer kinetics in the first few minutes after 18F-FAZA injection as a marker of tumor perfusion using a 2-compartment model comprising blood and extravascular space. The formula governing 18F-FAZA exchange between these 2 compartments is Eq. 1where Q is the 18F-FAZA concentration in tumor in KBq/g, Ca(t) is the 18F-FAZA concentration in arterial blood in KBq/mL, K is the forward transfer constant in mL/min/g, k is the backflux constant in 1/min, and Vb is the blood volume in mL/g. Parameter K is a combination of perfusion and permeability surface area product; it is equivalent to Ktran in the MR literature used as a surrogate of perfusion (26). As shown in Appendix A, K can be expressed as the product of perfusion (F) and extraction fraction (E) (27,28). It has been shown that pancreatic cancer is poorly perfused (7), therefore, E can be approximated to unity and K to perfusion. To perform the calculation for K, Q(t) was taken as the average intensity of the 3-dimensional tumor volume over time. As for Ca(t), we used the partial-volume correction proposed by Cook (29) that Ca(t) = A[C(t) – B(t)] + B(t) (Appendix B), where A is the blurring correction factor and B(t) is the background signal.
RESULTS
Hypoxia in Primary Tumor: SUVs and HF
Figure 1A shows representative images of 18F-FAZA–avid and 18F-FAZA–negative primary tumors. 18F-FAZA uptake expressed as SUVmax ranged from 0.88 to 1.75. Figure 1B shows the distribution histogram of SUVs to mean muscle SUV ratio for individual voxels in a primary tumor. Overlaid on this histogram are the corresponding values obtained from adjacent skeletal muscle, with a cursor set 3 (normalized) SDs from unity. The percentage of tumor voxels exceeding this value defines the HF. Figure 1C shows the values for individual tumors, expressed as SUVmax and HF, in rank order. Compared with SUV, the HF shows a wider range among patients and appears to better discriminate differences in hypoxia.
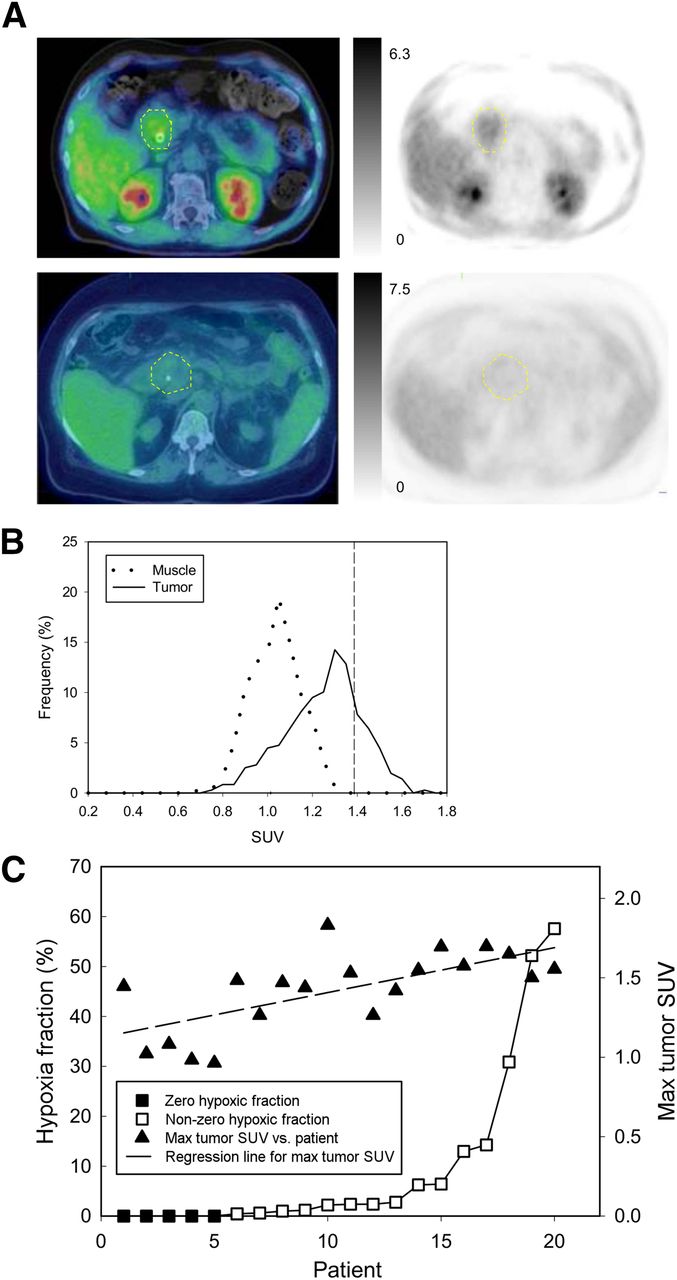
(A) 18F-FAZA PET images with intensity bars for SUV (left) and fused images (right) obtained from primary pancreatic cancers (dashed yellow lines) showing high (top) and low (bottom) tracer uptake. Biliary stents can be seen in each patient. (B) Histograms of SUV to mean muscle SUV ratios for individual voxels from primary tumor (solid line) and from skeletal muscle (dotted line). HF is derived as percentage of tumor voxels exceeding 3 SDs of the mean value for skeletal muscle, indicated by cursor. (C) Results for tumor SUVmax and HF obtained from 20 patients with static scans, arranged in rank order of HF.
Comparison of Tumor Versus Normal Pancreas
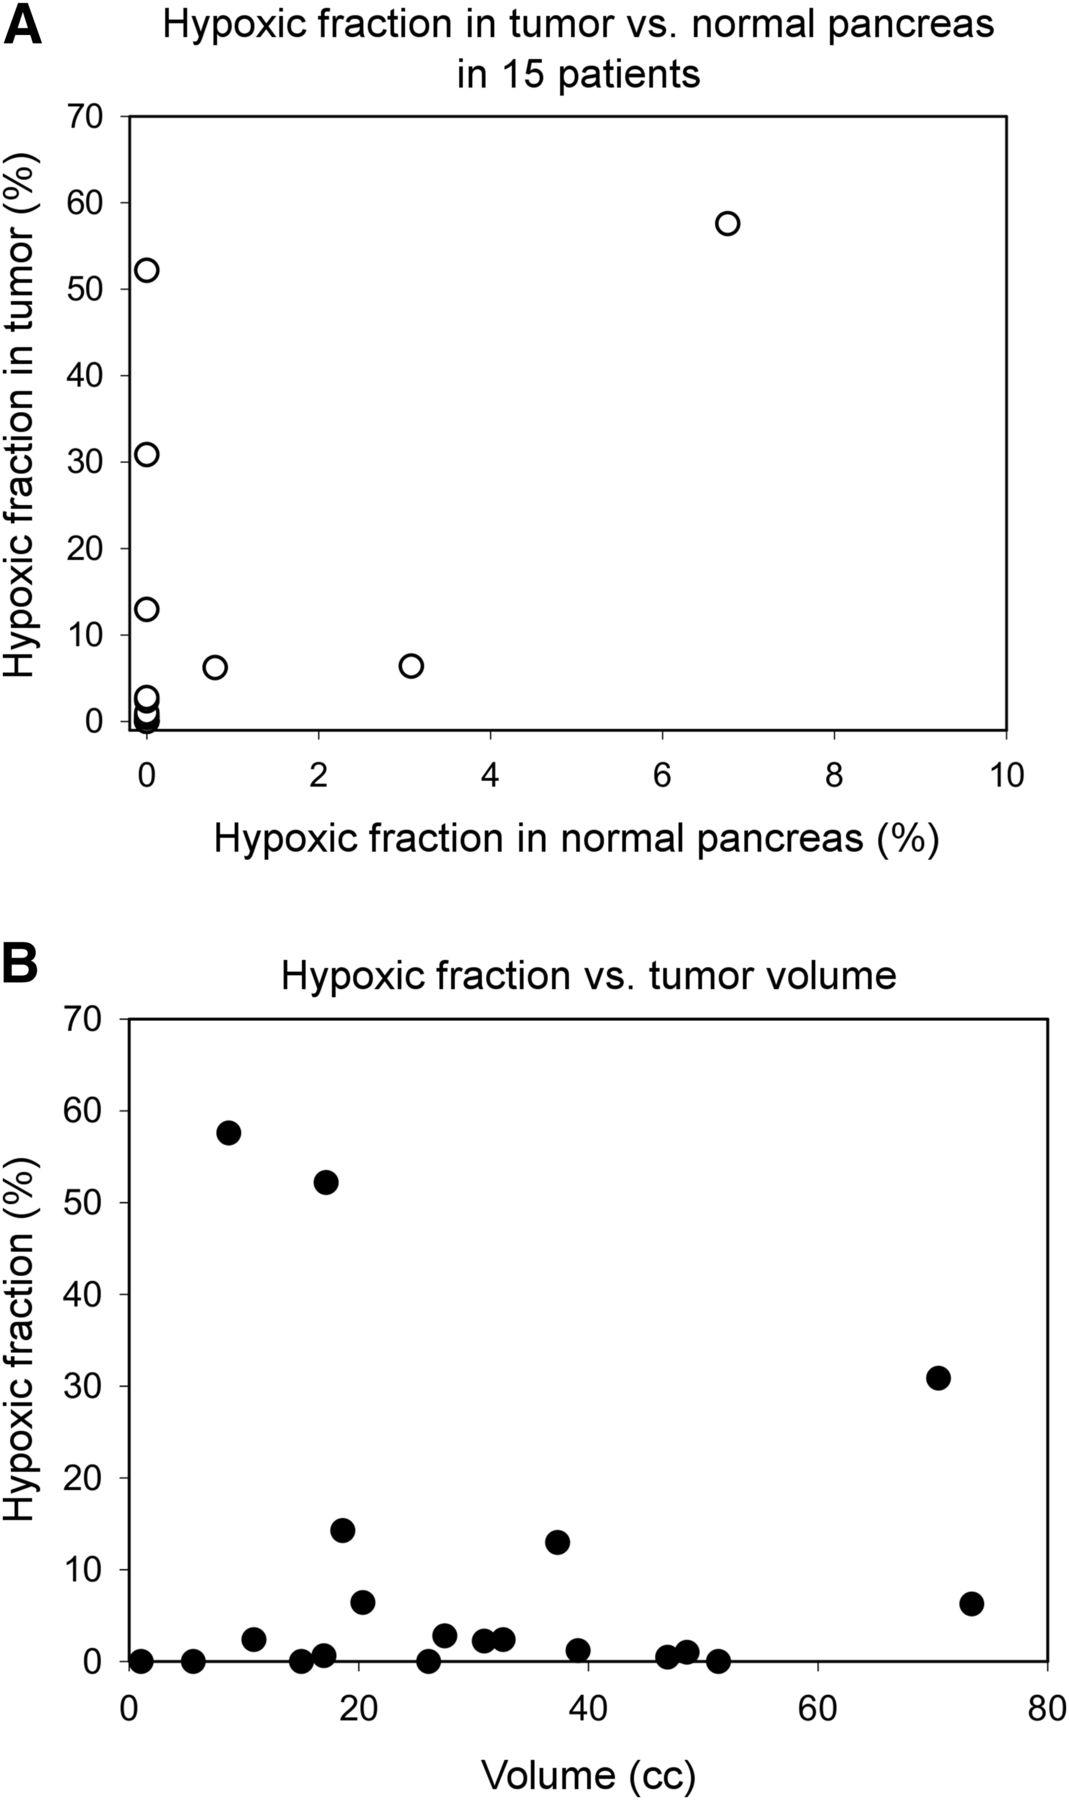
We could not contour normal pancreas in 5 of 20 patients because of atrophy or other abnormality. Only 5 of 15 normal pancreata had nonzero HF, with values of 0.2%, 1.6%, 3.2%, 6.7%, and 12.2% that were considerably less than the corresponding tumor tissue (Fig. 2A).

(A) HF of primary tumor plotted against HF obtained for corresponding normal pancreas. (B) HF plotted against tumor volume assessed by CT.
HF Versus Tumor Volume
The volumes of the contoured primary tumors ranged between 1 and 71 cm3, and there was no significant correlation between the size of the tumor and extent of hypoxia (Fig. 2B).
Comparison of Localized Versus Metastatic Disease
Figure 3A shows the distribution of HF for patients with localized compared with patients with overtly metastatic disease. All 5 cases with zero HF had localized disease, and there was a nonsignificant trend toward greater hypoxia in primary tumors that showed metastatic disease (Fig. 3B).

(A) HFs in rank order, showing tumors that showed no radiologic evidence of metastases and those with overt metastatic disease. (B) Group means of HF for tumors with and without evident metastases. Error bars are SEM; difference is nonsignificant.
18F-FAZA Uptake at Metastatic Sites
We asked whether the levels of hypoxia in metastatic sites were comparable to those seen in the corresponding primary tumor. As seen in Figure 4, tracer uptake occurred in normal liver, consistent with the low pO2 levels that occur in perivenous regions, and as a result liver metastases were often difficult to visualize in the 18F-FAZA images. Eight patients had liver metastases identified on contrast-enhanced CT scans done within 1 wk of the 18F-FAZA scan, and in 4 cases these could be contoured in the nonenhanced CT scans. In all cases, the SUVs for the metastases were similar to those obtained for the primary tumor, and this was also the case in a patient with extensive peritoneal metastases, illustrated in Figure 4.
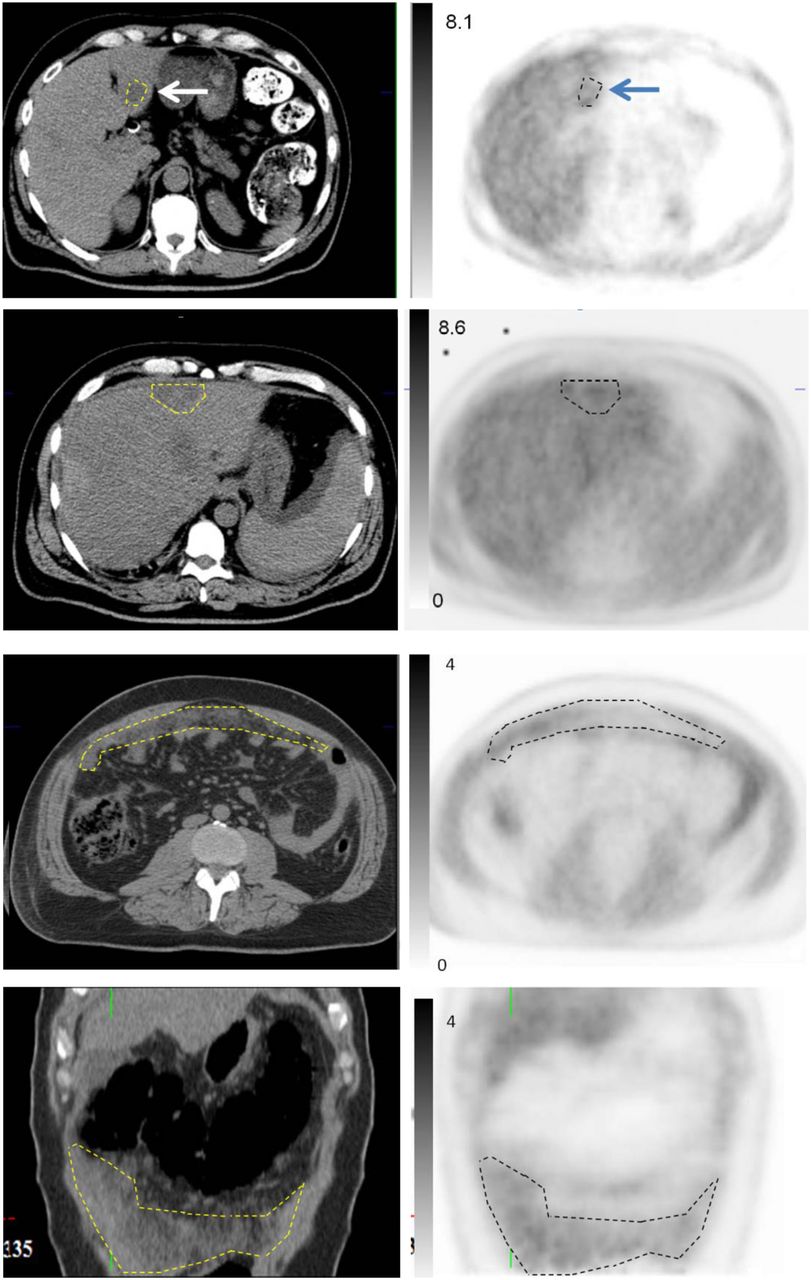
18F-FAZA uptake at metastatic sites. Upper 4 panels are representative sections showing liver metastases (arrows). High background uptake in normal liver obscures uptake by metastases in PET images, but these could be contoured using CT image, allowing measurement of 18F-FAZA uptake. Lower 4 panels are axial and coronal sections from patient with advanced peritoneal metastases, for which increased 18F-FAZA uptake is easily seen in PET images. SUVs represented in intensity bars.
Tumor Perfusion
A nonlinear curve-fitting method was used to solve Equation 1 over the first 5.25 min of dynamic data to obtain the parameter K (30), which approximates perfusion as pancreatic cancer is poorly perfused (7). Figure 5 shows plots of tumor perfusion from the dynamic scans versus SUV and HF at 2 h from the corresponding static scan, respectively, for the 19 patients for whom dynamic data were available. The graphs show no significant correlation between perfusion and either SUV or HF.
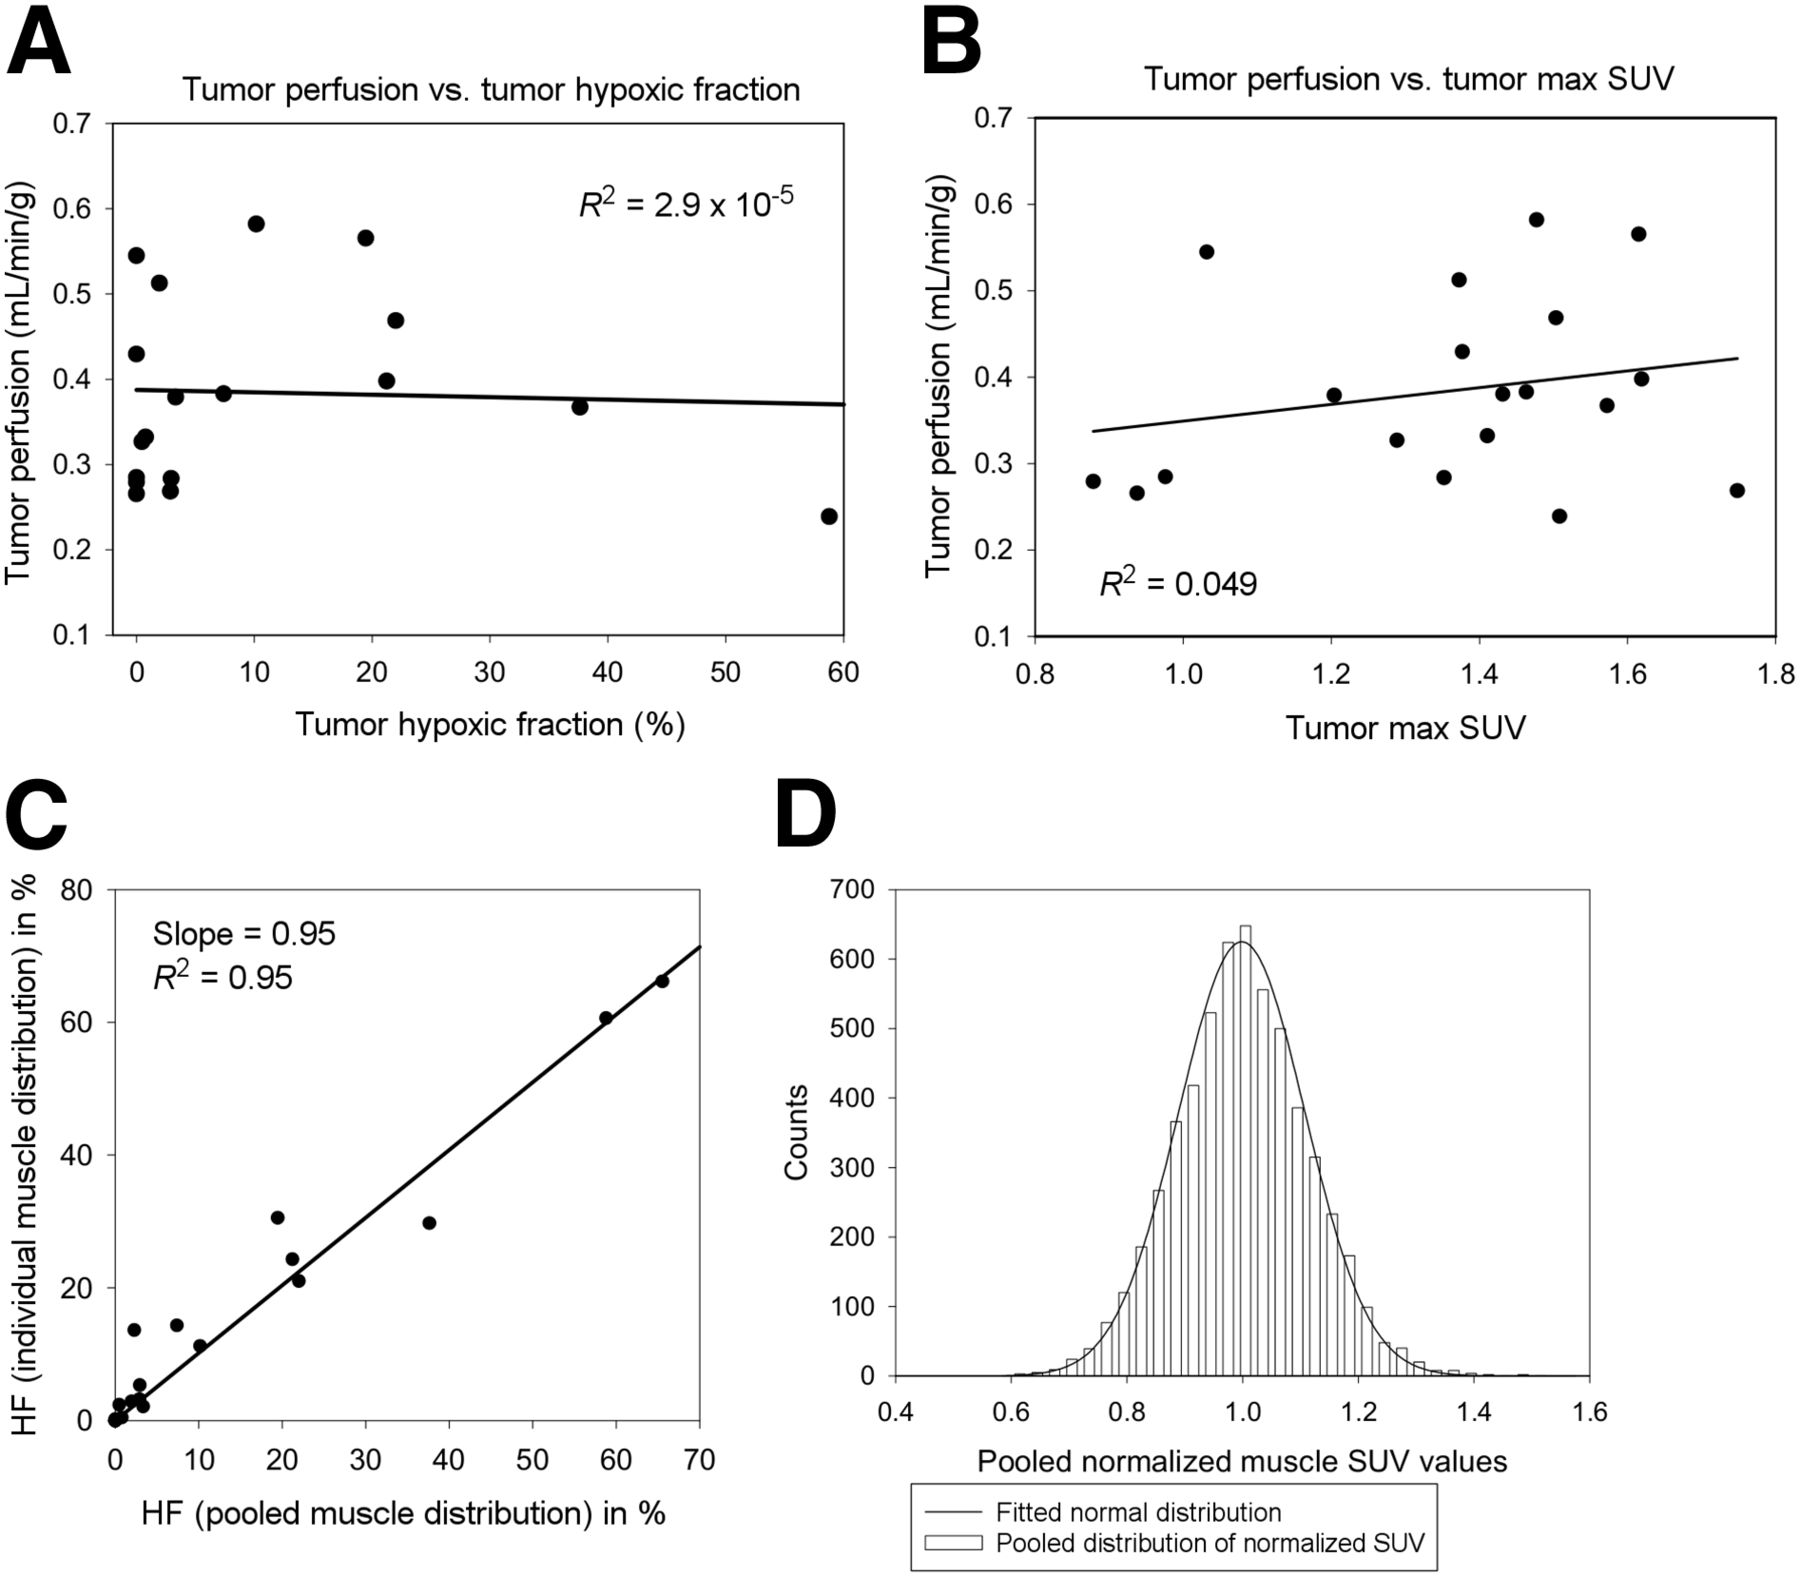
(A and B) Tumor perfusion, derived from dynamic PET scans, plotted against 18F-FAZA uptake in corresponding static scan, expressed as SUVmax and HF. (C) Correlation between HF values calculated using individual muscle distribution for defining threshold vs. those using pooled muscle distribution. There is strong correlation between the 2 methods (R2 = 0.95). (D) Pooled normalized SUV distribution over 20 patients consisting of 5,705 voxels in total. Data fit normal distribution function.
DISCUSSION
There is increasing recognition that the extent of hypoxia in solid tumors is heterogeneous and that hypoxia is associated with aggressive features such as local invasion and metastasis, as well as resistance to standard treatments (12,31–38). Therefore, there is interest in the development of agents that target hypoxic cancer cells. The early compounds were developed as radiation sensitizers (39). However, hypoxia also occurs in metastases, and the development of agents that are directly cytotoxic to hypoxic tissue extends the field to include the systemic treatment of cancer (8,33,40,41). Given that hypoxia-targeting drugs are potentially toxic to normal tissues, and of greatest benefit in highly hypoxic tumors, there is a need for standardized techniques for patient stratification and monitoring.
The tumor uptake of 18F-FAZA varied considerably between patients, with 15 of 20 showing detectable hypoxia ranging from less than 5% to greater than 50% HF, similar to the recent report by Klaassen et al. using the tracer 18F-HX4 (21). The pattern is similar to that seen in our study of primary pancreatic cancer xenografts, in which high levels of hypoxia were associated with increased metastatic potential (12). In that regard, all 5 tumors in the present series with undetectable 18F-FAZA uptake showed no evidence of distant metastases. We were interested to determine whether the levels of hypoxia in distant metastases were similar to those in the corresponding primary tumor, given that hypoxia-targeting drugs such as TH-302 are now being tested in patients with metastatic disease (41). It was technically challenging to measure 18F-FAZA uptake in liver metastases because of the high background and respiratory motion, and further work is needed in this area. However, the limited data available from this study suggest that the levels are comparable to those in the primary tumor. Although it might be expected that large, poorly perfused tumors would have a relatively high HF, there was no significant correlation between tumor volume or perfusion and 18F-FAZA uptake in the present study.
Dynamic scans were acquired in the first 60 min in the imaging protocol, which is investigational in nature, but analysis was done only up to 15 min. The analysis of dynamic data was performed over the first 1.25, 5.25, and 15 min separately. The average K values obtained at these times were 0.492 ± 0.146, 0.384 ± 0.108, and 0.346 ± 0.110 mL/min/g, respectively. The correlation of K values between 1.25-min data and that of 15 min was moderate (r = 0.55) whereas the correlation of K between the 5.25- and 15-min duration was strong (r = 0.97). Because the analyses of the dynamic data over 5.25 and 15 min gave consistent results, this implies that the 2-compartment model can be used to consistently describe the perfusion kinetics of 18F-FAZA over the temporal window between 5.25 and 15 min, whereas the 1.25-data only are not sufficient for fitting the model. In this article, we reported the results for K based on the analysis over 5.25 min. Analysis of different data acquisition durations is useful in protocol designing for dynamic PET scanning because it is desirable to have a protocol with minimal scan time for optimizing PET scanner use in the clinic as well as for patient comfort. The result suggests that a scanning time of around 5 min is appropriate if K is to be measured.
The average perfusion of pancreatic tumors in this cohort was estimated to be 0.384 ± 0.108 mL/min/g. It is within the range of published perfusion values in pancreatic cancer using 15O-H2O described by Kubo et al. (42) (0.249 ± 0.076 mL/min/g) and Komar et al. (10) (0.457 ± 0.185 mL/min/g). The tumor perfusion values reported in this article were approximated from the forward transfer constant K of the 2-compartment model. It was assumed that the tumor perfusion is low (flow limited), or that E can be approximately unity. Mullani used a first-pass method for perfusion measurement in a dynamic 18F-FDG PET study and compared the results with perfusion measured with 15O-H2O in the same cohort of patients (43). They concluded that 18F-FDG has an E value of approximately 0.86. E for 18F-FAZA may have a value close to that of 18F-FDG, as their molecular weights are similar (181.2 for 18F-FDG and 247.2 for 18F-FAZA). Further investigation is required to determine the extraction fraction of 18F-FAZA.
The premise of the method for HF calculation is that muscle uptake of 18F-FAZA is used as a baseline. Provided 18F-FAZA uptake in muscle is normally distributed, the probability of any voxel exceeding 3 times the SD is less than 0.1%. Therefore, 3 times the SD above the normalized mean muscle SUV was used as a threshold for classifying a voxel in the tumor to be hypoxic. In this study, we followed the method by Mortensen et al. (23) using the pooled normalized muscle distribution to set the threshold. One could argue to use the individual muscle distribution for defining the threshold instead. We performed the HF calculation on the basis of individual muscle distribution as well, along with calculation based on pooled normalized muscle distribution described above. Figure 5C shows the correlation of HF values obtained from individual versus pooled distribution, and it demonstrates a strong correlation (R2 = 0.95). Except 2 patients, all maintained an HF value above or below the median HF between the 2 methods. We prefer to use the method with pooled distribution because it provides a better estimate of the statistics in the normal distribution, which is assumed in the HF calculation. Figure 5D shows the histogram distribution of the pooled normalized SUV in muscle along with the normal distribution fit.
CONCLUSION
The important conclusions from this study are that dynamic 18F-FAZA PET imaging can be used to estimate perfusion and HF in patients with pancreatic cancer, that perfusion and HF vary substantially among patients, and that perfusion and HF are not correlated in these tumors. The results suggest that individuals showing high levels of hypoxia might derive benefit from the incorporation of hypoxia-targeting agents, whereas it is unclear if this would be the case in those showing low levels of hypoxia. Therefore, we suggest that a minimally invasive technique such as the one described in the present article is used for patient stratification in future clinical trials of hypoxia-targeting agents treating pancreatic cancer.
Appendix A
Forward transfer constant (K) is related to blood perfusion (F) and extraction fraction (E) as follows: Eq. 1Aand E can be expressed as (27,28):
 Eq. 2Awhere PS is the permeability surface area product. For tissue with low perfusion, that is, F<<PS, E ≈ 1 or K ≈ F (44).
Appendix B
We approximated the arterial input function as that measured in the descending aorta. Direct concentration measurement of aorta on the PET images suffers from a blurring effect of the concentration in the aorta and that in the background tissue. For zero 18F-FAZA concentration in the background, a large region of interest (ROI) encompassing the blurred aorta will be able to account for all the activity in the aorta. The corrected arterial concentration (Ca) can be calculated as: Eq. 1Bwhere Aaorta is the area of aorta accurately defined on CT and AROI is the area of the large ROI, respectively.
For non-zero background in surrounding tissue, we approximated blurring of the background (B) as a constant over the vicinity of aorta. Therefore, the corrected arterial concentration is given by: Eq. 2Bwhere A = Aaorta/AROI.
DISCLOSURE
The costs of publication of this article were defrayed in part by the payment of page charges. Therefore, and solely to indicate this fact, this article is hereby marked “advertisement” in accordance with 18 USC section 1734. Research support was provided by the Haughton Fund for Pancreatic Cancer Research, the Princess Margaret Cancer Foundation, a Hypoxia Program project grant, and a program project grant funded by the Terry Fox Research Institute. No other potential conflict of interest relevant to this article was reported.
Footnotes
↵* Contributed equally to this work.
Published online Jan. 14, 2016.
- © 2016 by the Society of Nuclear Medicine and Molecular Imaging, Inc.
REFERENCES
- Received for publication September 30, 2015.
- Accepted for publication November 23, 2015.


