


Abstract
The aim of the study was to investigate DNA double-strand break (DSB) formation and its correlation to the absorbed dose to the blood in patients with surgically treated differentiated thyroid cancer undergoing their first radioiodine therapy for remnant ablation. Methods: Twenty patients were included in this study. At least 7 peripheral blood samples were obtained before and between 0.5 and 120 h after administration of radioiodine. From the time–activity curves of the blood and the whole body, residence times for the blood self-irradiation and the irradiation from the whole body were determined. Peripheral blood lymphocytes were isolated, ethanol-fixed, and subjected to immunofluorescence staining for colocalizing γ-H2AX/53BP1 DSB-marking foci. The average number of DSB foci per cell per patient sample was analyzed as a function of the absorbed dose to the blood and compared with an in vitro calibration curve for 131I and 177Lu established previously in our institution. Results: The average number of radiation-induced foci (RIF) per cell increased over the first 3 h after radionuclide administration and decreased thereafter. A linear fit from 0 to 2 h as a function of the absorbed dose to the blood agreed with our in vitro calibration curve. At later time points, RIF numbers diminished, along with dropping dose rates, indicating progression of DNA repair. Individual patient data were characterized by a linear dose-dependent increase and a biexponential response function describing a fast and a slow repair component. Conclusion: With the experimental results and model calculations presented in this work, a dose–response relationship is demonstrated, and an analytic function describing the time course of the in vivo damage response after internal irradiation of patients with 131I is established.
- γ-H2AX
- 53BP1
- biological dosimetry
- radioiodine therapy
- DTC
- absorbed dose to blood
- dose response
- DSB focus assay
- DNA damage
- 131I
- differentiated thyroid cancer
After total thyroidectomy for differentiated thyroid cancer (DTC), patients generally receive one or more treatments with high activities of 131I. The purpose of the initial radioiodine therapy after surgery is to ablate remnant thyroid tissue and to effectively treat any iodine-avid metastases (1,2). Because patients with DTC generally do not undergo chemotherapy or other radiotherapy before radioiodine therapy, this patient group is ideally suited for the investigation of the DNA damage in blood lymphocytes induced by protracted, nearly homogeneous whole-body irradiation. In this setting, all organs, including the blood, are irradiated by β-particles emitted from circulating 131I and from penetrating γ-radiation originating from activity dispersed throughout the body. The absorbed dose and dose rate to the blood is assessed by defining the time–activity curves in the blood and the whole body, integrating the corresponding time–activity curves and calculating the absorbed dose according to European Association of Nuclear Medicine (EANM) standard operating procedure (SOP) for DTC (3).
Ionizing radiation not only destroys the malignant iodine-avid cells but also damages healthy tissues and cells. Among the elicited damage, DNA double-strand breaks (DSBs) are the most crucial lesions for the healthy tissue because their repair can be difficult, and faulty DNA repair leads to mutations, chromosomal aberrations, or cell death.
In general, DSBs evoke a DNA damage response during which the DSB signal is amplified and several repair routes are induced involving proteins that can serve as biomarkers (4).
The formation of a DSB in nuclear chromatin results in the rapid phosphorylation of the histone H2 variant H2AX, then called γ-H2AX (5–7). Furthermore, DSBs also recruit the damage sensor protein 53BP1 to the chromatin around DSBs (8–12), leading to 53BP1 and γ-H2AX colocalization in the chromatin surrounding a DSB (8,10,13–15). By immunofluorescence staining with γ-H2AX and 53BP1 antibodies those biomarkers can be addressed as microscopically visible fluorescent foci (14–16). With progression of DSB repair, γ-H2AX and 53BP1 foci disappear (17).
At present, there are only two studies that quantified radiation-induced DNA damage foci formation after therapy of DTC with the isotope 131I, either using radiation-induced colocalizing γ-H2AX and 53BP1 foci (18) or using γ-H2AX foci alone (19). More recent studies addressed γ-H2AX foci formation after 177Lu therapy of neuroendocrine tumors (16,20). In these studies the authors observed elevated levels of radiation-induced DNA damage foci after treatment, but a clear dose–response relationship could only be established in one study (16).
The aims of this study were therefore, to compare the in vivo dose response in the first hours after therapy with an in vitro calibration curve established recently in our laboratory (15), and to describe the temporal and dose-dependent behavior of the radiation-induced foci (RIF) in radiation treatment–naïve patients after their first radioiodine therapy (RIT).
MATERIALS AND METHODS
Research Design and Subjects
Patients referred to our center for initial treatment with radioiodine after surgery for differentiated papillary or follicular thyroid carcinoma were included in this study. Before treatment, each patient received 3–8 MBq of 131I for thyroid bed tracer uptake measurement to screen for thyroid remnants large enough to require reoperation. Patients with a 24-h iodine uptake of more than 5% in the thyroid bed were excluded from the study. Higher uptake in the thyroid bed would affect the dosimetry calculations. No patient had a history of leukemia or lymphoma or radio- or chemotherapy and none underwent an x-ray examination or, other than the remnant tracer uptake measurement, scintigraphy within 3 mo before radioiodine therapy. The research plan was presented to the ethics committee of the Medical Faculty of the University of Würzburg (Az: 112/11). The ethics committee approved the study by stating that there were no objections to the conduct of the study. Before the study, all patients gave their written informed consent. For treatment, the patients were hospitalized for at least 48 h, normally up to 3–4 d.
Blood Sampling and Activity Determination of Blood Samples
Blood samples were drawn in all patients before administration and nominally at 0.5, 1, 2, 3, 4, 24, 48, and up to 168 h after administration using Li-Heparin blood collecting tubes (S-Monovette). For an exact quantification of the blood activity concentration, an aliquot of 0.1 mL of each heparinized blood sample was measured in a well counter (Canberra) or in a high-purity germanium detector (Canberra). The counting efficiencies of both detectors were determined by repeated measurements of a National Institute of Standards and Technology–traceable standard. The measured values were decay-corrected to the time of blood drawing. The statistical error of the activity determination was less than 1% for the blood samples taken at the first day. The statistical error increased for later time points but was always less than 5%.
Blood Sample Preparation for DNA Damage Focus Assay
The separation and fixation of the white blood cells and the counting of the identified DSB foci followed the protocol described in detail in Eberlein et al. (16), and the DSB foci staining was performed according to Lassmann et al. (18) and Lamkowski et al. (14). Briefly, white blood cells were obtained by density centrifugation (CPT Vacutainer tube; BD) and fixed in ice-cold 70% ethanol. Samples were kept at −20°C until immunostaining for γ-H2AX and 53BP1 using primary antibodies against γ-H2AX (Millipore) and 53BP1 (Acris Antibodies) that were detected with secondary goat antimouse Alexa-488 and donkey antirabbit Cy3-labeled antibodies (both Dianova), respectively. The number of DSB repair protein foci was analyzed by an experienced investigator (HS) in lymphocyte nuclei (n = 100 peripheral blood lymphocytes/sample) by manual focus counting using a red/green double-band pass filter (AHF) and 63× lens of a Zeiss Axioimager 2i fluorescence microscope equipped with the ISIS fluorescence imaging system (MetaSystems).
Counting the blood sample before therapy gave us the baseline background foci rate. This rate was subtracted from the DNA foci counts obtained after irradiation, which resulted in the average number of RIF/cell.
Measurement of Whole-Body Retention
Whole-body activity retention was determined in all patients by external dose rate measurements according to the methodology described by the EANM SOP for patients with DTC (3). Dose-rate measurements were performed by use of a ceiling-mounted shielded survey meter (automess GmbH) at a fixed distance of 2.5 m above the patients’ beds. The first patient measurement was performed approximately 15 min after 131I application and at least 2 times per day thereafter. Data were normalized to the first measurement.
Calculation of Time-Integrated Activity Coefficients and Absorbed Doses
The calculation of the time-dependent time-integrated activity coefficients for the total body (tb) (τtb (t)) and the blood (bl) (τmL of bl (t)) and the absorbed doses ( bld (t)) after administration of 131I were performed according to the EANM SOP (3) and as described previously (16). These coefficients are obtained by integrating the respective time–activity curve from 0 to the time point t (instead of infinity). Because we took multiple blood samples and measured the retention of the whole body up to 168 h after therapy, the corresponding time–activity curves for 131I were fitted by bi- or triexponential functions.
Because the activity was administered orally, the iodine washout from the stomach to the blood circulation needs to be considered. According to Leggett (21) the iodine uptake is 5% per minute. Therefore, we assumed a linear iodine uptake within the first 20 min for the time–activity curve of the blood, and the bi- or triexponential fits were performed from t = 20 min. The absorbed dose  after 20 min was calculated as follows:
 Eq. 1
Eq. 1
A0 denotes the administered activity, and wt represents the patient’s weight in kg.
Modeling Time-Dependency of Focus Induction and Disappearance
The modeling of the time-dependency of the DSB focus induction and disappearance followed the method described previously (16). The number of RIF/cell as a function of the time-dependent absorbed dose and the disappearance of the foci are described in the early hours of treatment by a linear dose-dependent increase, with the parameters taken from our in vitro calibration curve (15) and a biexponential decay representing DNA repair: Eq. 2
Eq. 2
N(t) is the number of RIF/cell at time t. a,b are constants taken from the in vitro calibration curve (15); they describe the number of RIF/cell as a linear function of the time-dependent mean absorbed dose  bl (t) (a = 0.0363 RIF/cell; b = 0.00147 RIF/cell·mGy−1). The in vitro calibration curve was generated with blood samples of volunteers who were irradiated internally with 131I and 177Lu with absorbed doses up to 100 mGy. The number of RIF/cell increased linearly with the absorbed dose to the blood.
M is the adjustable parameter to account for the variability in the patient dosimetry with respect to the linear in vitro calibration function (15), k is the adjustable parameter describing the fraction of damage assigned to different repair rates, and λ and υ are the patient-specific adjustable parameters describing the decay rate of foci.
Statistics
Origin (version 9.1G+2015G; Origin Lab Corp.) was used for data analysis and statistical evaluation. Normal distribution of the datasets was tested using the Shapiro–Wilk test. Changes in RIF/cell value sets at different time points were compared by the paired Wilcoxon signed-rank test. Differences were considered to be significant if the P value was less than 0.05.
RESULTS
Patients
Twenty patients (8 men and 12 women) with a mean age (±SD) of 55.1 ± 17.1 y were recruited and included in this study. More details on the patients’ demographics are given in Supplemental Table 1 (supplemental materials are available at http://jnm.snmjournals.org). Most of the patients (n = 16) presented with papillary thyroid cancer. The patients received a mean of 3.5 ± 0.3 GBq of 131I-iodide for their first therapy. All patients except 1 (patient 35) were treated while being hypothyroid.
Thereafter, patients were admitted to our ward and hospitalized for at least 3 d (15 patients) until the external dose rate dropped below 3.5 μSv/h at a distance of 2.5 m during their hospital stay. Most of the blood samples and measurements were taken during this time period. For some patients, final blood withdrawal and dose rate measurements were performed when they were scheduled for their final posttherapeutic gamma camera imaging. All patients responded well to the treatment or showed disease stabilization at follow-up. No therapy or study-related adverse events were observed.
DNA Damage Foci
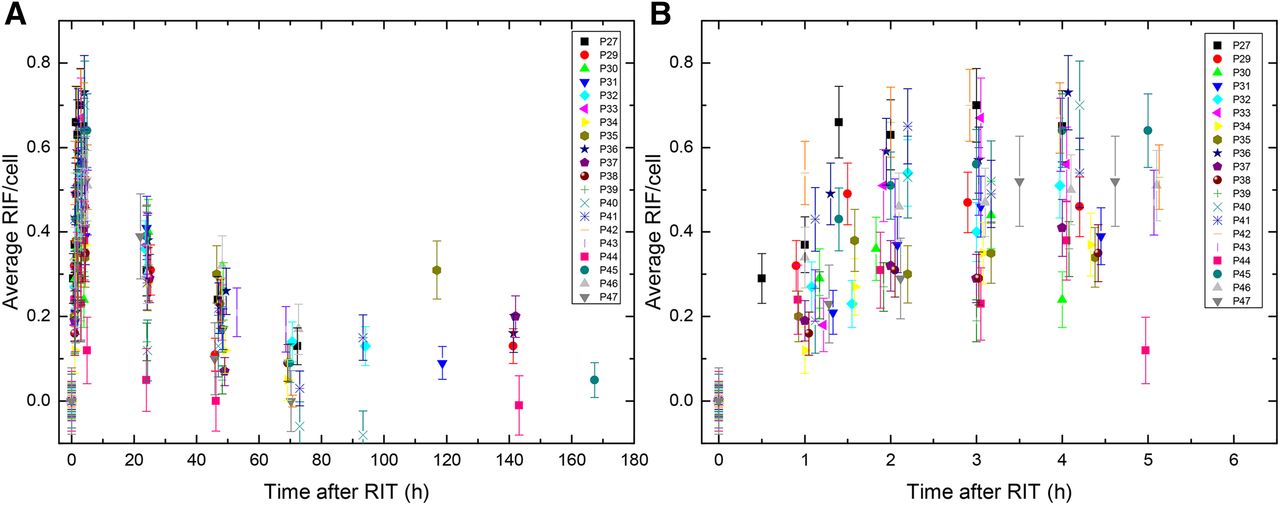
Peripheral blood lymphocytes were stained immunofluorescently for γ-H2AX and 53BP1 (14,18). DNA damage foci were manually enumerated for colocalizing γ-H2AX/53BP1 DSB-marking foci. Average numbers of RIF/cell were calculated for each patient sample (Fig. 1) as a function of time after administration of the radiopharmaceutical. The average number of RIF/cell increased in the first hours after therapy, declining at later time points (Fig. 1; Table 1). The actual time points differed slightly because of variations in the individual patient management. The mean number of foci varied between 0.50 ± 0.14 RIF/cell at 4 h, 0.31 ± 0.10 RIF/cell at 24 h, and 0.18 ± 0.09 RIF/cell at 48 h after administration of 131I.

Average RIF/cell as function of time after administration of 131I for time points 0–168 h (A) and detailed view of time points 0–5 h (B).
Number of RIF/Cell and Absorbed Doses to Blood at Different Time Points
Only datasets of 4 and 48 h were distributed according to a gaussian distribution (Shapiro–Wilk test). Therefore, we chose a nonparametric test (Wilcoxon signed-rank test) to compare the datasets at 4, 24, and 48 h. Application of the Wilcoxon signed-rank test to those time points revealed that there was a statistically significant decrease between the number of RIF/cell at these time points (P < 0.05), confirming the observation that the number of RIF/cell declined 5 h after administration of the radiopharmaceutical (Fig. 1).
Dosimetry
The absorbed doses to the blood for the individual patients were calculated according to the EANM SOP (3). The mean absorbed dose was 66 ± 17 mGy at 4 h, 205 ± 49 mGy after 24 h, and 263 ± 63 mGy after 48 h, and the total absorbed dose after administration was 367 ± 105 mGy (Table 1). The specific total absorbed dose to the blood in all hypothyroid patients was 100 ± 22 mGy/GBq. This value is in good agreement with the value of 93 ± 35 mGy/GBq found in our previous study (18), further confirming the validity of the method.
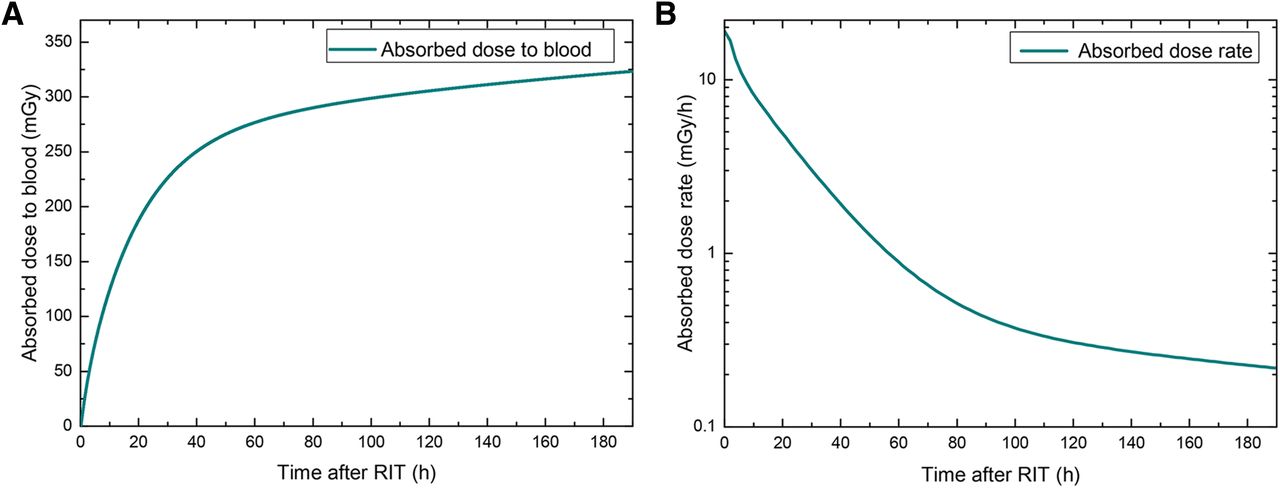
The absorbed dose to the blood increased steeply in the first few hours after therapy (Fig. 2A). In most patients, 50% of the total absorbed dose to the blood was reached within the first 24 h (Fig. 2B). In accordance with this observation, the dose rate declined until it was 0.5 mGy/h or less after 80 h. For overview, Figure 3 shows the average RIF/cell values of an exemplary patient (patient 45) as a function of the absorbed dose to the blood.

Absorbed dose (A) and dose rate (B) to blood for patient 45 as function of time.
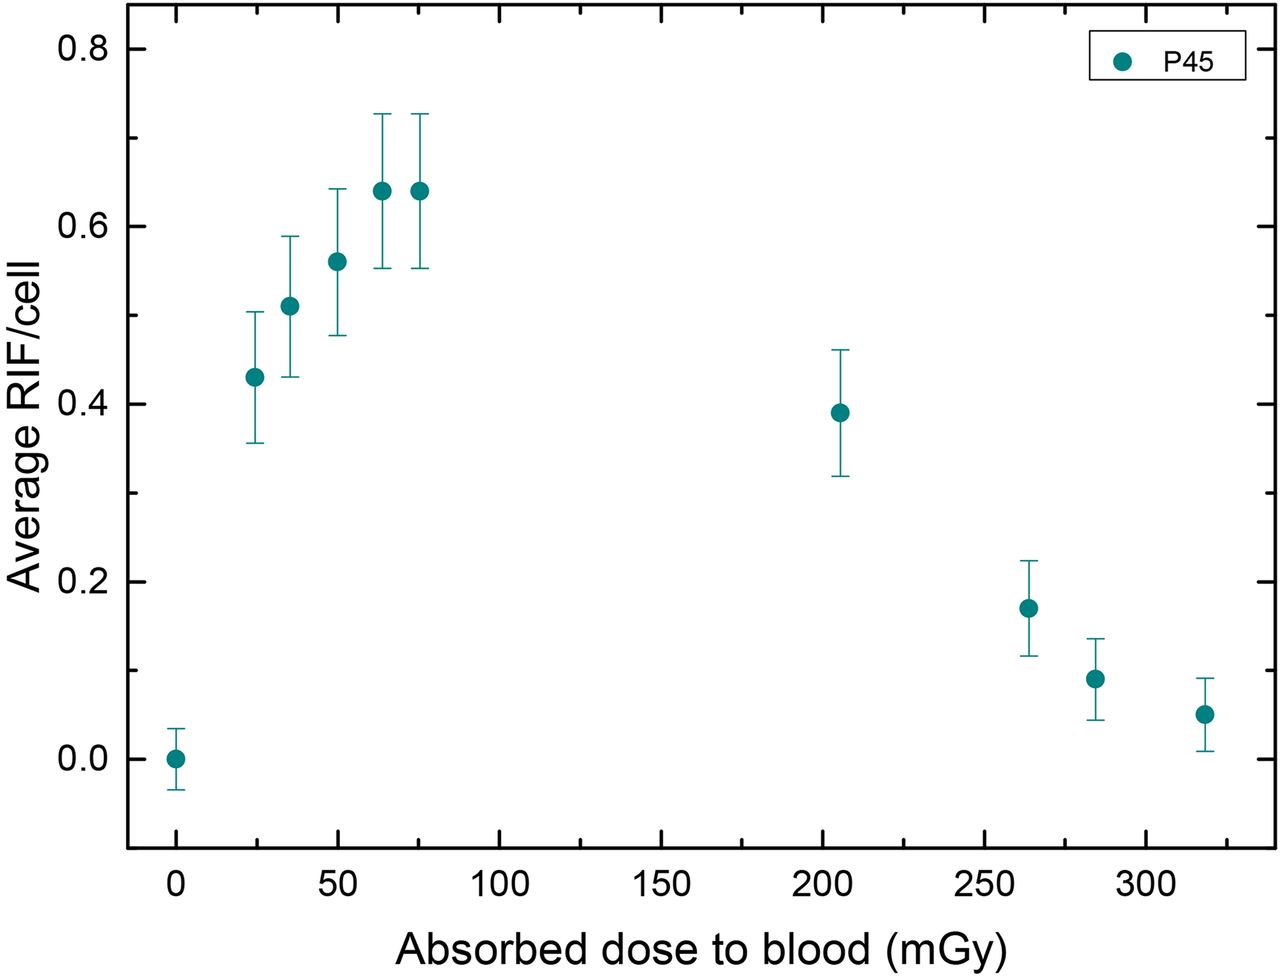
Average RIF/cell as function of absorbed dose to blood for patient 45. Time points of blood withdrawals were 0, 1.4, 2.0, 3.0, 4.0, 5.0, 24.0, 48.2, 69.8, and 167.3 h.
In Vivo Calibration of DNA Damage Focus Assay
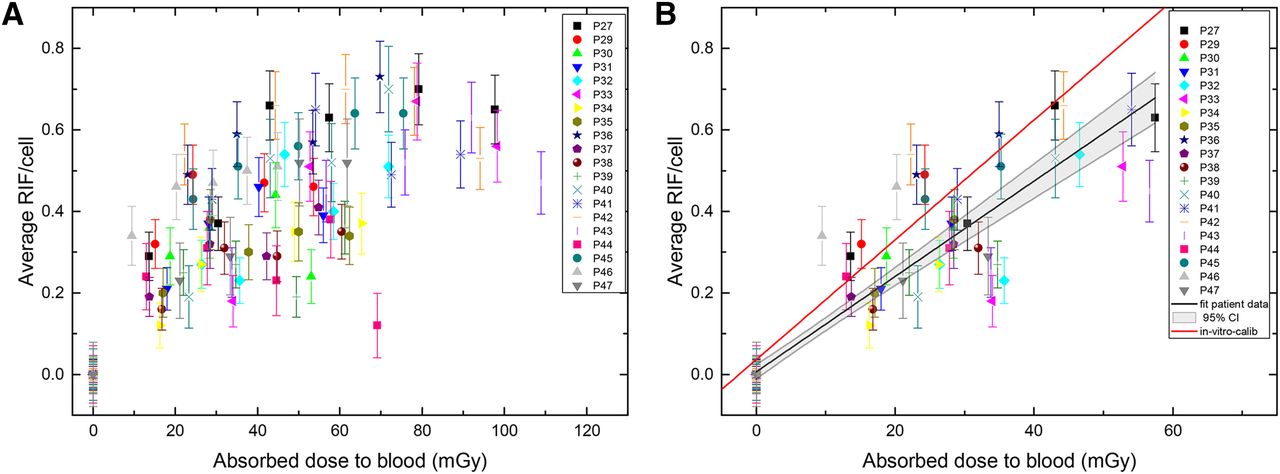
A fit within the first 4–5 h, as performed in the publication with 177Lu patients (16), after administration of the radioactivity could not be performed. The reason was the observation of a slower increase of the number of RIF/cell after 2 h. For the in vivo calibration, therefore, only the first 2 h after administration of the radioactivity or the first 2 data points were considered. Those datasets were pooled, and the average number of RIF/cell as a function of the absorbed dose was fitted linearly: (3)y denotes the number of RIF/cell and x the absorbed dose to the blood in mGy (R2 = 0.86). The SE of the y-axis intercept is ±0.0089 RIF/cell, and the SE of the slope is ±0.0006 RIF/cell mGy−1. The resulting in vivo calibration curve for our experiments including a 95% confidence interval is shown in Figure 4 as a black line.

Average number of RIF/cell as a function of the absorbed dose to blood for the first 5 h (A) and for the first 2 h (B) after 131I administration. The black line is a linear fit to our 131I patient data including a 95% confidence interval (CI), and the red line is the in vitro calibration curve taken from Eberlein et al. (15).
In a previous study, we obtained an in vitro calibration in blood samples of volunteers for 131I and 177Lu (15). For comparison, this in vitro calibration curve is shown as a red line in Figure 4. The slope for the patient data is shallower, with a relative deviation of the slopes of 20% between the in vitro calibration and the in vivo data.
Compared with the fit of the 177Lu patients (16), the 131I in vivo fit has a slope that is 7.9% lower. This is most likely caused by the early onset of a fast DNA damage repair component in the 131I patients.
Modeling
Individual fits of the patient foci data after the first RIT were performed according to Equation 2 using the datasets for the biokinetics of blood and whole body. Variable parameters to be fitted were m, λ, k, and ν (Table 2). The biexponential fit converged for 12 patients. Three patients showed a fast decay of the number of RIF/cell (patients 40, 42, and 44). For these patients, the fit did not converge. Three patients (patients 30, 33, and 39) were released from the ward 48 h after administration; therefore, blood samples could not be taken at later time points, and, consequently, a biexponential fit was impossible. For patients 37 and 47, a monoexponential decay represented the RIF/cell data better although their blood samples were taken at time points of 48 h or later; the mean values including their SD were taken from the 12 patients for whom the fit converged and had 3 or more data points of 24 h or more (Table 2).
Individual Fit Parameters for Equation 2
In general, the data followed a straight line for the first 1–2 h after 131I administration. The mean value of the fit parameter m, which accounts for the variability in the patient dosimetry with respect to the in vitro calibration, was 1.10 ± 0.53 (minimum, 0.56; maximum, 2.50). The mean (fast) decay rate (λ) for all 12 patients was 0.325 ± 0.128 h−1 (minimum, 0.15 h−1; maximum, 0.66 h−1). The (slow) decay rate ν ranged from 0.01 to 0.08 h−1 (mean, 0.040 ± 0.020 h−1). The mean value for k was 0.758 ± 0.129, indicating that about 76% of the DNA damage is repaired with a high decay rate. Expressed as half-lives, the mean values of the fast decay was Tfast = 2.1 h and Tslow = 17.3 h.
The time-dependent response function (Eq. 2) shown in Figure 5 (green curve) is based on the mean parameters provided in Table 2. According to this function, the highest number of RIF/cell can be expected 3.2 h after administration of 131I. After 148 h, the mean DSB foci values drop below the maximum SD of the background RIF/cell value of 0 ± 0.04 RIF/cell. The SD of the background foci includes the counting error; therefore, each data point is considered with appropriate error propagation, even the baseline value of the RIF/cell at 0 mGy. This indicates that some patients still have slightly elevated numbers of RIF, even up to 4 d after treatment started.

Average number of RIF/cell as function of time after 131I administration (A). The green curve represents the response function according to Equation 2 using mean values for all parameters. (B) More detailed view of the response function for the first 5 h after 131I administration.
DISCUSSION
There still is a limited number of publications investigating the effect of DSB induction after radionuclide therapy or diagnostics (16,18–20,22). However, nuclear medicine treatments involve systemic internal irradiation as compared with external irradiation (e.g., in radiotherapy). After radionuclide incorporation, the cells are not only irradiated by internalized and extracellular 131I for seconds or minutes but are continuously irradiated over a longer period with permanently changing dose rate. This could alter the effect of radiation damage compared with a fractionated high-dose-rate partial-body irradiation in radiotherapy. In a previous peptide receptor radionuclide therapy (PRRT) study with 177Lu, we reported a first linear relationship between the number of RIF/cell and the absorbed dose to the blood only over the first 4–5 h after therapy start (16). After this period, the disappearance of the DSB foci was reflected by the decay of the RIF/cell numbers.
This study with 131I showed a similar relationship; however, the time period of the linear dependence was reduced to 2 h after administration of the β-emitter 131I (Fig. 1B), indicating a faster decay of the RIF/cell number. The time points after 2 h were characterized by a diminishing number of radiation-induced foci in accordance with the progression of DNA repair and the declining dose rates. This finding agrees well with our previous studies that showed the highest value of RIF/cell at early time points, with subsequent, statistically significant reduction of the RIF/cell numbers at later time points (16,18).
Analysis of γ-H2AX/53BP1 foci kinetics in peripheral blood lymphocytes of 16 patients undergoing PRRT (16) revealed, however, likely due to the short time period of measurement after therapy (<48 h), only a monoexponential decay curve (16). Compared with our previous study in patients after PRRT, there is a deviation from a straight line in this study at time points of ≥2 h after 131I administration. This might be caused by the higher mean absorbed dose imparted to the blood in the first hour after treatment (14 ± 5 mGy for 177Lu PRRT [unpublished data taken from our PRRT study], 23 ± 8 mGy for 131I RIT). This effect mirrors the one for the differential foci response of human fibroblasts after irradiation with X-rays for absorbed doses greater than 10 mGy (23).
The disappearance of RIF/cell as a function of time has been quantitatively described by Horn et al. (24), Mariotti et al. (25), and Eberlein et al. (16). The values reported in this study for the slow and fast component of decay were in good agreement with the findings of Horn et al. (24), characterizing the disappearance of RIF/cell by a biexponential response function with a short decay rate of 0.35 h−1 (77%) and a longer-lived component of 0.018 h−1 (23%). The range of our RIF/cell decay rate for the fast component is within the value ranges of Horn et al. (24) and Mariotti et al. (25) (0.23 h−1). The slow decay component by Mariotti et al. does not contribute greatly to the decay of RIF/cell (probability, 9%) and is less than 10−11h−1. Most likely, their way of irradiating the cells does not compare to our case of continuous internal irradiation with decreasing dose rate.
Several RIT patients showed a fast monoexponential decay rate, pointing at the fact that their DSB repair could have been more effective as compared with the other patients. However, for these patients no obvious link between this finding and the pretreatment or stage of the disease could be found.
Further studies with more patients and other isotopes/radiopharmaceuticals showing different kinetics of the tracer in the blood are needed to better identify repair kinetics and patients with different repair rates.
CONCLUSION
This study describes the kinetics of 131I incorporation–induced DSBs in blood lymphocytes during radioiodine therapy as a function of the absorbed dose to the blood. In the first hours after therapy, the number of radiation-induced DSBs per cell increased linearly with the absorbed dose and mirrored our recently established in vitro calibration curve. At more advanced time points after administration of the radiopharmaceutical, the induction of a fast and a slow repair component of the double-strand DNA damage was seen. In this study, we found a dose-dependent analytic function describing the internal 131I irradiation–induced time course of induction and decay of DSB foci in RIT patients.
DISCLOSURE
The costs of publication of this article were defrayed in part by the payment of page charges. Therefore, and solely to indicate this fact, this article is hereby marked “advertisement” in accordance with 18 USC section 1734. This study was funded by a grant of the Deutsche Forschungsgemeinschaft (DFG) (no. LA 2304/3-1). The funders had no role in study design, data collection and analysis, decision to publish, or preparation of the manuscript. No other potential conflict of interest relevant to this article was reported.
Acknowledgments
We thank all patients who participated in the study for their contribution. We also thank the members of the nuclear medicine team and, particularly, Inge Grelle, Heike Göbel, and Carina Novak for support and assistance.
Footnotes
↵* Contributed equally to this work.
Published online Nov. 12, 2015.
- © 2016 by the Society of Nuclear Medicine and Molecular Imaging, Inc.
REFERENCES
- Received for publication July 31, 2015.
- Accepted for publication October 28, 2015.


