


Abstract
Metformin is the most widely prescribed oral antiglycemic drug, with few adverse effects. However, surprisingly little is known about its human biodistribution and target tissue metabolism. In animal experiments, we have shown that metformin can be labeled by 11C and that 11C-metformin PET can be used to measure renal function. Here, we extend these preclinical findings by a first-in-human 11C-metformin PET dosimetry, biodistribution, and tissue kinetics study. Methods: Nine subjects (3 women and 6 men) participated in 2 studies: in the first study, human radiation dosimetry and biodistribution of 11C-metformin were estimated in 4 subjects (2 women and 2 men) by whole-body PET. In the second study, 11C-metformin tissue kinetics were measured in response to both intravenous and oral radiotracer administration. A dynamic PET scan with a field of view covering target tissues of metformin (liver, kidneys, intestines, and skeletal muscle) was obtained for 90 (intravenous) and 120 (oral) min. Results: Radiation dosimetry was acceptable, with effective doses of 9.5 μSv/MBq (intravenous administration) and 18.1 μSv/MBq (oral administration). Whole-body PET revealed that 11C-metformin was primarily taken up by the kidneys, urinary bladder, and liver but also to a lesser extent in salivary glands, skeletal muscle, and intestines. Reversible 2-tissue-compartment kinetics was observed in the liver, and volume of distribution was calculated to be 2.45 mL/mL (arterial input) or 2.66 mL/mL (portal and arterial input). In the kidneys, compartmental models did not adequately fit the experimental data, and volume of distribution was therefore estimated by a linear approach to be 6.83 mL/mL. Skeletal muscle and intestinal tissue kinetics were best described by 2-tissue-compartment kinetics and showed only discrete tracer uptake. Liver 11C-metformin uptake was pronounced after oral administration of the tracer, with tissue-to-blood ratio double what was observed after intravenous administration. Only slow accumulation of 11C-metformin was observed in muscle. There was no elimination of 11C-metformin through the bile both during the intravenous and during the oral part of the study. Conclusion: 11C-metformin is suitable for imaging metformin uptake in target tissues and may prove a valuable tool to assess the impact of metformin treatment in patients with varying metformin transport capacity.
The biguanide metformin is the preferred first-line oral therapy for patients with type 2 diabetes. Metformin effectively lowers fasting glucose and also favorably affects lipid metabolism in most patients (1). The precise mechanism of action of the drug is not fully understood, partly because of the complex and interindividually highly variable pharmacokinetics of metformin (2,3) but equally importantly because of the inaccessibility of the putative main target tissues, the liver and intestines. Most biodistribution and tissue uptake studies have therefore been restricted to preclinical investigations in cells or small animals. Consequently, and due to its noninvasive properties, PET is an attractive modality to study in vivo tissue biodistribution and kinetics of metformin in humans.
There are numerous examples of successful labeling of drugs with PET isotopes. 11C-labeled drug candidates (e.g., 11C-verapamil and 11C-tariquidar) (4) have thus been used in preclinical studies to confirm that the drug does indeed reach the intended target tissue and that it does not accumulate in sites of potential toxicity. PET-labeled drugs have also been used to validate that pharmacokinetics and distribution from preclinical studies can be extended to humans (e.g., 11C-donepezil) (5). However, 11C-metformin has to our knowledge previously been used only in 2 small-animal studies (6,7).
We recently reported that metformin can be labeled with 11C using a novel 1-step synthesis and have shown in cell and large-animal studies that the radiotracer may be a potential candidate to accurately quantify kidney function (8). The aim of this paper was to extend these preclinical findings to humans. We have therefore performed first-in-human dosimetry and biodistribution studies as well as studies of metformin tissue kinetics after intravenous and oral administration of the radiotracer. Metformin is a strong base, which exists solely in its protonated form at physiologic pH. Thus, its biodistribution heavily depends on cellular transporters, notably the apical plasma membrane monoamine transporter in the intestine, the basolateral organic cation transporter 1 (OCT1) in the liver, and the basolateral organic cation transporter 2 (OCT2) and the apical multidrug and toxin extruder (MATE)1/2 in the kidneys (9). Accordingly, it was our hypothesis that the kidneys rapidly excrete metformin but also that the hepatic uptake would be significantly higher than uptake in other target tissues such as the intestines and skeletal muscle. Finally, it was an aim to determine whether metformin is excreted from the liver via the bile.
MATERIALS AND METHODS
Preparation of 11C-Metformin
11C-metformin (isotope half-life, 20.4 min) was prepared as recently described (8) and contained 0.02–0.4 μg/mL metformin dissolved in aqueous (NH4)2HPO4 (100 mM, pH 5).
Study Participants
Nine subjects were studied: 4 in the whole-body dosimetry study and 5 in the dynamic study.
For the whole-body dosimetry study, 4 healthy subjects were recruited (2 men, 2 women), with a mean age of 32 y (age range, 27–40 y).
For the dynamic study, 5 healthy volunteers were recruited (4 men, 1 woman), with a mean age of 41 y (age range, 37–47 y). All subjects were screened for inclusion in the weeks preceding the PET scans. Screening included demographic data, clinical history, medical examination, heart rate, and blood pressure. The study protocol was approved by the Central Denmark Committee on Health Research (no. M-2013-298-13), and the subjects signed a written informed consent form before entering the study. All participants fasted for a minimum of 6 h before each PET scan.
Whole-Body PET Imaging (Dosimetry)
Intravenous Study
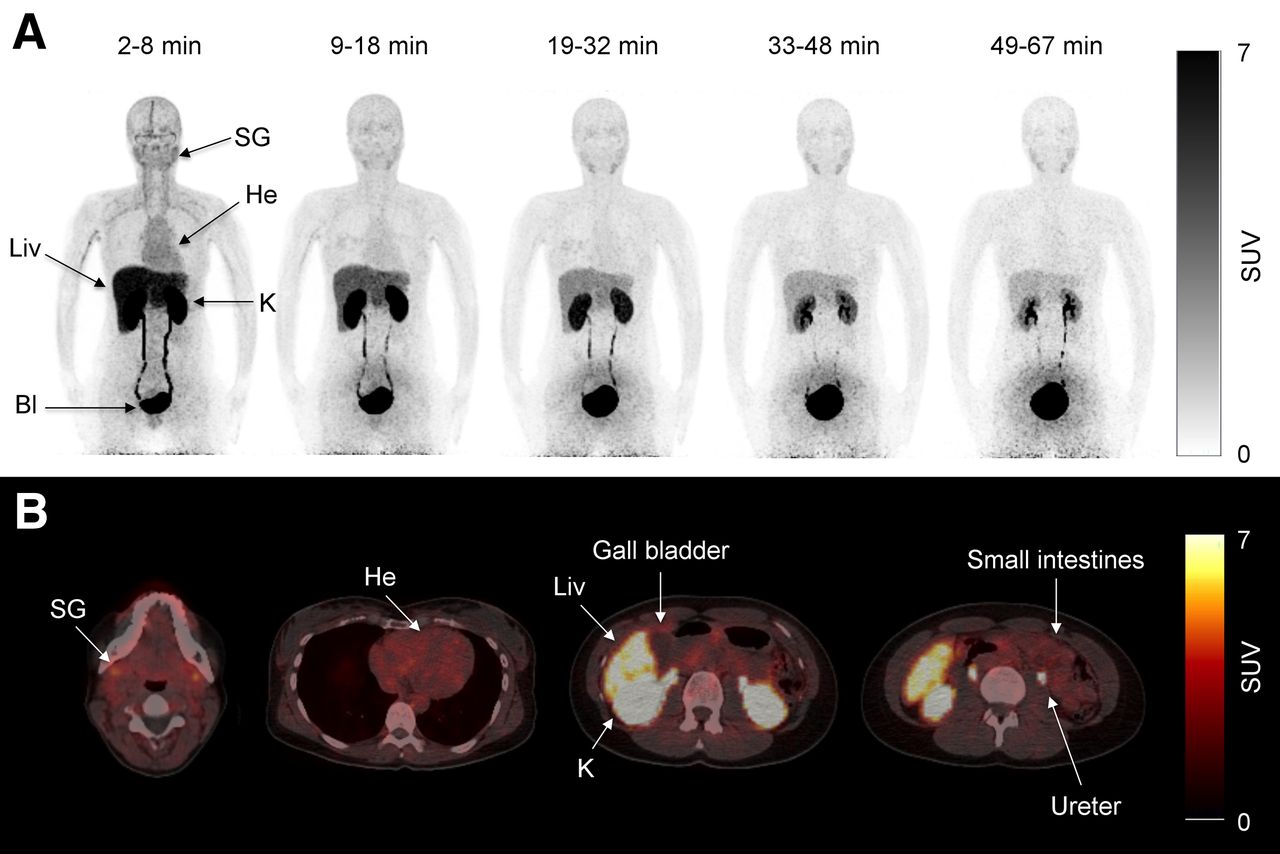
Pseudodynamic whole-body PET was performed on 4 healthy volunteers (2 men, 2 women) using a Biograph 64 PET/CT system (Siemens). Accurate cross-calibration between PET scanner, dose calibrator, and well counters used to measure injected dose and blood activity concentrations was verified on a weekly basis and was always well within 5%. A low-dose CT from the vertex to mid thigh was acquired before the PET scan. The axial field of view was 21.8 cm. Two minutes before the scan start, a bolus injection of 179 (range, 147–208) MBq of 11C-metformin was injected, and 5 consecutive whole-body scans with increasing frame durations (to account for the short half-life of 11C-metformin) were obtained: 1, 1.5, 2, 2.5, and 3 min per bed position. The time intervals for the PET scans were therefore 2–8, 9–18, 19–32, 33–48, and 49–67 min (Fig. 1A). Source organs for the dosimetry calculations were the liver, kidneys, and bladder contents. In 2 subjects, urine and plasma samples were analyzed by radio–high-performance liquid chromatography to detect 11C-metabolites.

(A) Pseudodynamic dosimetry scans (scans 1, 2, 3, 4, and 5) of representative patient after intravenous injection of 147 MBq of 11C-metformin. Bl = bladder; He = heart; K = kidney; Liv = liver; SG = submandibular gland. (B) Transaxial slices of 11C-metformin–avid organs during first dosimetry scan (2–8 min).
Oral Study
An oral study was performed 120 min after the intravenous study. Participants were instructed to rapidly ingest 115 (range, 99–122) MBq of 11C-metformin dissolved in water through a straw. A low-dose CT from the vertex to the mid thigh was acquired, and 5–10 min after ingestion of the radiotracer 6 consecutive whole-body scans were obtained and reconstructed as described later. Minutes per bed position were 1, 1.5, 2, 2.5, 3, 3.5, and 4 min, and the time intervals were therefore approximately 5–11, 12–21, 22–34, 35–50, 52–70, 71–92, and 93–117 min, depending on the number of bed positions (Fig. 2A). Source organs for the dosimetry calculations were the stomach content, small intestinal content, liver, kidneys, and bladder content.
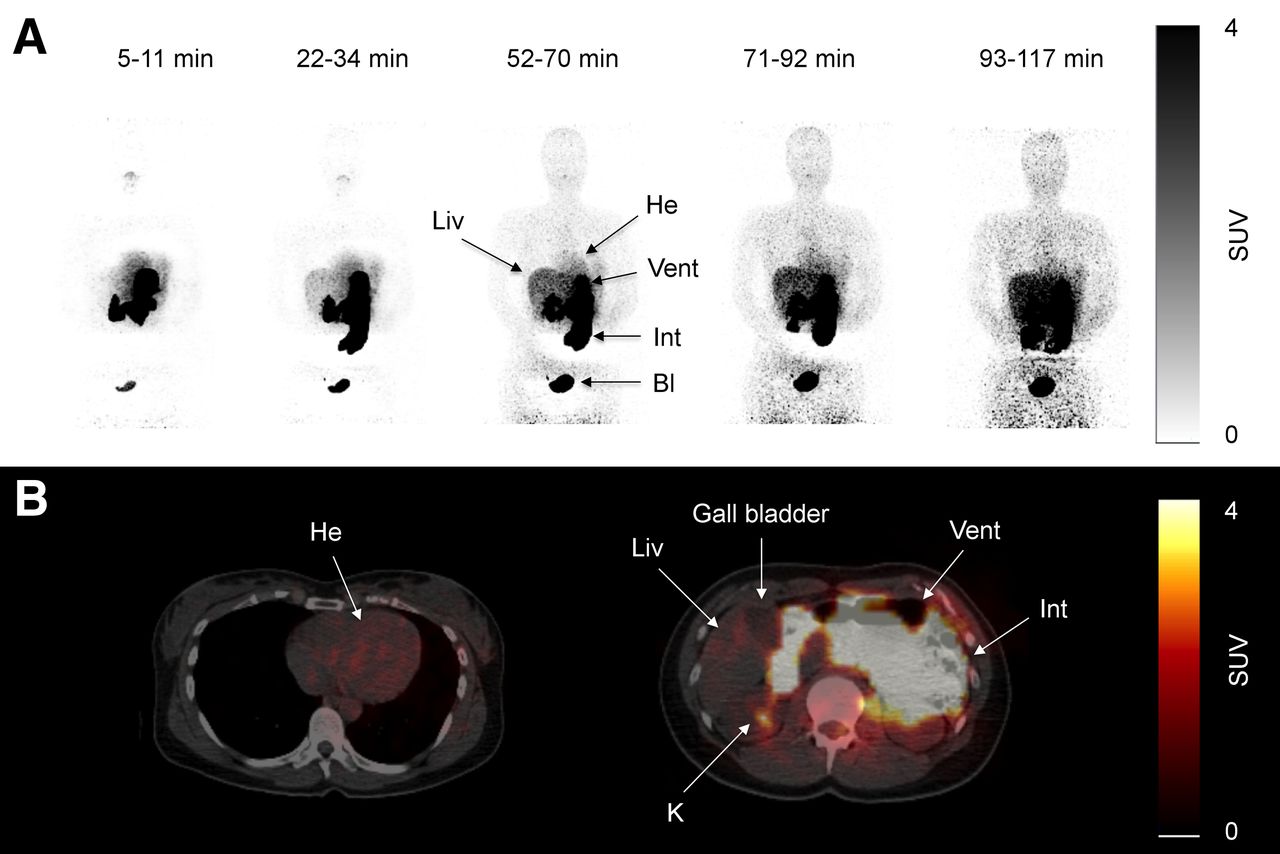
(A) Pseudodynamic dosimetry scans (scans 1, 3, 5, 6, and 7) after oral ingestion of 99 MBq of 11C-metformin in representative patient. (B) Transaxial slices of same patient during scan 5 (52–70 min) after ingestion of oral 11C-metformin. Bl = bladder; He = heart; Int = small intestines; K = kidney; Liv = liver; Vent = ventricle.
For both dosimetry studies, time-integrated activity coefficients for source organs and remainder were calculated and used in the OLINDA/EXM software package (10) to compute organ doses using the male reference phantom and to obtain an effective dose estimate according to International Commission on Radiological Protection publication 60 (11). The supplemental materials (available at http://jnm.snmjournals.org) provide details and further calculations.
Dynamic PET Imaging
Intravenous Injection (Kinetics)
Two catheters were inserted: one in the radial artery for arterial blood sampling and another in a contralateral vein for 11C-metformin administration. Patients were placed with the upper abdomen/lower chest in the field of view, and a low-dose CT scan was obtained for attenuation and anatomic localization purposes. 11C-metformin was injected as a bolus (201 MBq [range, 171–224 MBq]), and a 90-min dynamic scan covering an area from the ascending aorta to the tip of the right lower lobe of the liver was subsequently obtained, with 42 manual blood samples taken during the scan. Plasma and whole-blood activity were measured in a well counter (Cobra II; Packard Instruments Co.) cross-calibrated to the tomograph. List-mode-acquired PET data were divided into 42 frames with the following frame structure: 12 × 5, 8 × 15, 7 × 60, and 15 × 300 s. Data were reconstructed using 3-dimensional attenuation-weighted ordered-subset expectation maximization with resolution recovery (TrueX), 168 × 168 matrix, 4 × 4 × 3 mm3 voxel size, 3 iterations, 21 subsets, 3-mm gaussian filter, and separate prompts/randoms. The final image resolution was 5 mm in full width at half maximum.
Per Oral Ingestion (Tissue Distribution)
The subjects were asked to ingest 119 MBq (range, 65–144 MBq) of 11C-metformin dissolved in water 120 min after the intravenous injection. A 120-min dynamic scan centered on the liver was subsequently obtained, with 30 manual arterial blood samples taken during the scan (1 × 15, 9 × 30, 3 × 60, 5 × 120, and 10 × 600 s). List-mode-acquired PET data were divided into 50 frames with the following frame structure: 20 × 15, 5 × 60, 5 × 120, and 20 × 300 s.
Volumes of Interest
For the whole-body dosimetry calculation, volumes of interest were manually defined as described in detail in the supplemental materials, in which representative volumes of interest in target organs are also depicted (Supplemental Fig. 1).
Kinetic Analyses
Dynamic PET time–activity curves were kinetically analyzed using arterial plasma input functions and different approaches: a linear approach (Logan) yielding total distribution volume (Vd) and 2 nonlinear approaches—a reversible single-tissue-compartment model and a reversible 2-tissue-compartment model. Goodness-of-fit was measured by the Akaike score. A 2-tissue-compartment model was found to be optimal for the liver, skeletal muscle, and small intestines, whereas neither the 1-tissue- nor the 2-tissue-compartment models adequately fitted kidney data. For the kidney, only the linear approach was therefore used. The 2-tissue-compartment model derives K1 (mL mL−1min−1), the influx rate constant of the tracer from the plasma to the tissue compartment; k2 (min−1), the rate constant of transfer of tracer out of the tissue; k3 (min−1), the rate constant of transfer into an intracellular compartment; and k4, the transfer of tracer out of the intracellular compartment. For the liver, a second input function was calculated on the basis of the dual input from the hepatic artery (arterial plasma samples) and portal activity (portal volume of interest drawn on summed images from 30 to 120 s divided by the whole-blood–to–plasma ratio). Hepatic arterial supply was assumed to constitute 20% of total liver blood supply. All kinetic analyses were done by PMOD 3.7 software (PMOD). SUVs were calculated as concentration (kBq/mL) × (body weight [g]/injected dose [kBq]).
RESULTS
The mean and SD of the administered mass of 11C-metformin was 1.1 ± 1.0 μg (range, 0.1–3.6 μg). The mean administered activity was 153 ± 43 MBq (range, 65–224 MBq). There were no adverse or clinically detectable pharmacologic effects in any of the 9 subjects. No significant changes in vital signs or the results of laboratory studies or electrocardiograms were observed.
Whole-Body PET and Radiation Dosimetry Studies
Intravenous Injection
Whole-body biodistribution after an intravenous injection of 11C-metformin is depicted in Figure 1. As seen in panels A and B, avid uptake and excretion were noted in the kidneys, ureters, and bladder. The liver also showed significant accumulation of the tracer immediately after intravenous injection, with a gradual decline throughout the study. Some uptake was noted in the salivary glands whereas intestinal tracer uptake was only discrete. No activity was observed at any time in the gallbladder in any of the subjects, indicating that metformin is not eliminated through the bile. Also of interest, no visible uptake was observed in the myocardium or brain (Fig. 1B). No radioactive metabolites were found in plasma and urine samples.
Radiation doses to organs after an intravenous injection are summarized in Supplemental Table 2 (supplemental materials provide details of the calculations). The urinary bladder received by far the highest dose, followed by the kidneys and the liver. The effective dose was 9.5 μSv/MBq, which is greater than what is typically observed using 11C radiotracers (12), but comparable to other 11C radiotracers actively secreted by the kidney (5-HT1A) and well within limits imposed by regulatory bodies.
Per Oral Ingestion
Some variation was noted in the emptying time of the gastric ventricle, but significant amounts of tracer had passed to the small intestine within 10 min after ingestion in all studied subjects (Fig. 2). The urinary bladder was clearly visible during the first scan, demonstrating rapid transport of 11C-metformin from the site of uptake to its final elimination via the kidneys. Of interest, liver activity gradually increased throughout the study, reflecting steady uptake of radiotracer. As also observed in the intravenous study, no visible uptake was noted in the myocardium (Fig. 2B).
Radiation doses to organs are summarized in Supplemental Table 2. The stomach and small intestines received the highest dose. The effective dose was 18.1 μSv/MBq.
Dynamic Studies
Intravenous Injection
During the dynamic studies, both plasma and whole-blood activity were sampled. Plasma and whole-blood activity peaked shortly after injection, followed by a rapid biphasic decline with most of the tracer cleared after 20 min (Fig. 3). The ratio between whole-blood and plasma activity was remarkably stable at approximately 0.6, indicating either very slow or no transfer of 11C-metformin into the erythrocytes (Fig. 3, insert).
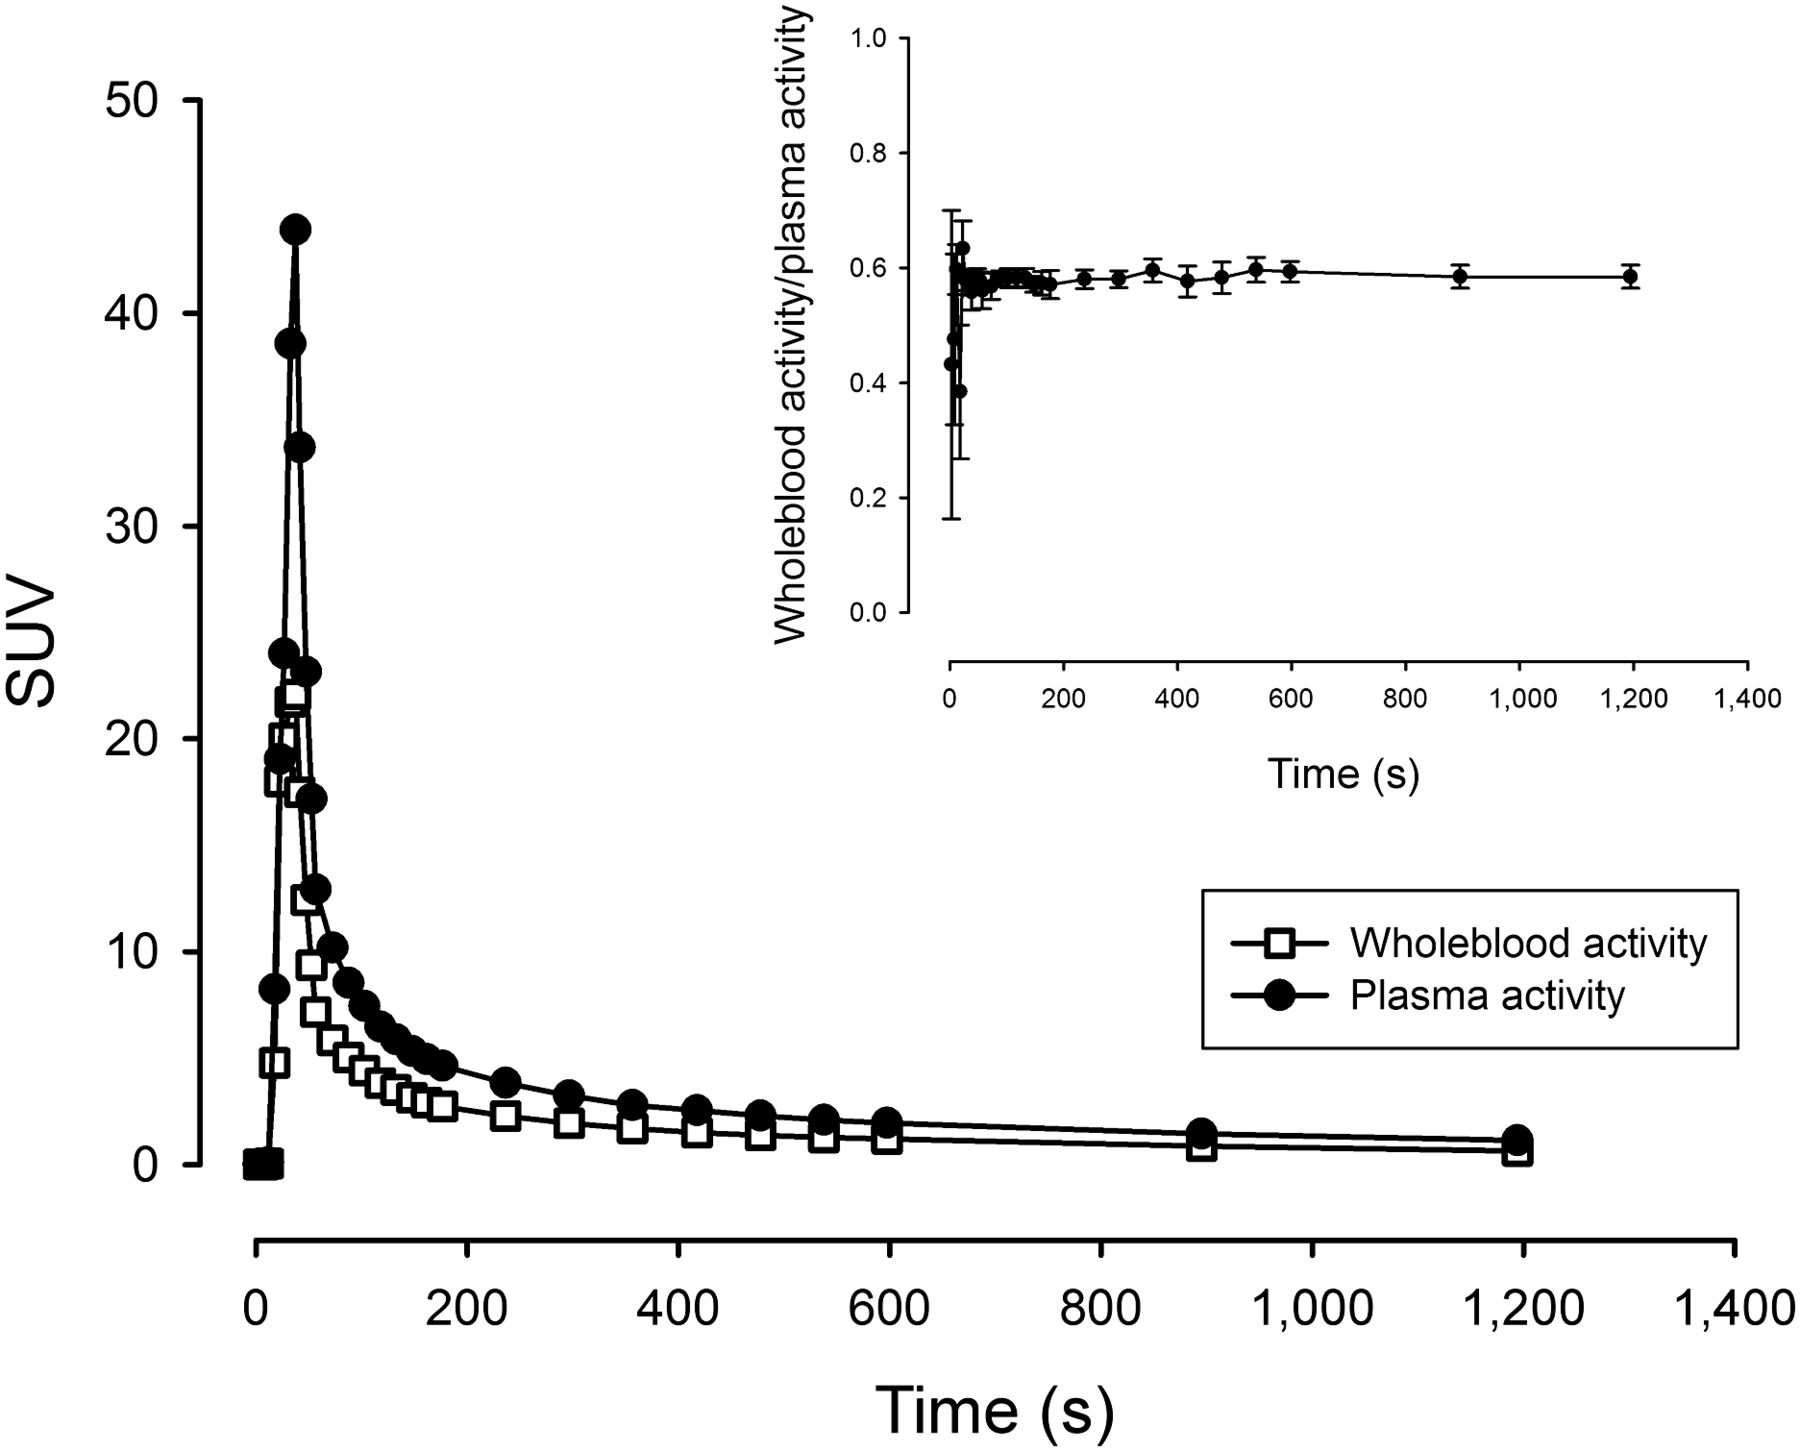
(A) Average whole-blood and plasma activity (error bars omitted for sake of clarity) after intravenous injection of tracer. n = 4, error bars are ± SEM.
Kinetic Analyses
Time–activity curves of organs in the field of view during the dynamic scans were generated (Fig. 4). In the kidneys (Fig. 4A), uptake was intense, reaching an SUVmean of approximately 45. The subsequent decrease in activity was equally rapid, and the tissue kinetics were therefore highly reversible. Both 1-tissue- and 2-tissue-compartment models produced poor fits to the experimental data, and volume of distribution was therefore determined by a linear approach. In the liver, activity peaked at only 15% of that seen in the kidneys, reaching SUVs of approximately 7 and the elimination phase was significantly more protracted (Fig. 4B). In the liver, a reversible 2-tissue-compartment model produced excellent unconstrained fits with consistently lower Akaike scores than the reversible 1-tissue-compartment model. Because an arterial input function overestimates the hepatic tracer input due to the dual blood supply of the organ, we also estimated liver kinetics using a hepatic dual-input function. As expected, this yielded comparable liver Vd estimates and greater K1 values. The dual-input 2-tissue-compartment model also had lower Akaike scores than the arterial-input 2-tissue-compartment model. Finally, a 2-tissue-compartment unconstrained model fitted both the intestinal and the skeletal muscle time–activity curves excellently (Figs. 4C and 4D), yielding low Akaike scores. An attempt was made to estimate 11C-metformin kinetics in the myocardium, but massive activity spill-in from the lumen as well as activity in the coronary vessels resulted in consistently poor fits to all models. This poor fit was also observed in the gallbladder, which had limited activity throughout the duration of the study, attributable to spill-in from the surrounding liver tissue.
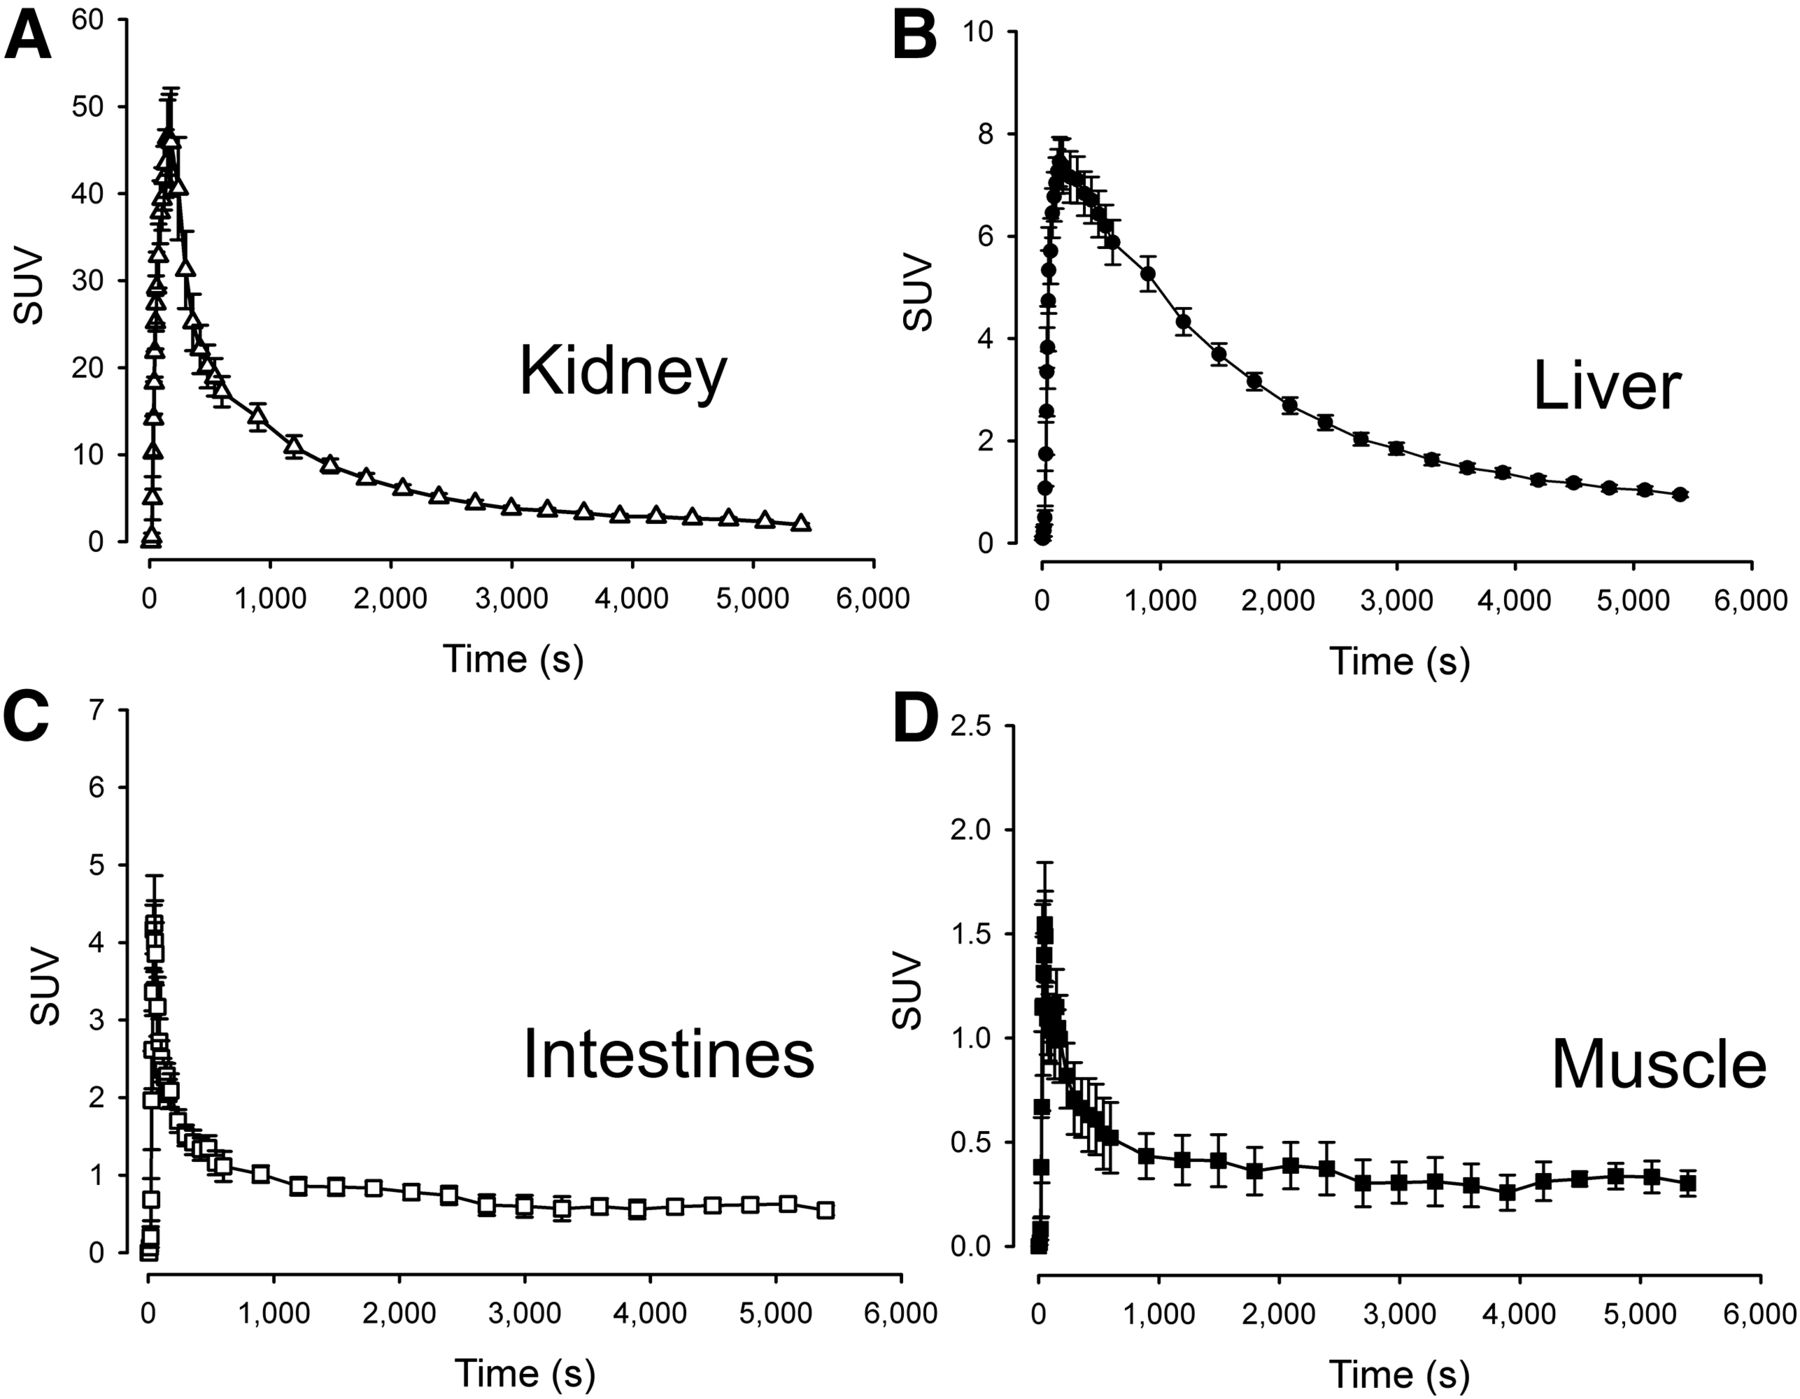
Time–activity curves of target organs. n = 5, error bars are ± SEM.
All calculated transfer rate constants are supplied in Table 1, and tissue-to-blood ratios after intravenous injection are provided in Supplemental Figure 1.
11C-Metformin Kinetics
Per Oral Ingestion
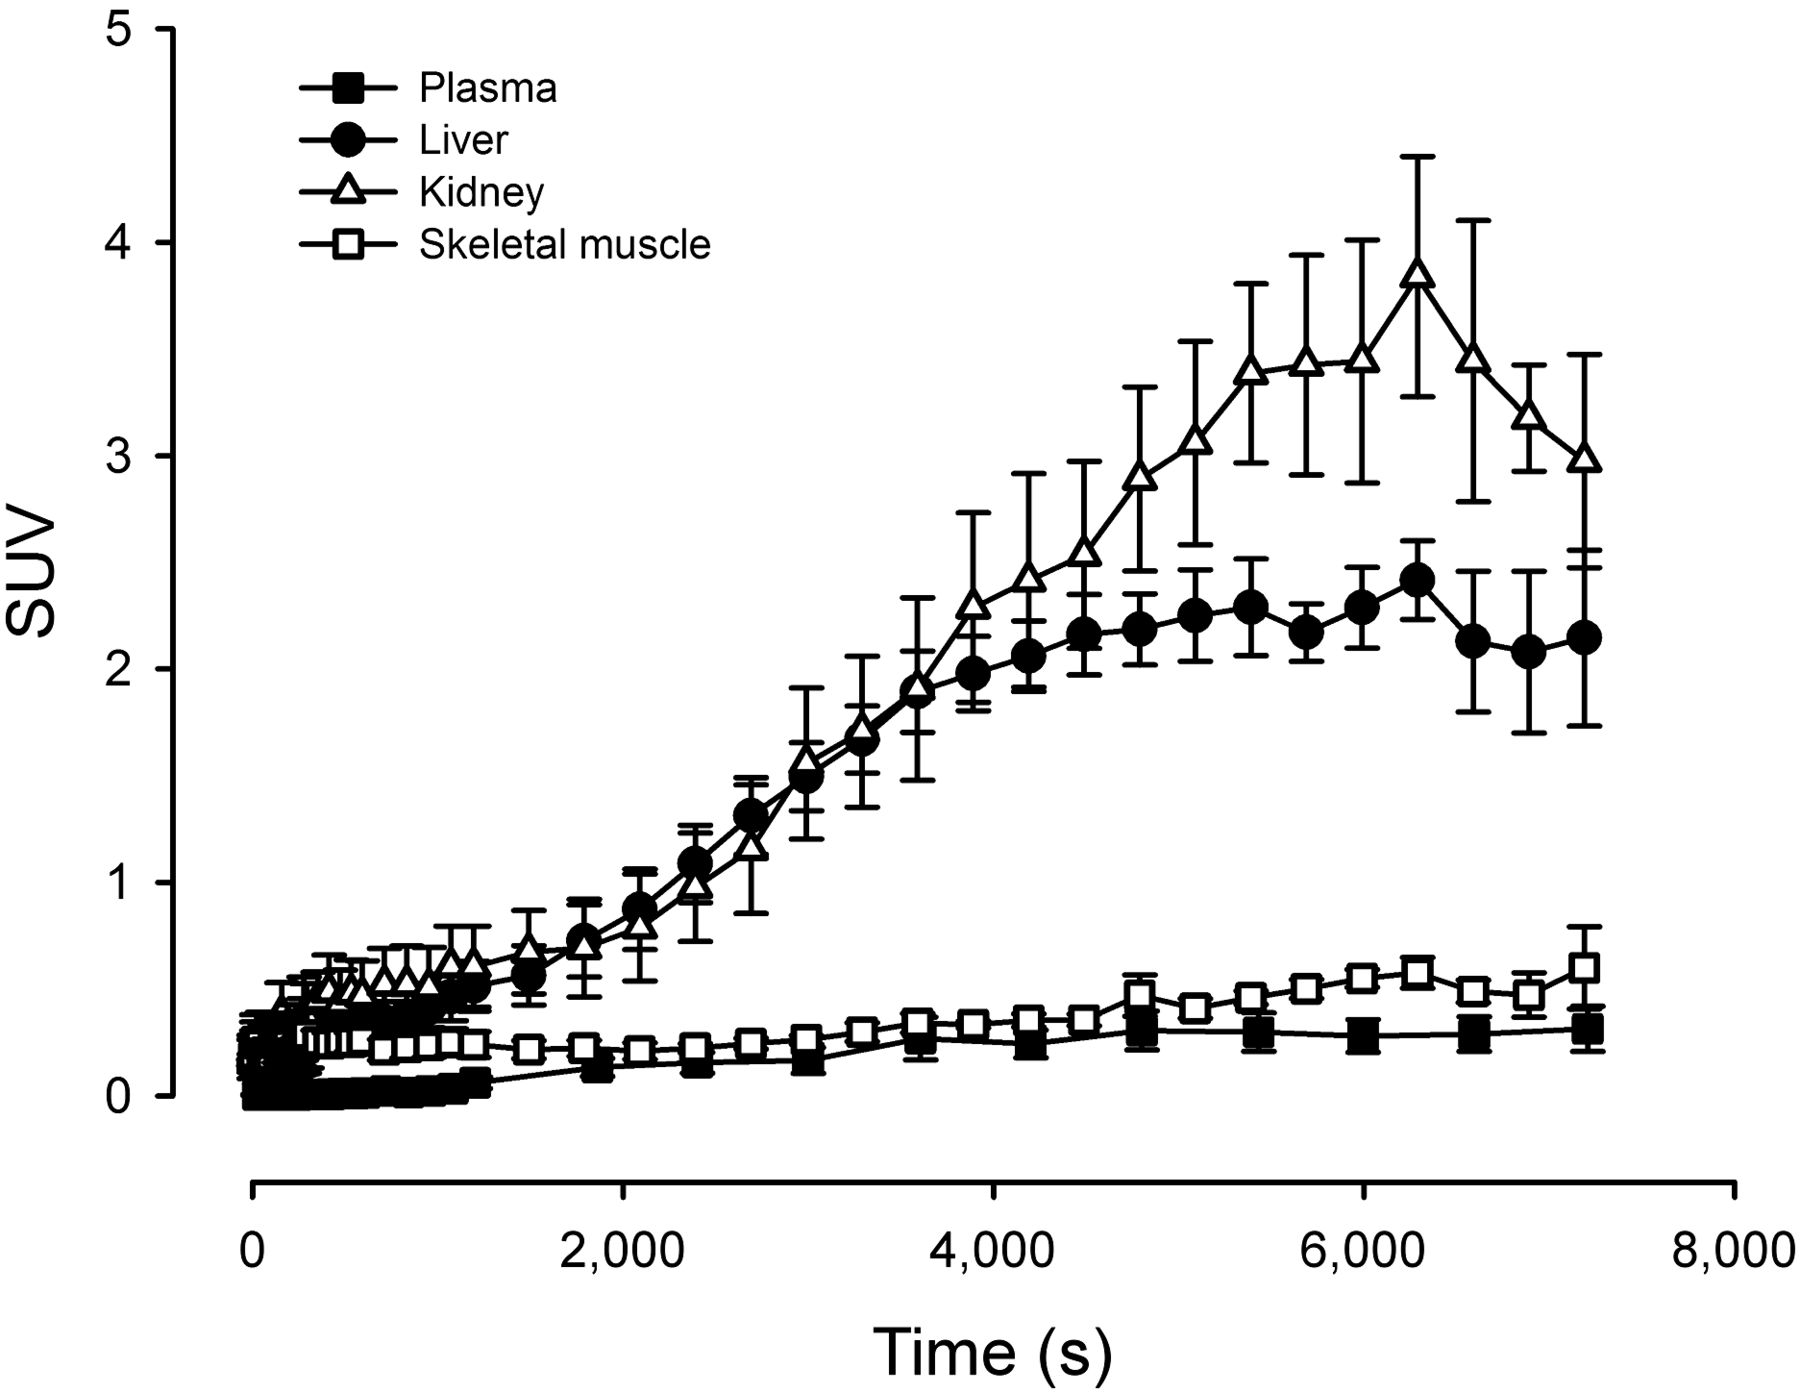
When oral 11C-metformin was administered, arterial activity gradually increased from 0 to 0.27 SUV units, reflecting steady absorption of the radiotracer from the small intestines (Fig. 5). Hepatic and renal activity increased in tandem until t = 4,000 s, at which point liver activity reached a plateau phase with an SUVmean of approximately 2 g/mL. Kidney activity increased further, reaching an SUVpeak of about 3 g/mL at approximately 6,000 s after ingestion. In skeletal muscle, activity increased at a slow pace to 0.60 SUV. Interestingly, the hepatic tissue-to-blood (arterial) ratio was approximately 5 (n = 3) after oral ingestion compared with 2.5 after intravenous injection, whereas the kidney-to-blood (arterial) activity ratio was identical (∼8) regardless of how the radiotracer was administered. Thus, hepatic volume of distribution is highly dependent on whether the liver receives the radiotracer primarily through intestinal absorption and delivery via the portal vein or via the dual arterial/portal supply after an intravenous injection. Because of sampling problems, arterial sampling was performed only in 3 patients.

Time–activity curves after oral ingestion of 11C-metformin. n = 5, error bars are ± SEM.
DISCUSSION
Hepatic 11C-Metformin Uptake Is Rapid and Highly Reversible
In line with findings from previous studies in animals (7), we observed avid uptake of 11C-metformin in the liver, reaching SUVs of approximately 7. Even though uptake was rapid, tracer kinetics revealed that elimination of metformin from the hepatocytes is by a similarly efficient process. This finding may have several explanations. First, hepatic metformin uptake is, at least in part, mediated through the OCT1. OCT1 is located on the basolateral membrane of the hepatocyte (13) and facilitates passive diffusion of organic cations including a range of xenobiotics but also vital compounds such as thiamine down the electrochemical gradient (14). The central role of OCT1 in hepatic metformin uptake has been substantiated by reduced hepatic 14C-labeled metformin uptake and increased circulating metformin levels in OCT1 knock-out mice (15,16). In humans, plasma concentrations of metformin are higher in subjects with reduced function alleles for the gene encoding OCT1 (SLC22A1), suggesting that the total volume of distribution is reduced (17). It has thus been estimated that OCT1 mediates 76% of hepatic metformin transport (18).
Because of the bidirectional nature of the OCT1 transporter (9,19), and absence of significant metabolism of the drug, metformin in hepatocytes is predicted to passively equilibrate with plasma. This was evident in our bolus experiment in which plasma concentrations of metformin rapidly decreased to levels below hepatic concentrations, reversing the direction of metformin transport. The resultant plasma activity curves were therefore predictably biphasic.
Second, additional transport proteins may be involved in clearance of metformin from the hepatocytes. MATE1 is also expressed in human hepatocytes, and in addition this protein effectively transports metformin across the luminal membrane of renal proximal tubules into the urine (20,21). It has been postulated that MATE1, located on the luminal membrane of hepatocytes, transports metformin into the biliary canaliculi (7,9). However, our studies do not support this because 11C-metformin activity in the gallbladder was negligible throughout the biodistribution study and did not increase at any point during the dynamic study. The latter is an important point because the gallbladder usually does not empty itself in fasting subjects, and tracer accumulation therefore should have been evident. Instead, it is conceivable that MATE1 present at the basolateral membrane of the hepatocytes is involved in hepatic elimination of 11C-metformin to the circulation.
The best fit to the hepatic time–activity curves was by 2-tissue-compartment modeling, suggesting a reversible intracellular drug–target interaction, which is corroborated by previous studies in perfused rat livers (22). Metformin is thought to inhibit mitochondrial complex 1 (23), resulting in decreased adenosine triphosphate synthesis and reduced hepatic gluconeogenesis (24). However, a robust mechanistic explanation for the metformin–mitochondrial complex 1 interaction has yet to be confirmed, and the variations in our estimates of transfer rates into and out of the intracellular compartment (k3 and k4) also preclude any firm conclusions from the present study.
Liver Vd was between 2.45 and 2.66 mL/mL, depending on the input whether done by linear or nonlinear approaches. This Vd is slightly higher but still comparable to estimates obtained from perfused rat livers (22) and also comparable to measurements done in rats, for which hepatic concentrations have been reported to be 3–4 times higher than plasma concentrations (25). Of interest, the liver-to-plasma 11C-metformin activity ratio was 2-fold greater in our oral study than in the intravenous study, indicating a significantly higher 11C-metformin concentration in the portal vein than the systemic circulation under conditions of oral radiotracer intake. In line with this, portal vein concentrations have been demonstrated to exceed venous blood metformin concentrations by a factor of 2 (26) in mice fed metformin.
Rapid Renal 11C-Metformin Uptake and Excretion
As recently demonstrated by our group using a porcine model (8), 80% of intravenously administered 11C-metformin is rapidly taken up by the kidneys and excreted into the urine. Renal metformin uptake and extrusion involves OCT2 (13,27,28), MATE1, MATE2k (19), and possibly OCT1 (29). The elimination rate is approximately 3 times greater than for 51Cr-ethylenediaminetetraacetic acid, suggesting that 80% of the 11C-metformin elimination is by tubular secretion and the remaining 20%–25% is by filtration. The pronounced elimination by tubular secretion explains the poor performance of relatively simple 1-tissue- or 2-tissue-compartment models when applied to the present study. However, using a simpler and more robust linear approach, we obtained estimates of kidney metformin Vd close to the estimated values in the porcine studies (6.83 mL/mL) (8), albeit with considerable variation between subjects. This variation may be ascribed to variation in subject hydration status. Whether human kidney 11C-metformin Vd is affected by the presence of cold metformin in pharmacologic concentrations (as observed in the porcine study) remains to be studied.
Intestinal Metformin Uptake Capacity Is Low from Basolateral Side
The intestines are attracting growing interest as a putative target of metformin action. Thus, in healthy fasting subjects metformin unexpectedly increased the gluconeogenesis independently of the OCT1 genotype, providing evidence that the liver is not the only site of action (30). In keeping with this, inhibition of duodenal 5′adenosine monophosphate-activated protein kinase (AMPK) reduces the glucose-lowering effect of a metformin bolus in rat models, and conversely intraduodenal infusion of metformin activates AMPK and lowers hepatic glucose output (31). In addition, treatment with metformin is associated with profound alterations in gut microbiota (32). We observed discretely increased intestinal 11C-metformin after intravenous administration, demonstrating transport from the bloodstream into the enterocytes. However, our estimates of 11C-metformin volume of distribution and uptake kinetics as well as SUVs from the biodistribution study suggest that the transport capacity of the basolateral membrane transporters in the intestines is low. This may serve to explain the steady increase in intestinal 11C-metformin we observed after oral administration because metformin, which enters the enterocyte from the luminal side, may tend to accumulate in the cell as long as the concentration of metformin is higher in the intestinal lumen than in the enterocyte.
11C-Metformin Transport into Skeletal Muscle and Erythrocytes Is Slow and Not Readily Measured by PET
Finally, skeletal muscle 11C-metformin uptake was assessed and also found to be best described by reversible 2-tissue-compartment kinetics. We hypothesized that metformin uptake in skeletal muscle could be detected, because increased AMPK2α activity and glucose disposal has been observed in skeletal muscle of patients with type 2 diabetes treated with metformin (33). In addition, the low-affinity, high-capacity metformin transporter OCT3 is expressed in both human and rodent skeletal muscle (9). However, uptake rates (K1) and distribution volumes of 11C-metformin were barely measurable, and skeletal muscle 11C-metformin activity only slightly exceeded that in plasma. An interesting gradual increase in skeletal 11C-metformin activity over time was observed in the oral study, indicating that a prolonged accumulation of 11C-metformin may be facilitated by slowly equilibrating, low-affinity OCTs. A similar slow absorption and elimination of metformin by erythrocytes could also explain why 11C-metformin was confined to plasma during the length of these studies despite the convincing data showing that metformin only disappears slowly from the erythrocyte blood fraction after cessation of metformin therapy (34).
CONCLUSION
In these studies, we have successfully extended our previous preclinical findings to a human setting. We have shown that tracer doses of metformin (<5 μg) are safe and that the effective dose of 11C-metformin is 9.5 μSv/MBq (intravenous injection) and 18.1 μSv/MBq (oral ingestion). We have also demonstrated that 11C-metformin is avidly taken up by the intended target tissue (liver) and that it is rapidly excreted through the kidneys. Contrary to previous findings in animals, intestinal and skeletal muscle 11C-metformin uptake appeared to be by a low-capacity transport mechanism. Also at odds with previous findings from some but not all other groups, we did not observe any significant hepatic excretion of 11C-metformin through the bile. Calculated metformin volumes of distribution of the liver and kidneys were comparable to estimates from preclinical studies, and 11C-metformin therefore appears to be a promising tool for further investigations of metformin pharmacokinetics and pharmacodynamics in patients with type 2 diabetes.
DISCLOSURE
The costs of publication of this article were defrayed in part by the payment of page charges. Therefore, and solely to indicate this fact, this article is hereby marked “advertisement” in accordance with 18 USC section 1734. No potential conflict of interest relevant to this article was reported.
Footnotes
Published online Jul. 28, 2016
- © 2016 by the Society of Nuclear Medicine and Molecular Imaging, Inc.
REFERENCES
- Received for publication May 4, 2016.
- Accepted for publication June 18, 2016.


Jump to section
Related Articles
Cited By...
- Chemical imaging unveils mitochondria as the major site of medicinal biguanide accumulation within cells
- Impact of Direction of Transport on the Evaluation of Substrate Recognition of Mouse Multidrug and Toxin Extrusion Protein 1
- Differences in Metformin and Thiamine Uptake between Human and Mouse Organic Cation Transporter 1: Structural Determinants and Potential Consequences for Intrahepatic Concentrations
- Successful Prediction of Positron Emission Tomography-Imaged Metformin Hepatic Uptake Clearance in Humans Using the Quantitative Proteomics-Informed Relative Expression Factor Approach
- Probing mitochondrial metabolism in vivo
- Metabolism and Disposition of a Novel Selective {alpha}7 Neuronal Acetylcholine Receptor Agonist ABT-126 in Humans: Characterization of the Major Roles for Flavin-Containing Monooxygenases and UDP-Glucuronosyl Transferase 1A4 and 2B10 in Catalysis