


Abstract
18F-NaF, a PET radiotracer of bone turnover, has shown potential as an imaging biomarker for assessing the response of bone metastases to therapy. This study aimed to evaluate the repeatability of 18F-NaF PET–derived SUV imaging metrics in individual bone lesions from patients in a multicenter study. Methods: Thirty-five castration-resistant prostate cancer patients with multiple metastases underwent 2 whole-body (test–retest) 18F-NaF PET/CT scans 3 ± 2 d apart from 1 of 3 imaging sites. A total of 411 bone lesions larger than 1.5 cm3 were automatically segmented using an SUV threshold of 15 g/mL. Two levels of analysis were performed: lesion-level, in which measures were extracted from individual-lesion regions of interest (ROI), and patient-level, in which all lesions within a patient were grouped into a patient ROI for analysis. Uptake was quantified with SUVmax, SUVmean, and SUVtotal. Test–retest repeatability was assessed using Bland–Altman analysis, intraclass correlation coefficient (ICC), coefficient of variation, critical percentage difference, and repeatability coefficient. The 95% limit of agreement (LOA) of the ratio between test and retest measurements was calculated. Results: At the lesion level, the coefficient of variation for SUVmax, SUVmean, and SUVtotal was 14.1%, 6.6%, and 25.5%, respectively. At the patient level, it was slightly smaller: 12.0%, 5.3%, and 18.5%, respectively. ICC was excellent (>0.95) for all SUV metrics. Lesion-level 95% LOA for SUVmax, SUVmean, and SUVtotal was (0.76, 1.32), (0.88, 1.14), and (0.63, 1.71), respectively. Patient-level 95% LOA was slightly narrower, at (0.79, 1.26), (0.89, 1.10), and (0.70, 1.44), respectively. We observed significant differences in the variance and sample mean of lesion-level and patient-level measurements between imaging sites. Conclusion: The repeatability of SUVmax, SUVmean, and SUVtotal for 18F-NaF PET/CT was similar between lesion- and patient-level ROIs. We found significant differences in lesion-level and patient-level distributions between sites. These results can be used to establish 18F-NaF PET–based criteria for assessing treatment response at the lesion and patient levels. 18F-NaF PET demonstrates repeatability levels useful for clinically quantifying the response of bone lesions to therapy.
Prostate cancer is distinct among solid tumors in that its advancement presents largely as clinically detectable osteoblastic bone metastases (1). Currently, there are no established tools to reliably and quantitatively measure functional changes in bone metastases in response to therapy (2). The development of imaging biomarkers to measure response by bone can improve clinical care, particularly in advanced prostate cancer.
Radiolabeled sodium fluoride, 18F-NaF, was first introduced by Blau et al. in 1972 (3) for the detection of bone lesions with PET. However, 18F-NaF was largely replaced by bone scintigraphy using 99mTc because of superior imaging characteristics with conventional γ-cameras and the readily available supply of 99mTc (3–6). With recent technologic advances in PET, 18F-NaF PET has been increasingly used for detecting bone metastases because of its higher specificity and sensitivity as compared with planar bone scintigraphy and SPECT (4,5,7–10). 18F-NaF PET shows potential for longitudinal disease assessment, as its SUV in both normal and pathologic bone is representative of changes in bone metabolism (11–13).
To accurately assess tumor response it is necessary to measure a biomarker’s repeatability, defined as the variation in measurements when an experiment is repeated under the same conditions (14). The repeatability of 18F-FDG PET based on double-baseline studies has been well studied, permitting the development of PERCIST (15–17). No such criteria exist for evaluating quantitative 18F-NaF PET response.
A previous study on 18F-NaF PET evaluated the repeatability of bone uptake within the whole body (18). However, the repeatability of uptake in individual bone-lesion regions of interest (ROIs) can also be evaluated, allowing assessment of how a tumor’s response may uniquely contribute to the disease burden on the patient as a whole. The ability to evaluate the repeatability of uptake in an individual lesion would allow for assessment of response heterogeneity within the patient.
Here, we report on the first (to our knowledge) multicenter study assessing the repeatability of 18F-NaF PET uptake at the lesion level. In addition, we compared repeatability between 3 sites in a multicenter trial.
MATERIALS AND METHODS
Patient Population and Study Design
This was a prospective, nonrandomized, 2-arm, multicenter pharmacodynamic-imaging trial with the primary objective of determining the repeatability of 18F-NaF PET/CT imaging for evaluating osseous metastases in patients with metastatic castration-resistant prostate cancer. Eligible patients aged 18 y or older with progressive metastatic castration-resistant histologically proven prostate adenocarcinoma and bone scan–confirmed osseous metastases were enrolled for either docetaxel-based chemotherapy or androgen receptor–directed therapy between February 2012 and September 2014 at the University of Wisconsin Carbone Cancer Center (UWCCC), Memorial Sloan Kettering Cancer Center (MSKCC), or the National Cancer Institute (NCI). The exclusion criteria included active systemic treatment for prostate cancer, palliative radiation within 4 wk of registration, or any prior radioisotope treatment for prostate cancer. The Institutional Review Board and Radiation Safety Committee of each participating institution approved this study, and all subjects signed a written informed consent form. A sample size of 20 patients per site was proposed to evaluate repeatability. This sample size provided sufficient power (≥80%) to detect the anticipated excellent level of repeatability at each of the 3 study sites at the 1-sided 0.0167 significance level.
Quantitative Image Acquisition
Test–retest 18F-NaF PET/CT whole-body scans were to be performed 2–5 d apart and before the start of therapy. Patients were injected intravenously with a bolus of 111–185 MBq (3–5 mCi) of 18F-NaF and imaged 60 min after injection for 3 min per bed position from feet to skull vertex. Scans at UWCCC and MSKCC were acquired on a Discovery VCT PET/CT scanner (GE Healthcare), and scans at NCI were acquired on a Gemini PET/CT scanner (Philips Healthcare). The PET images were corrected for attenuation and scatter.
Scanner Harmonization
The scanners were quantitatively harmonized to obtain equivalent image quality and quantitative accuracy across scanners. The Discovery VCTs were harmonized to the Gemini using a uniform phantom (the National Electrical Manufacturers Association International Electrotechnical Commission body phantom) to measure the signal-to-noise ratio. Absolute calibration was measured by the recovery coefficient, defined as the ratio of the mean measured activity concentration to the true activity concentration in the ROI. Differences in recovery coefficient and signal-to-noise ratio between scanners were minimized by systemically varying the reconstruction parameters, such as number of iterations, number of subsets, and postreconstruction filter.
ROI Definition
Lesions were automatically identified and segmented by applying a CT mask to exclude soft-tissue uptake, followed by application of an SUV threshold of 15 g/mL to exclude additional activity with a low statistical likelihood of being malignant (18,19). Lesion contours on PET/CT images were verified by an experienced nuclear medicine physician, and contours smaller than 1.5 cm3 as measured by PET volume were excluded. Corresponding lesions were automatically matched between paired scans using articulated registration (20).
Two levels of SUV analysis were performed: lesion level, in which SUV metrics were extracted from each lesion ROI, and patient level, in which all lesions for a single patient were grouped into a patient ROI before SUV analysis. For both ROI levels, SUVmax was defined as the maximum SUV of the ROI and SUVtotal was defined as the total summed SUV of the ROI normalized to voxel volume. SUVmean was defined as the mean SUV within the lesion ROI or the mean of the SUVmean of all lesions within the patient ROI. The 2 levels of analysis are differentiated here using the terms lesion SUV for lesion-level SUV metrics and patient SUV for patient-level SUV metrics.
Statistical Analysis
The primary outcome measures for evaluating the repeatability of SUV metrics were intraclass correlation coefficient (ICC) and repeatability coefficient. Repeatability coefficient was calculated at an α-level of 0.05. ICC was estimated using a 2-way mixed-effects model.
We also investigated additional statistical measures for the repeatability of quantitative imaging biomarkers as recommended by the Quantitative Imaging Biomarkers Alliance or as previously reported in the literature (21). Test–retest agreement for each ROI was evaluated using Bland–Altman analysis for repeated observations (22,23).
Because the distribution of SUV metrics was highly skewed, statistical analyses were performed on natural-log transformations of measurements (21,22,24). Statistical analysis was conducted using MATLAB (The MathWorks), version R2014B; R (R Development Core Team), version 3.0; and SPSS (IBM Corp.), version 22.
For lesion-level analysis, ANOVA with repeated measurements was used to account for correlations between multiple lesions within the same patient and to calculate σ, the SD of differences between test and retest measurements (23).
The coefficient of variation of within-subject measurements was calculated as the ratio of σ to the grand mean. The critical percentage difference is the minimum percentage change needed to designate a change as significant (18), defined as  .
.
The 95% limit of agreement (LOA) was calculated for the ratio between test (mA) and retest (mB) measurements. Within the 95% LOA lies the ratio of mB/mA with a probability of 95%: Eq. 1where the bias B is the mean ratio between test and retest measurements. The 95% LOA is reported as the ratio of measurements in original units such that it can be applied to evaluate SUV data in original units (e.g., 95% LOA of (0.80, 1.20) would indicate that with 95% frequency, the ratio mB/mA will fall within this interval).
One-way ANOVA with pairwise comparisons and 2-sample t testing were used to assess whether the bias for each SUV metric significantly differed between sites. Two-sample F testing was used to evaluate variability across sites.
RESULTS
In total, we evaluated 411 18F-NaF–avid bone lesions from 35 patients with metastatic castration-resistant prostate cancer imaged at 1 of the 3 sites (Fig. 1). The patients were injected intravenously with 159.8 ± 9.7 MBq (mean ± SD) of 18F-NaF, and test–retest 18F-NaF PET/CT whole-body scans were performed 63 ± 7 min after injection (3 ± 2 d apart). Dose infiltration near the injection site was minimal in all scans. Two of the 35 patients underwent partial whole-body scans because the patient was repositioned during the scan. The lesion and patient characteristics are summarized in Table 1. The harmonization reconstruction parameters, including reconstruction method, grid size, subset, iteration, and postreconstruction filter, for each of the scanners are summarized in Table 2.

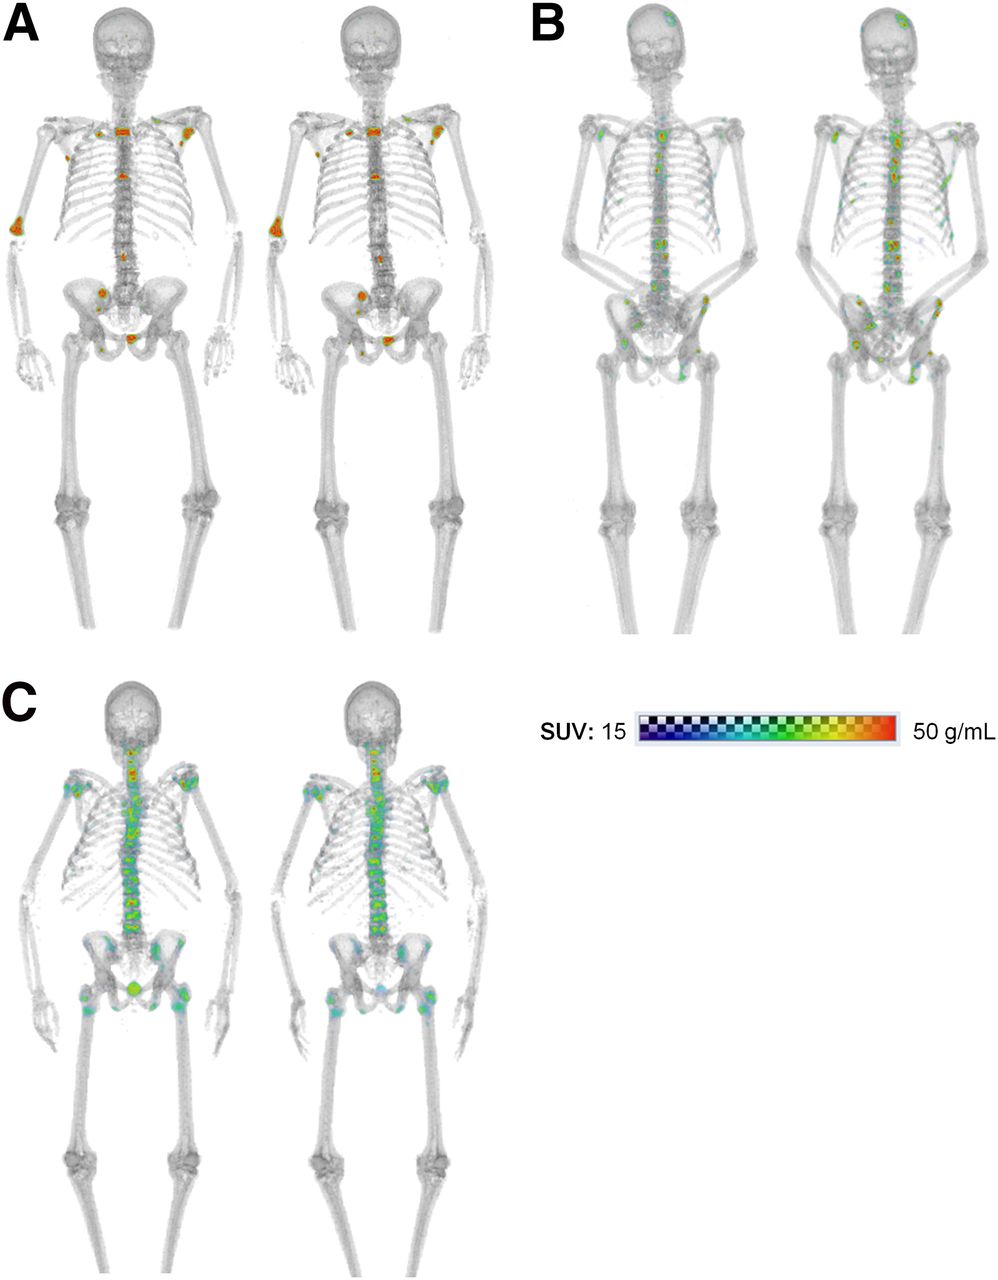
Whole-body paired baseline 18F-NaF PET/CT scans of men with metastatic castration-resistant prostate cancer: a 74-y-old imaged 3 d apart at UWCCC (A), a 57-y-old imaged 2 d apart at MSKCC (B), and a 69-y-old imaged 1 d apart at NCI (C).
Patient Demographics
Scanner Harmonization Parameters
The median number of lesions per patient at baseline was 8 (range, 1–69). The lesions were located across the skeleton, with the predominant site being the spine. For all lesions, median SUVmax was 44.8 (range, 19.6–225.5), SUVmean 23.7 (16.7–75.8), and SUVtotal 116.7 (26.4–5,628.0) g/mL. For all patients, median SUVmax was 86.4 (29.6–225.5), SUVmean 25.4 (18.4–51.1), and SUVtotal 2,429.3 (47.7–21,447) g/mL.
The relative difference between test and retest scans tended to be slightly greater at the lesion level than at the patient level. For all SUV metrics, relative difference had a narrower distribution for patient ROI than for lesion ROI (Fig. 2). SUVmean had the smallest relative difference for both ROI levels. For lesion ROI, SUVmean was the most repeatable (interquartile range, 2.5%) followed by SUVmax (4.4%) and SUVtotal (5.1%). For patient ROI, SUVmean was the most repeatable (2.0%), followed by SUVtotal (2.6%) and SUVmax (3.3%).

Box plots of relative differences in each SUV metric (log-transformed) for lesion-level ROIs (left; 411 lesions) and patient-level ROIs (right; 35 patients). Whiskers extend from minimum to maximum values.
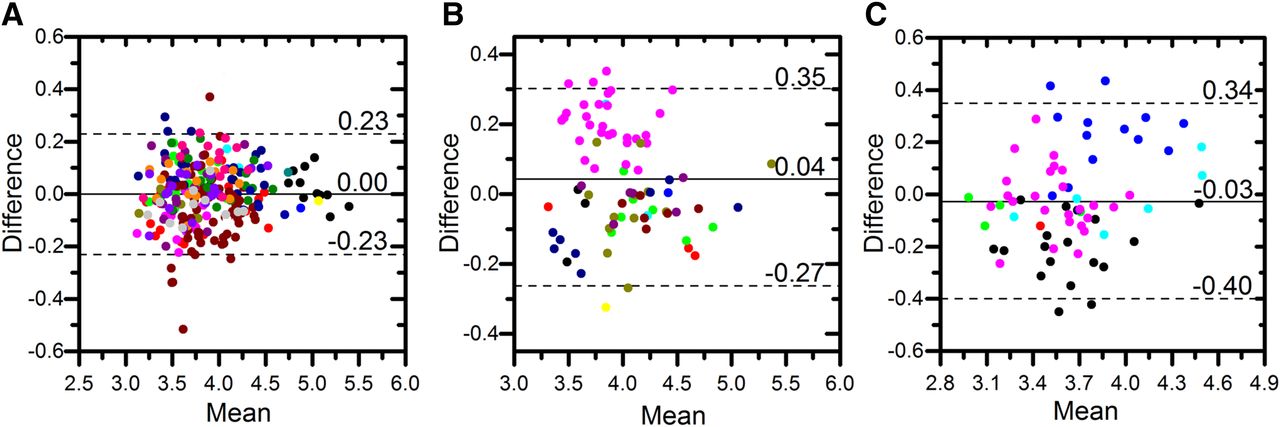
Figure 3 shows Bland–Altman plots for each lesion SUV metric. SUVmean had the smallest variability (repeatability coefficient, 0.13), followed by SUVmax (0.27) and SUVtotal (0.49). Figure 4 shows Bland–Altman plots for each patient SUV metric; again, SUVmean was the most repeatable (0.10), followed by SUVmax (0.24) and SUVtotal (0.36). Both mean and difference values have been log-transformed from SUV (g/mL). Both lesion-level and patient-level distributions had approximately normal distributions and heteroscedasticity.
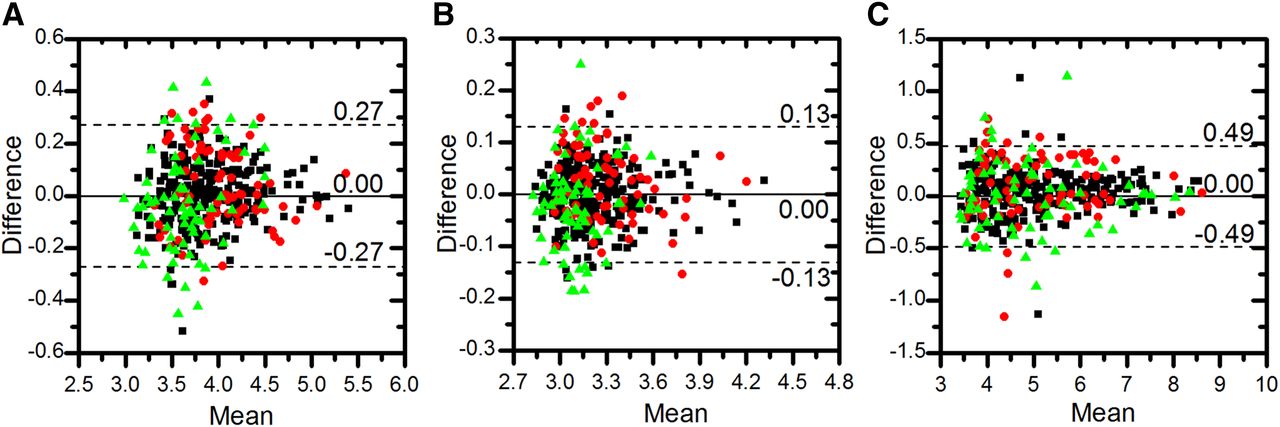
Bland–Altman plots of SUV metrics for all lesion-level ROIs (411 lesions): SUVmax (A), SUVmean (B), and SUVtotal (C). Different sites are indicated by different symbols (▪ = UWCCC, ● = MSKCC, and ▲ = NCI). Solid line denotes mean difference, and dotted lines denote upper and lower 95% LOA. Both mean and difference uptake values have been log-transformed.

Bland–Altman plots of SUV metrics for all patient-level ROIs (35 patients): SUVmax (A), SUVmean (B), and SUVtotal (C). Different sites are indicated by different symbols (▪ = UWCCC, ● = MSKCC, and ▲ = NCI). Solid line denotes mean difference, and dotted lines denote upper and lower 95% LOA. Both mean and difference values have been log-transformed.
According to the repeatability coefficient, coefficient of variation, and critical percentage difference, SUVmean was the most repeatable, followed by SUVmax and SUVtotal, at both the lesion level and the patient level (Tables 3 and 4). The 95% LOA defines the interval containing the test-to-retest measurement ratio for each SUV metric. At each site, there was a wide overlap in 95% LOA for all 3 metrics. At the lesion level, the 95% LOA was the narrowest for SUVmean (test-to-retest ratio, 1.00; 95% LOA, (0.88, 1.14)), followed by SUVmax (1.00; (0.76, 1.32)) and SUVtotal (1.04; (0.63, 1.71)). At the patient level, the overall test-to-retest ratio was 0.99 for SUVmean (95% LOA, (0.89, 1.10)), 1.00 for SUVmax (0.79, 1.26), and 1.00 for SUVtotal (0.70, 1.44). Across SUV metrics, the 95% LOA was consistently narrowest for SUVmean. Across sites, the 95% LOA was consistently narrowest, though not significantly different, for UWCCC.
Repeatability of Lesion 18F-NaF PET SUV Metrics
Repeatability of Patient 18F-NaF PET SUV Metrics
A comparison of overall coefficient of variation and ICC is shown in Figure 5. At both the lesion level and the patient level, ICC was the highest for SUVtotal, followed by SUVmean and SUVmax. Consistently, patient-level SUV metrics presented a lower coefficient of variation than did lesion-level metrics.

Overall ICC plotted against overall coefficient of variation of lesion-level (black) and patient-level (red) SUV metrics.
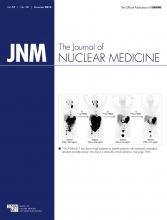
Shown in Figure 6 are Bland–Altman plots of lesion-level SUVmax by site. Both mean and difference values have been log-transformed from SUV (g/mL). MSKCC had a sample mean that was statistically significantly different (P = 0.004) from the other sites, and UWCCC had a significantly smaller variance (P < 0.001). In addition, the variance in SUVmean (P < 0.001) and SUVtotal (P < 0.001) was significantly smaller at UWCCC than at the other sites.
Bland–Altman plots of lesion SUVmax by site: UWCCC (265 lesions) (A), MSKCC (78 lesions) (B), and NCI (68 lesions) (C). Each point represents a lesion, and different subjects are indicated by different colors. Solid lines denote site-specific mean difference, and dotted lines denote site-specific upper and lower 95% LOA. Both mean and difference uptake values have been log-transformed.
At the patient level, the sole difference between sites was a significantly smaller variance in SUVtotal at UWCCC (P = 0.003) than at the other sites.
DISCUSSION
To our knowledge, this was the first multicenter study with results demonstrating the repeatability of multiple 18F-NaF PET SUV metrics—SUVmax, SUVmean, and SUVtotal—for both lesion-level and patient-level ROIs.
Although different guidelines exist for the interpretation of ICC, one of the most common guidelines defines an ICC range of 0.40–0.75 as moderate repeatability and an ICC higher than 0.75 as excellent repeatability (25). Although, at the lesion level, the 95% confidence intervals of the ICC for SUVmax, SUVmean, and SUVtotal were excellent for all sites, those at the patient level for SUVmean and SUVmax at MSKCC and NCI were not fully contained within the region of excellent repeatability. The patient accrual goal was not met because of an imbalance in accrual between the two arms of therapy, thus decreasing the statistical power for evaluating ICC.
In many cases in this study, there were multiple lesions per patient. As shown in the lesion-level Bland–Altman plots of SUVmax in Figure 6, multiple lesions within the same patient tended to show correlated repeatability. Thus, it was not possible to regard each lesion as independent. The intrapatient correlations were considered by implementing the Bland–Altman analysis for repeated measures (23).
Our repeatability results at the patient level support those of a previous 18F-NaF PET study on bone lesions by Kurdziel et al. (18). Despite differences in lesion segmentation methods, our ICC and critical percentage difference findings for SUVmax, SUVmean, and SUVtotal were similar to those of the previous study.
The application of both an uptake threshold and a volume threshold was used to minimize the probability of identifying benign disease. Although Kurdziel et al. used a segmentation SUV threshold of 10 (18), a later study by Rohren et al. showed that lesion ROIs identified using this threshold still included normal bone activity (19). One study showed that a lesion SUVmax of less than 12 g/mL always represented a site of benign disease (26). Another study showed that the lesion SUVmean for benign degenerative disease was 11.1 ± 3.8 g/mL (27). Therefore, in this study, we applied an SUV threshold of 15 to minimize the inclusion of benign disease.
The 18F-NaF PET findings were more repeatable than the findings of a multicenter 18F-FDG PET study on patients with lung cancer and gastrointestinal malignancies (17). Such effects as respiratory motion may lead to increased random error in 18F-FDG PET images of certain regions, more so in soft tissue than in bone (17). In comparing the repeatability of SUV metrics, one study also found SUVmean to be more repeatable than the SUVmax of individual lesions (28).
One important aspect of this multicenter study was that although the PET scans were acquired on different scanners with different acquisition parameters, the scanners were harmonized. Despite image harmonization, we found that for all 3 SUV metrics, the variance in lesion-level test–retest measurements was significantly smaller at UWCCC than at the other sites. The repeatability differences between sites might have been due to physiologic factors such as circadian rhythm or different degrees of conformation to the imaging protocol (29,30). For example, the mean (±SD) postinjection time (61 ± 1 min at UWCCC vs. 69 ± 9 min at MSKCC) and injected dose (178 ± 9 MBq at UWCCC vs. 136 ± 32 MBq at NCI) varied by site (Supplemental Table 1; supplemental materials are available at http://jnm.snmjournals.org).
There is active discussion on whether it is lesion or patient measurements that should be used to assess treatment response. In 18F-FDG PET, there are previous studies on the test–retest variability in uptake for individual lesions and for the whole patient (31). Weber et al. found that averaging the measurements of several lesions in a patient did not significantly affect the repeatability of the SUV metrics (17). Our study confirmed similar repeatability between lesion and patient ROIs. Measuring the repeatability of lesion ROIs enables evaluation of the lesion-specific response to therapy and may more comprehensively represent patient response.
The statistical limits of agreement for 18F-NaF PET SUV metrics were established at both the lesion level and the patient level such that 95% LOA (α = 0.05) could be applied to reflect true changes in uptake. An SUV percentage decrease to less than the 95% LOA lower limit can be considered response, and an increase to more than the upper limit can be considered progression.
CONCLUSION
The repeatability of 18F-NaF PET/CT–derived SUVmax, SUVmean, and SUVtotal was assessed for both lesion-level and patient-level ROIs in a multicenter prospective study on CRPC metastatic to bone. Low repeatability coefficients, high ICCs, and small coefficients of variation in test–retest scans were found. Patient-level repeatability was slightly superior to lesion-level repeatability, justifying the use of SUV both in individual lesions and across the whole body. These results can be used to establish quantitative criteria for 18F-NaF PET assessment of treatment response in patients with CRPC metastatic to bone.
DISCLOSURE
The costs of publication of this article were defrayed in part by the payment of page charges. Therefore, and solely to indicate this fact, this article is hereby marked “advertisement” in accordance with 18 USC section 1734. This study was supported by the Prostate Cancer Foundation (PCF) through the PCF Creativity Award and the PCF Mazzone Challenge Award to Drs. Liu and Jeraj and was conducted within the Prostate Cancer Clinical Trials Consortium (PCCTC). No other potential conflict of interest relevant to this article was reported.
Acknowledgments
We thank the patients who volunteered their time, and we thank the imaging technologists who acquired the data.
Footnotes
Published online Jul. 21, 2016.
- © 2016 by the Society of Nuclear Medicine and Molecular Imaging, Inc.
REFERENCES
- Received for publication May 10, 2016.
- Accepted for publication June 18, 2016.


Jump to section
Related Articles
Cited By...
- Full-Body Tumor Response Heterogeneity of Metastatic Neuroendocrine Tumor Patients Undergoing Peptide Receptor Radiopharmaceutical Therapy
- Phase 2 trial of a DNA vaccine (pTVG-HP) and nivolumab in patients with castration-sensitive non-metastatic (M0) prostate cancer
- Quantitative 18F-fluorodeoxyglucose positron emission tomography/computed tomography to assess pulmonary inflammation in COPD
- Quantitative Test-Retest Measurement of 68Ga-PSMA-HBED-CC in Tumor and Normal Tissue
- Observer Agreement and Accuracy of 18F-Sodium Fluoride PET/CT in the Diagnosis of Bone Metastases in Prostate Cancer
- Validation of the Semiautomatic Quantification of 18F-Fluoride PET/CT Whole-Body Skeletal Tumor Burden
- Reproducibility and Repeatability of Semiquantitative 18F-Fluorodihydrotestosterone Uptake Metrics in Castration-Resistant Prostate Cancer Metastases: A Prospective Multicenter Study