


Abstract
Accurate quantification of tracer uptake in small tumors using PET is hampered by the partial-volume effect as well as by the method of volume-of-interest (VOI) delineation. This study aimed to investigate the effect of partial-volume correction (PVC) combined with several VOI methods on the accuracy and precision of quantitative PET. Methods: Four image-based PVC methods and resolution modeling (applied as PVC) were used in combination with several common VOI methods. Performance was evaluated using simulations, phantom experiments, and clinical repeatability studies. Simulations were based on a whole-body 18F-FDG PET scan in which differently sized spheres were placed in lung and mediastinum. A National Electrical Manufacturers Association NU2 quality phantom was used for the experiments. Repeatability data consisted of an 18F-FDG PET/CT study on 11 patients with advanced non–small cell lung cancer and an 18F-fluoromethylcholine PET/CT study on 12 patients with metastatic prostate cancer. Results: Phantom data demonstrated that most PVC methods were strongly affected by the applied resolution kernel, with accuracy differing by about 20%–50% between full-width-at-half-maximum settings of 5.0 and 7.5 mm. For all PVC methods, large differences in accuracy were seen among all VOI methods. Additionally, the image-based PVC methods were observed to have variable sensitivity to the accuracy of the VOI methods. For most PVC methods, accuracy was strongly affected by more than a 2.5-mm misalignment of true (simulated) VOI. When the optimal VOI method for each PVC method was used, high accuracy could be achieved. For example, resolution modeling for mediastinal lesions and iterative deconvolution for lung lesions were 99% ± 1.5% and 99% ± 0.9% accurate, respectively, for spheres 15–40 mm in diameter. Precision worsened slightly for resolution modeling and to a larger extent for some image-based PVC methods. Uncertainties in delineation propagated into uncertainties in PVC performance, as confirmed by the clinical data. Conclusion: The accuracy and precision of the tested PVC methods depended strongly on VOI method, resolution settings, contrast, and spatial alignment of the VOI. PVC has the potential to substantially improve the accuracy of tracer uptake assessment, provided that robust and accurate VOI methods become available. Commonly used delineation methods may not be adequate for this purpose.
Quantitative PET provides clinical oncology with a powerful tool for diagnosis, staging, restaging, and response monitoring (1,2). To allow for appropriate quantification of radioactive tracer uptake, PET data need to be corrected for several physical effects, including decay, scatter, random coincidences, and attenuation. An effect not regularly corrected for, but having a major impact on PET accuracy in small tumors, is the partial-volume effect (PVE) (3).
PVE originates from the finite spatial resolution of the PET scanner, described by the point spread function (PSF), and the tissue fraction effect (4). In hot lesions, PVE causes a net spill-out of activity into the background, leading to considerable underestimation of the measured activity concentration (3–6). Although clinical application of partial-volume correction (PVC) has led to contradictory results to date (7), both accurate and precise PVC methods may have a significant clinical impact and substantially change quantitative reads (8).
Many PVC methods have been developed (4,7,9), such as the recovery coefficient method (5,6,10), the geometric transfer matrix (11), the Müller-Gärtner method (12), and iterative deconvolution (13,14). However, each method has its limitations, and new methodology is still being developed. Some are adaptations of the recovery coefficient method (15,16), but others are more refined, such as resolution modeling (17,18), adaptations of iterative deconvolution (19–21), adaptations of the geometric transfer matrix (22,23), and background-adapted PVC algorithms (24).
Besides being affected by PVE, PET accuracy is strongly affected by the applied volume-of-interest (VOI) method, noise level, and tumor-to-background ratio (25). In addition, several PVC methods use predefined VOI boundaries to correct for PVE. Hoetjes et al. argued that the performance of PVC methods may benefit from exact (e.g., CT-based) VOI definition (3). We therefore hypothesized that PVC performance, and hence PET accuracy, is strongly affected by VOI definition methodology.
Because PVC performance is a function of not only the PVC method and settings but also the VOI method and settings, their interplay may affect the accuracy and precision of PVE-corrected quantitative PET metrics. In the present study, we investigated the effect of several combinations of PVC methods and VOI methods on the accuracy and precision of PET using phantoms and simulations. We also investigated the impact of PVC on the repeatability of 18F-FDG and 18F-fluoromethylcholine PET in patients with advanced non–small cell lung cancer and metastatic prostate cancer, respectively.
MATERIALS AND METHODS
We used phantom experiments, simulations, and clinical data to evaluate PVC performance as a function of PVC method, VOI method, spatial kernel settings, noise-level, and alignment of VOI. The analyses are summarized in Supplemental Table 1, available at http://jnm.snmjournals.org.
PVC Methods
Four image-based PVC methods were applied: iterative deconvolution Lucy–Richardson PVC (3,14), background-adapted PVC (24) using local and global background regions, and mask-based spillover PVC (3,4). We optimized the spatial kernel settings using phantom data, setting the gaussian kernel at 5.0–7.5 mm (0.5-mm intervals).
Reconstruction-Based PVC
We applied the resolution modeling (17) approach (PSF reconstruction) as part of the reconstruction process provided by the vendor (Philips Healthcare). The default settings were used with noise regularization (1 PSF iteration, 6-mm regularization), implemented within binary, large-object ordered-subset time-of-flight iterative reconstruction.
VOI Methods
The following threshold-based VOI methods (in-house–developed software (26)) were applied to all data: 42% and 50% of the maximal voxel value, 42% and 50% of the maximal voxel value adapted for local background uptake, 50% and 70% of the peak value (i.e., average value of a 12-mm sphere positioned to yield the highest value) adapted for local background uptake, and iteratively defined background-adapted relative threshold level using the system PSF (27). In simulations, we also used the true sphere volume as VOI.
Phantom Experiments
We used a National Electrical Manufacturers Association NU2 quality phantom to calibrate the spatial resolution kernel for image-based PVC methods. The phantom contained 6 spheres with diameters ranging from 10 to 37 mm. Spheres and background were filled with 18F-FDG solutions of 12.38 and 1.46 kBq/mL, respectively. A 30-min scan was obtained on an Ingenuity TF PET/CT scanner (Philips Healthcare). Reconstruction was performed using ordered-subset time-of-flight iterative reconstruction with and without resolution modeling.
Simulations (25)
A mathematic phantom was derived from an 18F-FDG whole-body scan. Next, 10- to 40-mm-diameter spheres (5-mm intervals) were placed within mediastinum and lung. The voxel values within the spheres were set to 10 kBq/mL, providing local tumor-to-background ratios of about 6.7 and 3.3 for lung and mediastinum, respectively.
Using forward projection, we generated noise-free sinograms. In addition, we added noise to the sinograms using Poisson statistics simulating 3 noise levels, corresponding to data collected for 4, 3, and 2 min per bed position, as is typical for clinical practice. Noise-free images and images corresponding to data collected for 4, 3, and 2 min had liver uptake coefficients of variation of 6.2%, 13.2%, 13.6%, and 18.2%, respectively (as determined by a 3-cm spheric VOI placed in the right liver lobe). For each combination of sphere size and noise level, 10 sinograms were generated (except for noise-free sinograms).
Images were reconstructed using ordered-subset expectation maximization, with and without resolution modeling, and were postsmoothed with a 5-mm gaussian filter. The number of iterations (6) and subsets (16) was set such as to ensure a minimal level of convergence and to avoid limited contrast recovery. In this way, PVE was affected mainly by the spatial resolution and voxel size.
Clinical Data
Clinical repeatability data consisted of an 18F-FDG PET/CT study (28) on 11 patients with advanced non–small cell lung cancer and an 18F-fluoromethylcholine PET/CT study (29) on 12 patients with metastatic prostate cancer. At the time the patients underwent PET, they received no treatment. Both studies were approved by the Medical Ethical Committee of the VU Medical Centre, and the patients gave informed consent to participate.
The patients were scanned using a Gemini TF-64 PET/CT scanner (Philips Healthcare). They fasted for 6 and 4 h before undergoing 18F-FDG and 18F-fluoromethylcholine PET, respectively. PET/CT scans were acquired at 60 and 40 min after injection of 185 MBq of 18F-FDG and 200 MBq of 18F-fluoromethylcholine, respectively. Images were reconstructed using ordered-subset time-of-flight iterative reconstruction with 3 iterations and 33 subsets, with and without resolution modeling. All data were corrected for decay, scatter, random coincidences, and attenuation.
PVC Performance Metrics
For the phantom experiment and simulations, accuracy was calculated using the recovery coefficient, defined as follows: Eq. 1where ACmeasured is measured mean activity concentration (Bq/mL) and ACtrue is true (simulated) activity concentration (Bq/mL). Bias was calculated as follows:
 Eq. 2For volumetric accuracy, recovery coefficient and bias were calculated in the same manner (volumes [mL] instead of activity concentrations).
Activity concentration ratios were defined as follows: Eq. 3where ACpvc is mean activity concentration with PVC and ACuncorrected is mean activity concentration without PVC.
SUVmean, normalized to body weight, was calculated for clinical data. Total lesion glycolysis (TLG) was calculated as SUVmean × metabolically active lesion volume (mL). All metrics were derived with and without PVC.
Statistical Analysis
The normality of SUVs and TLGs was assessed with the Shapiro–Wilks test. The intraclass correlation coefficient (ICC; 2-way mixed model with an absolute agreement definition) was calculated for each combination of VOI and PVC method. For nonnormal distributions, log-transformed SUVmean and TLG were used to calculate ICC. Analyses were performed using SPSS Statistics, version 22.0 (IBM).
RESULTS
Phantom Experiments
Image-based PVC methods required that the applied spatial kernel be optimized for each VOI method. For all VOI methods, Lucy-Richardson PVC and spillover PVC demonstrated differences in recovery coefficients ranging from 0.2 to 0.5 between full width at half maximum (FWHM) settings of 5.0–7.5 mm. The accuracy of global-background–adapted PVC was not affected by FWHM setting and for local-background–adapted PVC the recovery coefficients demonstrated differences of only 0.03 to 0.3 between FWHM settings of 5.0–5.5, 6.0, and 6.5–7.5 mm. Large differences in accuracy among the various VOI methods were seen for all image-based PVC methods, especially for the 13- and 17-mm spheres (typically yielding overcorrection). Even for the optimal FWHMs, the PVC methods still failed for the 10-mm sphere.
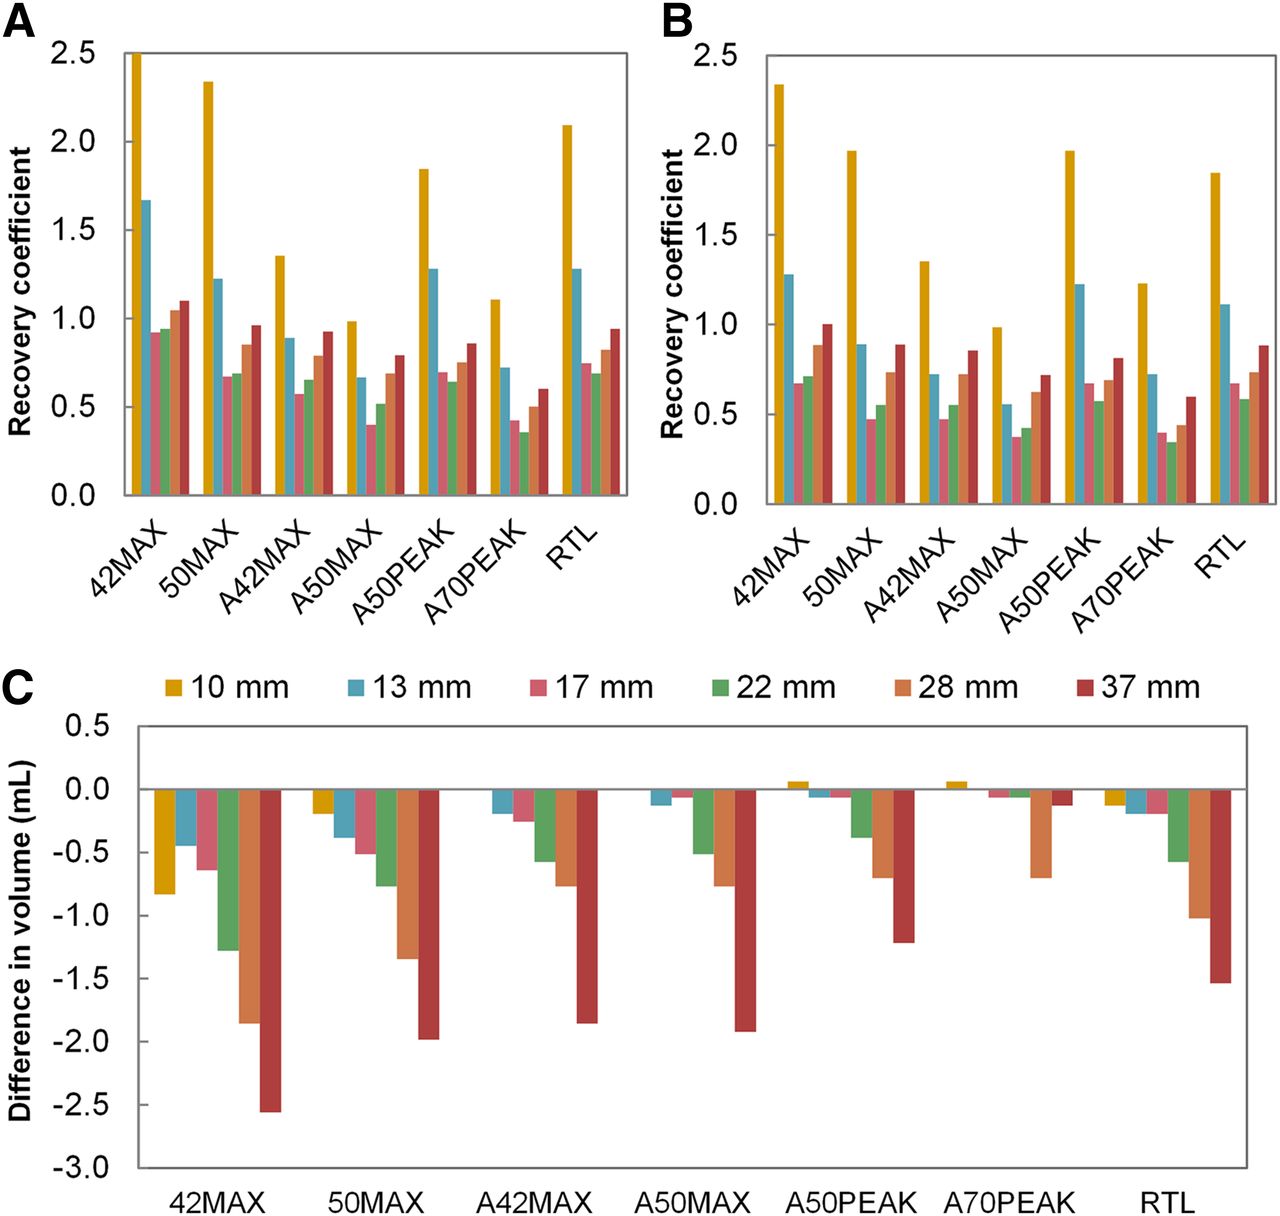
Volumetric accuracy was better in non-PSF reconstruction for the 17- to 37-mm spheres, excepting the 37-mm sphere delineated with 42% maximal (Figs. 1A and 1B). Notably, the 10- and 13-mm spheres were delineated more accurately using 42% maximal, 50% maximal, and relative threshold level in PSF reconstruction. The smallest differences in volumetric accuracy were seen for background-adapted VOIs. PET-based VOIs generated on PSF reconstructed images were smaller than those generated on non–PSF reconstructed images (Fig. 1C). No difference in volume was found for the 10-mm sphere delineated with background-adapted 42% maximal or background-adapted 50% maximal, whereas delineation with background-adapted 50% peak and background-adapted 70% peak provided negligibly larger volumes (0.064 mL larger).

Volume recovery coefficients for non–PSF PVC images (A) and PSF PVC images (B) per VOI method and sphere size, and differences in PET-based volumes between non–PSF PVC images and PSF PVC images (C). Negative volume differences indicate smaller volumes for PSF reconstructed images than for non–PSF reconstructed images. Key indicates sphere diameters. Ten-millimeter sphere delineated with 42% maximal had recovery coefficient of 3.9 in non–PSF reconstructed images. 42MAX = 42% of maximal voxel value; 50MAX = 50% of maximal voxel value; A42MAX = 42% of maximal voxel value adapted for local background uptake; A50MAX = 50% of maximal voxel value adapted for local background uptake; A50PEAK = 50% of peak voxel value adapted for local background uptake; A70PEAK = 70% of peak voxel value adapted for local background uptake; RTL = relative threshold level.
Simulations
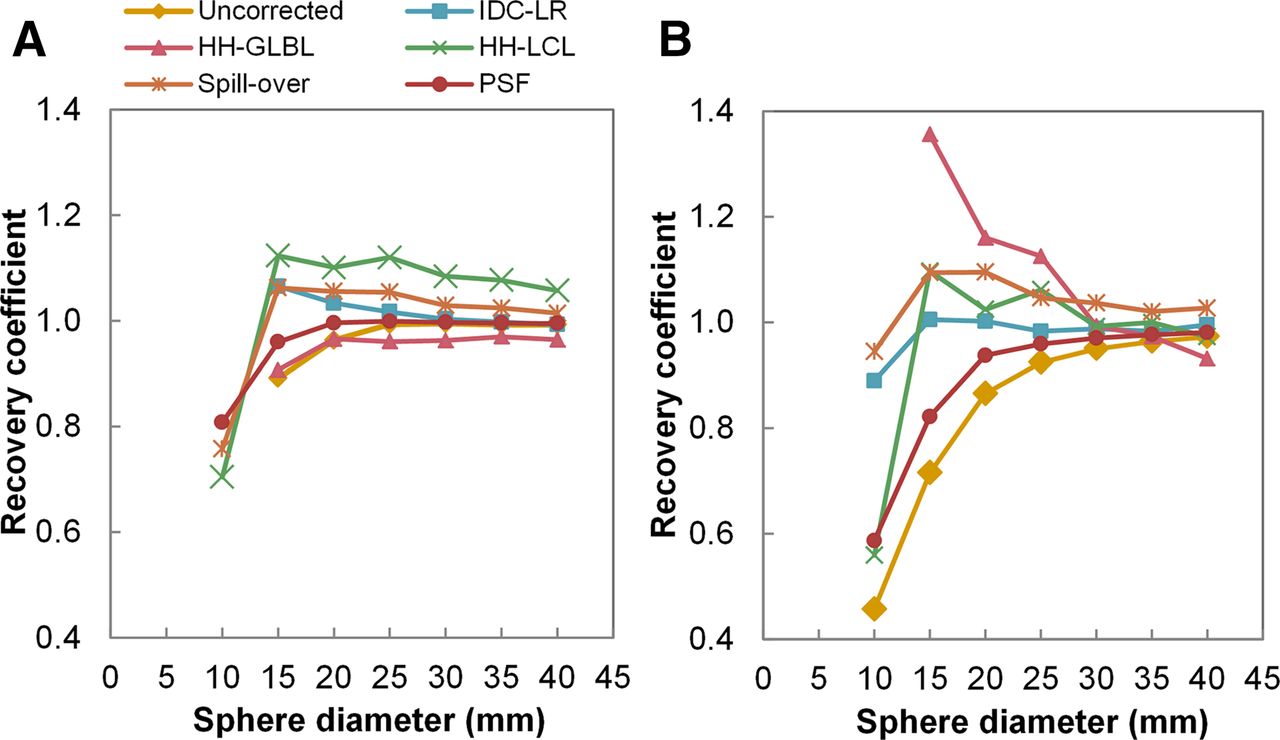
Large differences in PVC performance were seen among all VOI methods (Supplemental Figs. 1 and 2). The optimal combinations of PVC method and VOI method are shown in Figure 2 and Table 1. Generally, recovery coefficients were lower in lung than in mediastinum. For spheres 15 mm or larger, PSF reconstruction with adapted 70% peak yielded the highest accuracy in mediastinum (99% ± 1.5%), whereas Lucy–Richardson PVC with adapted 42% maximal yielded the highest accuracy in lung (99% ± 0.9%). Global- and local-background–adapted PVCs considerably overcorrected true activity concentration when using background-adapted 42% maximal, background-adapted 50% maximal, background-adapted 50% peak, or background-adapted 70% peak. Both local-background–adapted PVC and spillover PVC performed excellently (100% accuracy overall) when using true (simulated) VOIs and were within 10% accurate when using relative-threshold-level VOIs (≥15 mm). Figure 3 demonstrates the percentage bias in sphere volumes in lung. We found a strong relationship between underestimation of true volume and overcorrection of activity concentration recovery coefficients for global- and local-background–adapted PVCs (recovery coefficients up to 3 and 2.25, respectively). Spillover PVC was moderately affected (recovery coefficients ≤ 1.33), and the recovery coefficients for Lucy–Richardson PVC and PSF reconstruction did not significantly correlate with a negative bias in volume (recovery coefficients, 0.6–1.05). There was a moderate inverse correlation between recovery coefficients and a positive bias in volume for all methods other than PSF reconstruction. Similar correlations were observed for mediastinal spheres, but bias in volume, and thus in activity concentration, was larger.

Activity concentration recovery coefficients as function of sphere diameter for all PVC methods, and uncorrected data, with their optimal PET-based VOI method (Table 1) for spheres in mediastinum (A) and lung (B). Missing values are due to delineation failure. HH-GLBL = global-background–adapted PVC; IDC-LR = iterative deconvolution Lucy–Richardson PVC; HH-LCL = local-background–adapted PVC.
Optimal PET-Based VOI Method for Each PVC Method, in Lung and Mediastinum
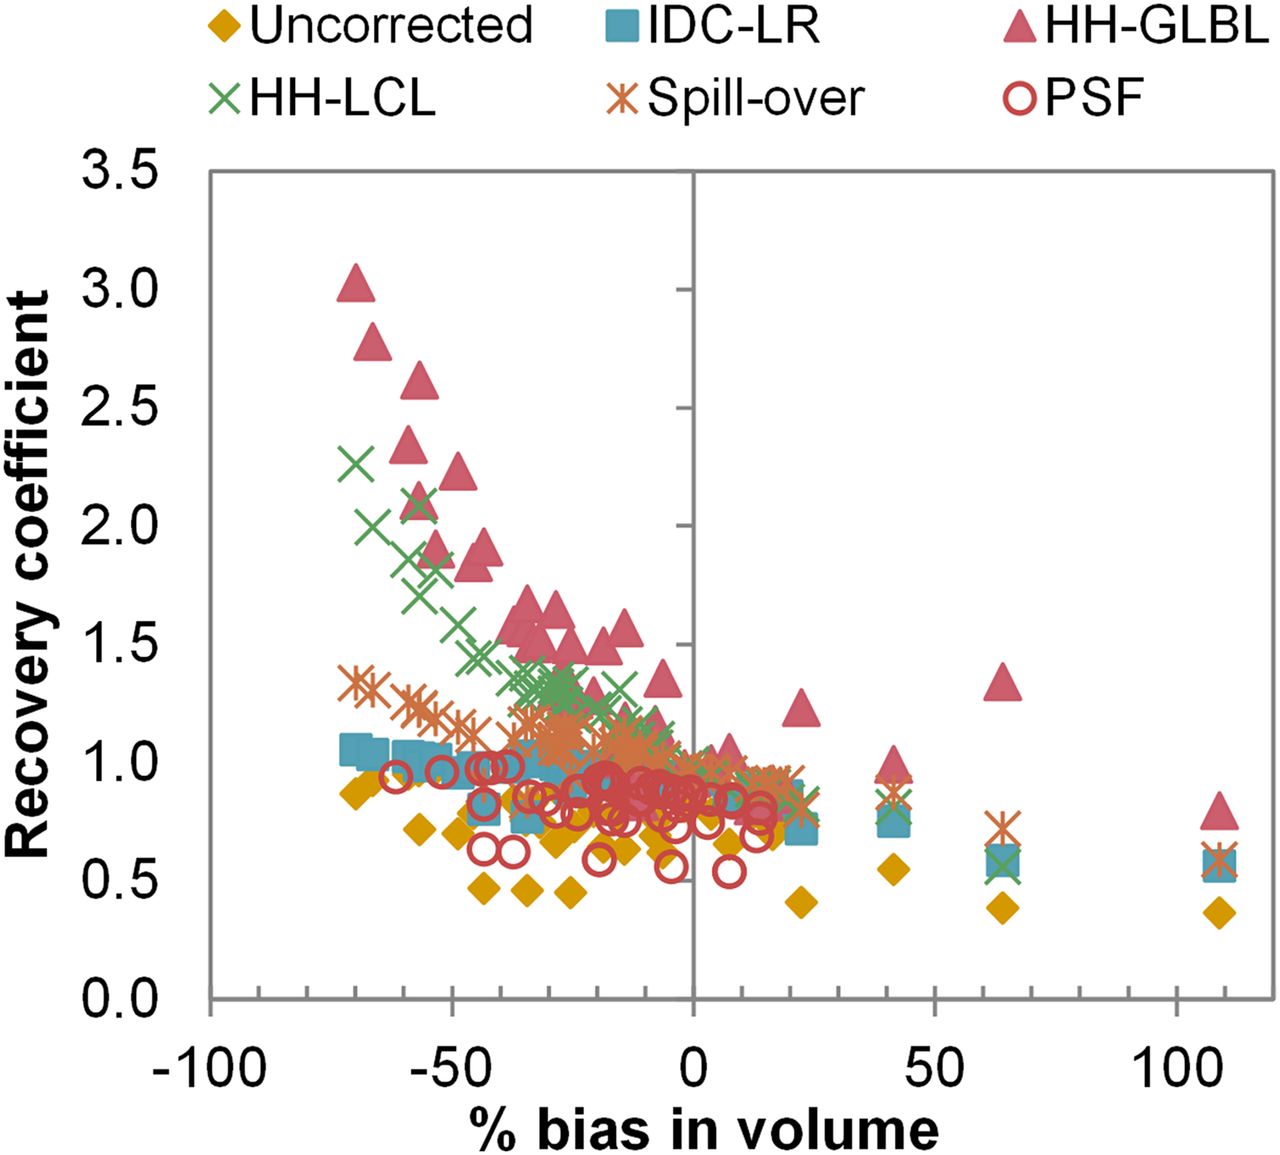
Activity concentration recovery coefficients as function of volumetric bias. Shown are results for all VOI methods for spheres in lung (noise-free images). HH-LCL = local-background–adapted PVC; IDC-LR = iterative deconvolution Lucy–Richardson PVC; HH-GLBL = global-background–adapted PVC.
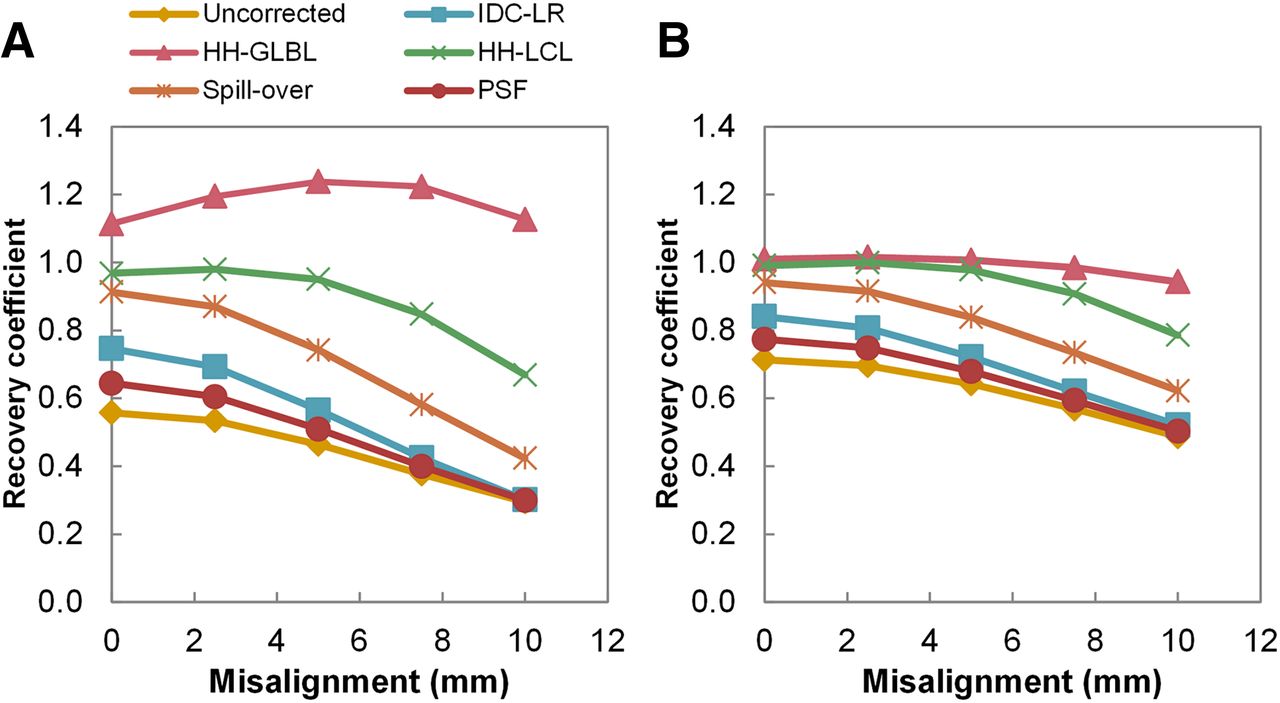
Figure 4 illustrates activity concentration recovery coefficients as a function of misalignment of true VOI. Global-background–adapted PVC demonstrated only a slight decrease in recovery coefficient for a misalignment of 10 mm or more and was more than 94% accurate in lung but overcorrected by up to 20% in mediastinum. Local-background–adapted PVC was 98%–100% accurate when misalignment was less than 5 mm in lung and mediastinum. Spillover PVC performed slightly worse than local-background–adapted PVC. The performance of Lucy–Richardson PVC and PSF reconstruction was poorest when true VOI was used, but their sensitivity to misalignment was similar to that of local-background–adapted PVC and spillover PVC. Similar trends were obtained for all sphere sizes, but sensitivity to misalignment increased with decreasing sphere size.

Activity concentration recovery coefficients as function of misalignment of true VOI. Shown are results from 15-mm (A) and 25-mm (B) spheres in lung (noise-free images). HH-LCL = local-background–adapted PVC; IDC-LR = iterative deconvolution Lucy–Richardson PVC; HH-GLBL = global-background–adapted PVC.
There was a positive association between noise level and recovery coefficient, with recovery coefficients becoming larger as VOI thresholds increased. The activity concentration ratios of mediastinal spheres increased with noise level for spillover PVC, global-background–adapted PVC, and local-background–adapted PVC when background-adapted VOIs were used, whereas in lung these ratios were equal for all noise levels (Fig. 5; similar but inverse trends were observed for volumes). In contrast, the results for noise-free images were similar to those for the highest noise level. With true (simulated) VOI, recovery coefficients were similar at all noise levels, both in mediastinum and in lung.
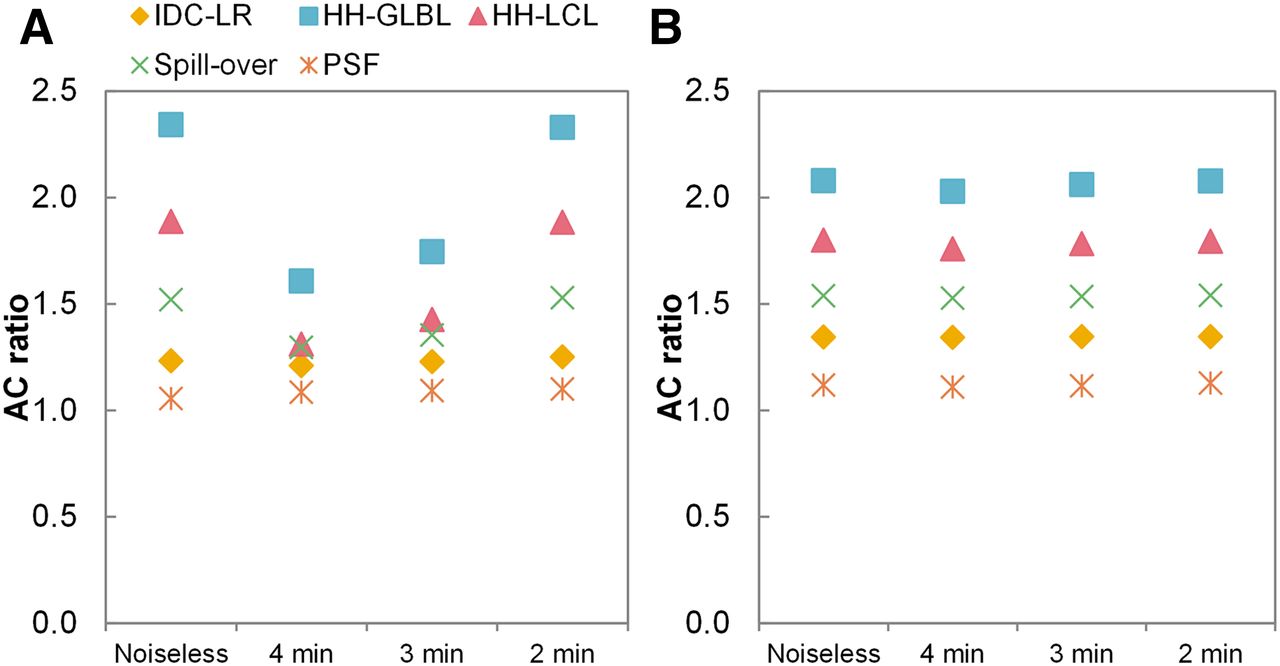
Activity concentration ratios as function of simulated acquisition time (thus, noise level). Shown are results from background-adapted 50% peak for 20-mm sphere (corresponding to median volumes of 18F-FDG and 18F-fluoromethylcholine PET cohorts delineated with background-adapted 50% peak) in mediastinum (A) and lung (B), respectively. AC = activity concentration; IDC-LR = iterative deconvolution Lucy–Richardson PVC; HH-GLBL = global-background–adapted PVC; HH-LCL = local-background–adapted PVC.
The impact of PVC on precision for spheres in lung is illustrated in Figure 6. In general, PVC increased SDs—an effect that was most pronounced for global- and local-background–adapted PVCs. Precision depended on the applied combination of VOI method and PVC method. When the true volume was used, the SDs were smallest, suggesting that uncertainties in PET-based VOI performance propagate into uncertainties in PVC performance. PET-based VOIs generally resulted in larger SDs in mediastinum than in lung.

SDs of recovery coefficients for all combinations of PVC method. Shown are results for 20-mm spheres in lung (corresponding to median volumes of 18F-FDG and 18F-fluoromethylcholine PET cohorts delineated with background-adapted 50% peak). y-axis is scaled for visual interpretation; SD of global-background–adapted PVC using background-adapted 70% peak was 0.049. IDC-LR = iterative deconvolution Lucy–Richardson PVC; HH-GLBL = global-background–adapted PVC; HH-LCL = local-background–adapted PVC; 42MAX = 42% of maximal voxel value; 50MAX = 50% of maximal voxel value; A42MAX = 42% of maximal voxel value adapted for local background uptake; A50MAX = 50% of maximal voxel value adapted for local background uptake; A50PEAK = 50% of peak voxel value adapted for local background uptake; A70PEAK = 70% of peak voxel value adapted for local background uptake; RTL = relative threshold level.
Clinical Data
Table 2 describes the clinical cohorts. The feasibility (i.e., percentage of lesions successfully delineated) of the VOI methods was better in PSF reconstructed images than non–PSF reconstructed images (Supplemental Tables 2 and 3). Global-background–adapted PVC failed (providing negative activity concentrations) in 2.4% and 2.8% of lesions in the 18F-FDG and 18F-fluoromethylcholine PET cohorts, respectively.
Patient Characteristics
ICCs were calculated to quantify, and facilitate comparison between, the repeatability of SUVmean and TLG (Fig. 7). Repeatability was best for uncorrected SUVmean (ICC, ∼0.97–0.98), with comparable SUVmean ICCs for Lucy–Richardson PVC, spillover PVC, and PSF reconstruction. The ICCs for local-background–adapted PVC were slightly lower, depending on the VOI method. For all VOI methods, global-background–adapted PVC demonstrated the worst SUVmean repeatability (ICC, ∼0.77–0.83). The SUVmean ICCs were comparable between VOI methods, except for global- and local-background–adapted PVCs. All PVE-corrected TLGs had ICCs almost equal to uncorrected TLG, except for PSF reconstruction. Similar trends in ICCs were seen among the volumes delineated with the various VOI methods (Supplemental Table 4) and their respective TLGs. Overall, ICCs were lower for the 18F-fluoromethylcholine PET cohort than for the 18F-FDG PET cohort.

ICCs of SUVmean (A) and TLG (B) for all combinations of PVC method. Shown are results for 18F-FDG PET cohort. Error bars represent 95% confidence intervals. Similar results were obtained for 18F-fluoromethylcholine PET cohort (Supplemental Fig. 3). IDC-LR = iterative deconvolution Lucy–Richardson PVC; HH-GLBL = global-background–adapted PVC; HH-LCL = local-background–adapted PVC; 42MAX = 42% of maximal voxel value; 50MAX = 50% of maximal voxel value; A42MAX = 42% of maximal voxel value adapted for local background uptake; A50MAX = 50% of maximal voxel value adapted for local background uptake; A50PEAK = 50% of peak voxel value adapted for local background uptake; A70PEAK = 70% of peak voxel value adapted for local background uptake; RTL = relative threshold level.
DISCUSSION
PVE introduced substantial error to the quantification of tracer uptake in mediastinal lesions smaller than 25 mm in diameter and lung lesions smaller than 30 mm. The current guidelines for response evaluation with PET do not include PVC (2,30,31). PERCIST (2) advises assessment of only tumors larger than 2 cm at baseline, to avoid overestimation of metabolic response with shrinkage during therapy, whereas the European Organization for Research and Treatment of Cancer (31) merely recommends documentation of tumor size in relation to scanner resolution. However, it is unclear how lesion selection strategies in metastasized disease affect the clinical performance of imaging biomarkers of response, especially in the case of targeted therapy with potentially heterogeneous inter- or intralesional target expression. Of note, the median volumes of lesions in the 18F-FDG and 18F-fluoromethylcholine cohorts corresponded to 20- to 22-mm equal-volume spheres—well within the range of lesions affected by PVE. PVE may also compromise diagnosis or prognosis when SUV-based thresholds are used in small tumors (7), even when guidelines for scanner calibration, image acquisition, and reconstruction are implemented (32). Taken together, these factors lead us to estimate that appropriate PVC may prove to be of greater clinical importance than considered so far. Our results demonstrated that PVC methods have the potential to be accurate and precise. However, the performance of PVC depends heavily on the applied VOI method and factors influencing VOI method performance, such as lesion size, tumor-to-background ratio, noise, and spatial alignment. We recommend that the focus of future research into PVC be to develop robust and standardized PVC–VOI combinations and to assess their clinical impact using valid clinical reference standards.
Phantom and Simulation Studies
Adjustment of FWHM for the image-based PVC methods had a major effect on the performance of most methods. Lucy–Richardson PVC and spillover PVC substantially differed in accuracy between different FWHM settings, with the recovery coefficient increasing with the FWHM setting. The reason for this difference was most likely the fact that both methods directly use the applied FWHM for PVC, warranting accurate calibration. The performance of global-background–adapted PVC was equal for all FWHM settings, whereas local-background–adapted PVC differed for only some of the settings. For that PVC method, it is advisable that the FWHM not be underestimated, ensuring that the entire spill-out of signal is contained within the spill-out region, in accordance with the results of Hofheinz et al. (24).
VOIs were generated on both PSF reconstructed images and non–PSF reconstructed images. Therefore, differences in volume and volumetric accuracy between the two were assessed. In general, PSF reconstruction resulted in smaller VOIs, most likely because of improved tumor-to-background ratios and enhanced edges. However, volumetric accuracy was worse, apart from some VOIs generated on the smallest spheres.
In simulations, the performance of PVC differed between VOI methods. Recovery coefficients tended to be lower for spheres in lung than in mediastinum, which in the case of the simulated uniform spheres can be explained by a larger PVE in lung due to a higher tumor-to-background ratio. Without PVC, activity concentrations obtained with adapted 70% peak proved most accurate. This VOI method results in very small volumes, including only the core of spheres and thereby bypassing the PVE, which occurs mainly at lesion edges. PSF reconstruction increased accuracy by 2%–16%, with the increase being most pronounced for the smallest spheres. Even though accuracy was only moderately improved in lung, VOI methods tended to be more feasible on PSF reconstructed images (Supplemental Tables 2 and 3). Whereas Teo et al. found iterative deconvolution to perform optimally in a phantom study when an 80% maximal VOI was applied (13), our simulation study suggested that Lucy–Richardson PVC performs excellently using background-adapted VOIs with a fixed threshold. Global- and local-background–adapted PVCs were sensitive to underestimation of volume, probably because of inclusion of the sphere activity concentration within the spill-out region, thus substantially overestimating the true activity concentration (Fig. 3). Overall, local-background–adapted PVC performed better than global-background–adapted PVC, most likely because the former can account for heterogeneity of activity within the background. Spillover PVC had excellent performance using relative threshold level and adapted 42% maximal, with accuracies of 104% ± 2.0% and 105% ± 3.3% for spheres 15 mm or larger in mediastinum and lung, respectively. Notably, when the true VOI was used, spillover PVC, local-background–adapted PVC, and global-background–adapted PVC performed excellently (accuracy, ∼100%). This is understandable since theoretically, with homogeneous uptake, accuracy should be 100% when these methods are applied using perfect tumor boundaries and true FWHM. In addition, the true VOI demonstrated the highest precision. However, in the clinical setting, perfect alignment between CT and PET images is not realistic because of patient movement and breathing, and the CT-based anatomic volume may include nonviable tumor tissue. Thus, application of CT-based VOIs when using local-background–adapted PVC or spillover PVC may result in less accurate results because of sensitivity to misalignment of the VOI (Fig. 4) and inclusion of nonviable tumor tissue. Global-background–adapted PVC was unaffected by misalignment for spheres 20 mm or larger, most likely because of the large background region. However, some dependency on tumor-to-background ratio was seen using the true VOI (20% overcorrection in mediastinum).
PVC methods directly using VOI boundaries (i.e., spillover PVC, global-background–adapted PVC, and local-background–adapted PVC) differed considerably between noise levels for mediastinal spheres when background-adapted VOIs were applied. In contrast, similar performance was observed for all PVC methods at each noise level in lung, where high contrast resulted in very similar VOI delineations between noise levels. Thus, at low contrast, background-adapted VOIs become unreliable, propagating into an unreliable performance for PVC methods sensitive to volumetric accuracy.
PVC negatively affected precision to only a small extent (Fig. 6), except for global- and local-background–adapted PVCs, for which SDs increased considerably. Overall, background-adapted 50% peak seemed most precise when image-based PVC was applied, most likely because peak values are less sensitive to noise than maximal values.
Clinical Studies
A previous study showed PVC to have no significant effect on tracer uptake repeatability, but only one PET-based VOI method (adapted 50% maximal) was used in that study (3). In the present study, the repeatability of SUVmean using the various VOI delineation methods was consistent—with comparable ICCs—after all types of PVC except for local-background–adapted and global-background–adapted PVC. Those two demonstrated large differences in ICC among various VOI methods and broader confidence intervals overall, illustrating worsened precision in accordance with the precisions observed in the simulations.
Erlandsson et al. proposed using PVE-corrected TLG in clinical settings, since uncorrected SUV might retain important volumetric information that is lost when SUV is corrected (7). Our results demonstrated that corrected TLG and uncorrected TLG had similar repeatability characteristics (Fig. 6). ICCs were similar among all PVC methods except for PSF reconstruction. The difference in the latter was most likely caused by the similarity between trends in the ICCs of TLG between VOI methods and trends in the ICCs of VOI volumes (Supplemental Table 4), emphasizing the importance of volumetric information to precision in PVC. For global- and local-background–adapted PVCs applied with their optimal VOI methods, PVE-corrected TLG might be suitable for acquiring data with optimal accuracy and precision.
Limitations
In phantoms and simulations, lesions are spheric and have homogeneous uptake. In reality, however, tumors rarely have spheric dimensions, let alone homogeneous uptake. Yet, we observed PVC-performance trends similar to those for clinical data, and the simulations allowed us to gain insight into the performance of PVC methods with the advantage of known (simulated) truth. In addition, the quantitative accuracy of PET can be negatively affected not only by PVE but by motion blurring due to breathing and peristaltic movement. To mitigate the effects of breathing, for example, respiration-gated PET/CT studies may be performed (33). Respiration-gated PET/CT is, however, not yet routinely applied in all centers.
CONCLUSION
We investigated the performance of PVC as a function of VOI delineation, resolution settings, tumor-to-background ratio, and noise. We conclude that the investigated PVC methods may greatly improve the quantitative accuracy of oncologic PET studies while maintaining good precision. However, the performance of PVC depends heavily on the VOI method and differs considerably between lung and mediastinum. For most image-based PVC methods, it is critical that there be no more than a 2.5-mm error in the spatial alignment of the VOI and tumor. Some methods that directly use predefined VOIs to correct PVE are less dependent on correct alignment but more sensitive to volumetric accuracy. Furthermore, uncertainties in PET-based VOIs propagate into uncertainties in PVC performance. PVC can substantially improve the accuracy with which tumors 15–25 mm in diameter are quantified in oncologic PET studies. However, without highly accurate and precise VOI methods, PVC may actually worsen accuracy and precision. Even with contemporary scanners and modern reconstruction methods, quantification of tracer uptake in tumors smaller than 15 mm in diameter is still not recommended.
DISCLOSURE
The costs of publication of this article were defrayed in part by the payment of page charges. Therefore, and solely to indicate this fact, this article is hereby marked “advertisement” in accordance with 18 USC section 1734. No potential conflict of interest relevant to this article was reported.
Footnotes
Published online May 26, 2016.
- © 2016 by the Society of Nuclear Medicine and Molecular Imaging, Inc.
REFERENCES
- Received for publication February 5, 2016.
- Accepted for publication April 22, 2016.


Jump to section
Related Articles
Cited By...
- Lymph Node Staging with a Combined Protocol of 18F-FDG PET/MRI and Sentinel Node SPECT/CT: A Prospective Study in Patients with FIGO I/II Cervical Carcinoma
- Automated Segmentation of Baseline Metabolic Total Tumor Burden in Diffuse Large B-Cell Lymphoma: Which Method Is Most Successful? A Study on Behalf of the PETRA Consortium