
Main menu

  • Home
  • Content
    • Current
    • Ahead of print
    • Past Issues
    • JNM Supplement
    • SNMMI Annual Meeting Abstracts
    • Continuing Education
    • JNM Podcasts
  • Subscriptions
    • Subscribers
    • Institutional and Non-member
    • Rates
    • Journal Claims
    • Corporate & Special Sales
  • Authors
    • Submit to JNM
    • Information for Authors
    • Assignment of Copyright
    • AQARA requirements
  • Info
    • Reviewers
    • Permissions
    • Advertisers
  • About
    • About Us
    • Editorial Board
    • Contact Information
  • More
    • Alerts
    • Feedback
    • Help
    • SNMMI Journals
  • SNMMI
    • JNM
    • JNMT
    • SNMMI Journals
    • SNMMI

User menu

  • Subscribe
  • My alerts
  • Log in
  • My Cart

Search

  • Advanced search
Journal of Nuclear Medicine
  • SNMMI
    • JNM
    • JNMT
    • SNMMI Journals
    • SNMMI
  • Subscribe
  • My alerts
  • Log in
  • My Cart
Journal of Nuclear Medicine

Advanced Search

  • Home
  • Content
    • Current
    • Ahead of print
    • Past Issues
    • JNM Supplement
    • SNMMI Annual Meeting Abstracts
    • Continuing Education
    • JNM Podcasts
  • Subscriptions
    • Subscribers
    • Institutional and Non-member
    • Rates
    • Journal Claims
    • Corporate & Special Sales
  • Authors
    • Submit to JNM
    • Information for Authors
    • Assignment of Copyright
    • AQARA requirements
  • Info
    • Reviewers
    • Permissions
    • Advertisers
  • About
    • About Us
    • Editorial Board
    • Contact Information
  • More
    • Alerts
    • Feedback
    • Help
    • SNMMI Journals
  • View or Listen to JNM Podcast
  • Visit JNM on Facebook
  • Join JNM on LinkedIn
  • Follow JNM on Twitter
  • Subscribe to our RSS feeds
Research ArticleClinical Investigations

18F-Fluoromisonidazole Quantification of Hypoxia in Human Cancer Patients Using Image-Derived Blood Surrogate Tissue Reference Regions

Mark Muzi, Lanell M. Peterson, Janet N. O’Sullivan, James R. Fink, Joseph G. Rajendran, Lena J. McLaughlin, John P. Muzi, David A. Mankoff and Kenneth A. Krohn
Journal of Nuclear Medicine August 2015, 56 (8) 1223-1228; DOI: https://doi.org/10.2967/jnumed.115.158717
Mark Muzi
1Department of Radiology, University of Washington, Seattle, Washington
  • Find this author on Google Scholar
  • Find this author on PubMed
  • Search for this author on this site
Lanell M. Peterson
1Department of Radiology, University of Washington, Seattle, Washington
  • Find this author on Google Scholar
  • Find this author on PubMed
  • Search for this author on this site
Janet N. O’Sullivan
2School of Mathematics, Department of Statistics, University College Cork, Cork, Ireland
  • Find this author on Google Scholar
  • Find this author on PubMed
  • Search for this author on this site
James R. Fink
1Department of Radiology, University of Washington, Seattle, Washington
  • Find this author on Google Scholar
  • Find this author on PubMed
  • Search for this author on this site
Joseph G. Rajendran
1Department of Radiology, University of Washington, Seattle, Washington
  • Find this author on Google Scholar
  • Find this author on PubMed
  • Search for this author on this site
Lena J. McLaughlin
1Department of Radiology, University of Washington, Seattle, Washington
  • Find this author on Google Scholar
  • Find this author on PubMed
  • Search for this author on this site
John P. Muzi
1Department of Radiology, University of Washington, Seattle, Washington
  • Find this author on Google Scholar
  • Find this author on PubMed
  • Search for this author on this site
David A. Mankoff
3Department of Radiology, University of Pennsylvania, Philadelphia, Pennsylvania
  • Find this author on Google Scholar
  • Find this author on PubMed
  • Search for this author on this site
Kenneth A. Krohn
1Department of Radiology, University of Washington, Seattle, Washington
  • Find this author on Google Scholar
  • Find this author on PubMed
  • Search for this author on this site
  • Article
  • Figures & Data
  • Supplemental
  • Info & Metrics
  • PDF
Loading

Article Figures & Data

Figures

  • Tables
  • Additional Files
  • FIGURE 1.
    • Download figure
    • Open in new tab
    • Download powerpoint
    FIGURE 1.

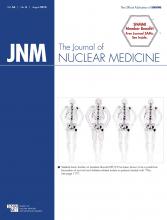
    18F-FMISO image analysis. MR image (A) registered to a PET 18F-FMISO image (B) showing placement of 2-cm-diameter cerebellar regions of interest to determine surrogate blood activity. Example of cardiac (3-cm diameter) and aortic region of interest (1-cm diameter) on low-dose CT scan used for attenuation correction (C) and PET 18F-FMISO scan (D). Patient examples of 18F-FMISO tumor uptake appear in supplemental materials.

  • FIGURE 2.
    • Download figure
    • Open in new tab
    • Download powerpoint
    FIGURE 2.

    Correlation of blood and ID blood. (A) Normalized injected dose (MBq/kg) showed poor correlation (R2 = 0.42, n = 223) to measured blood activity (kBq/mL). (B) Bland–Altman plot of data shows unusual structure with points generally lying obliquely to mean, indicating poor linear relationship. Regression (C) and Bland–Altman (D) plots between measured blood and surrogate blood regions (ID blood) showed high correlation at R2 = 0.84.

  • FIGURE 3.
    • Download figure
    • Open in new tab
    • Download powerpoint
    FIGURE 3.

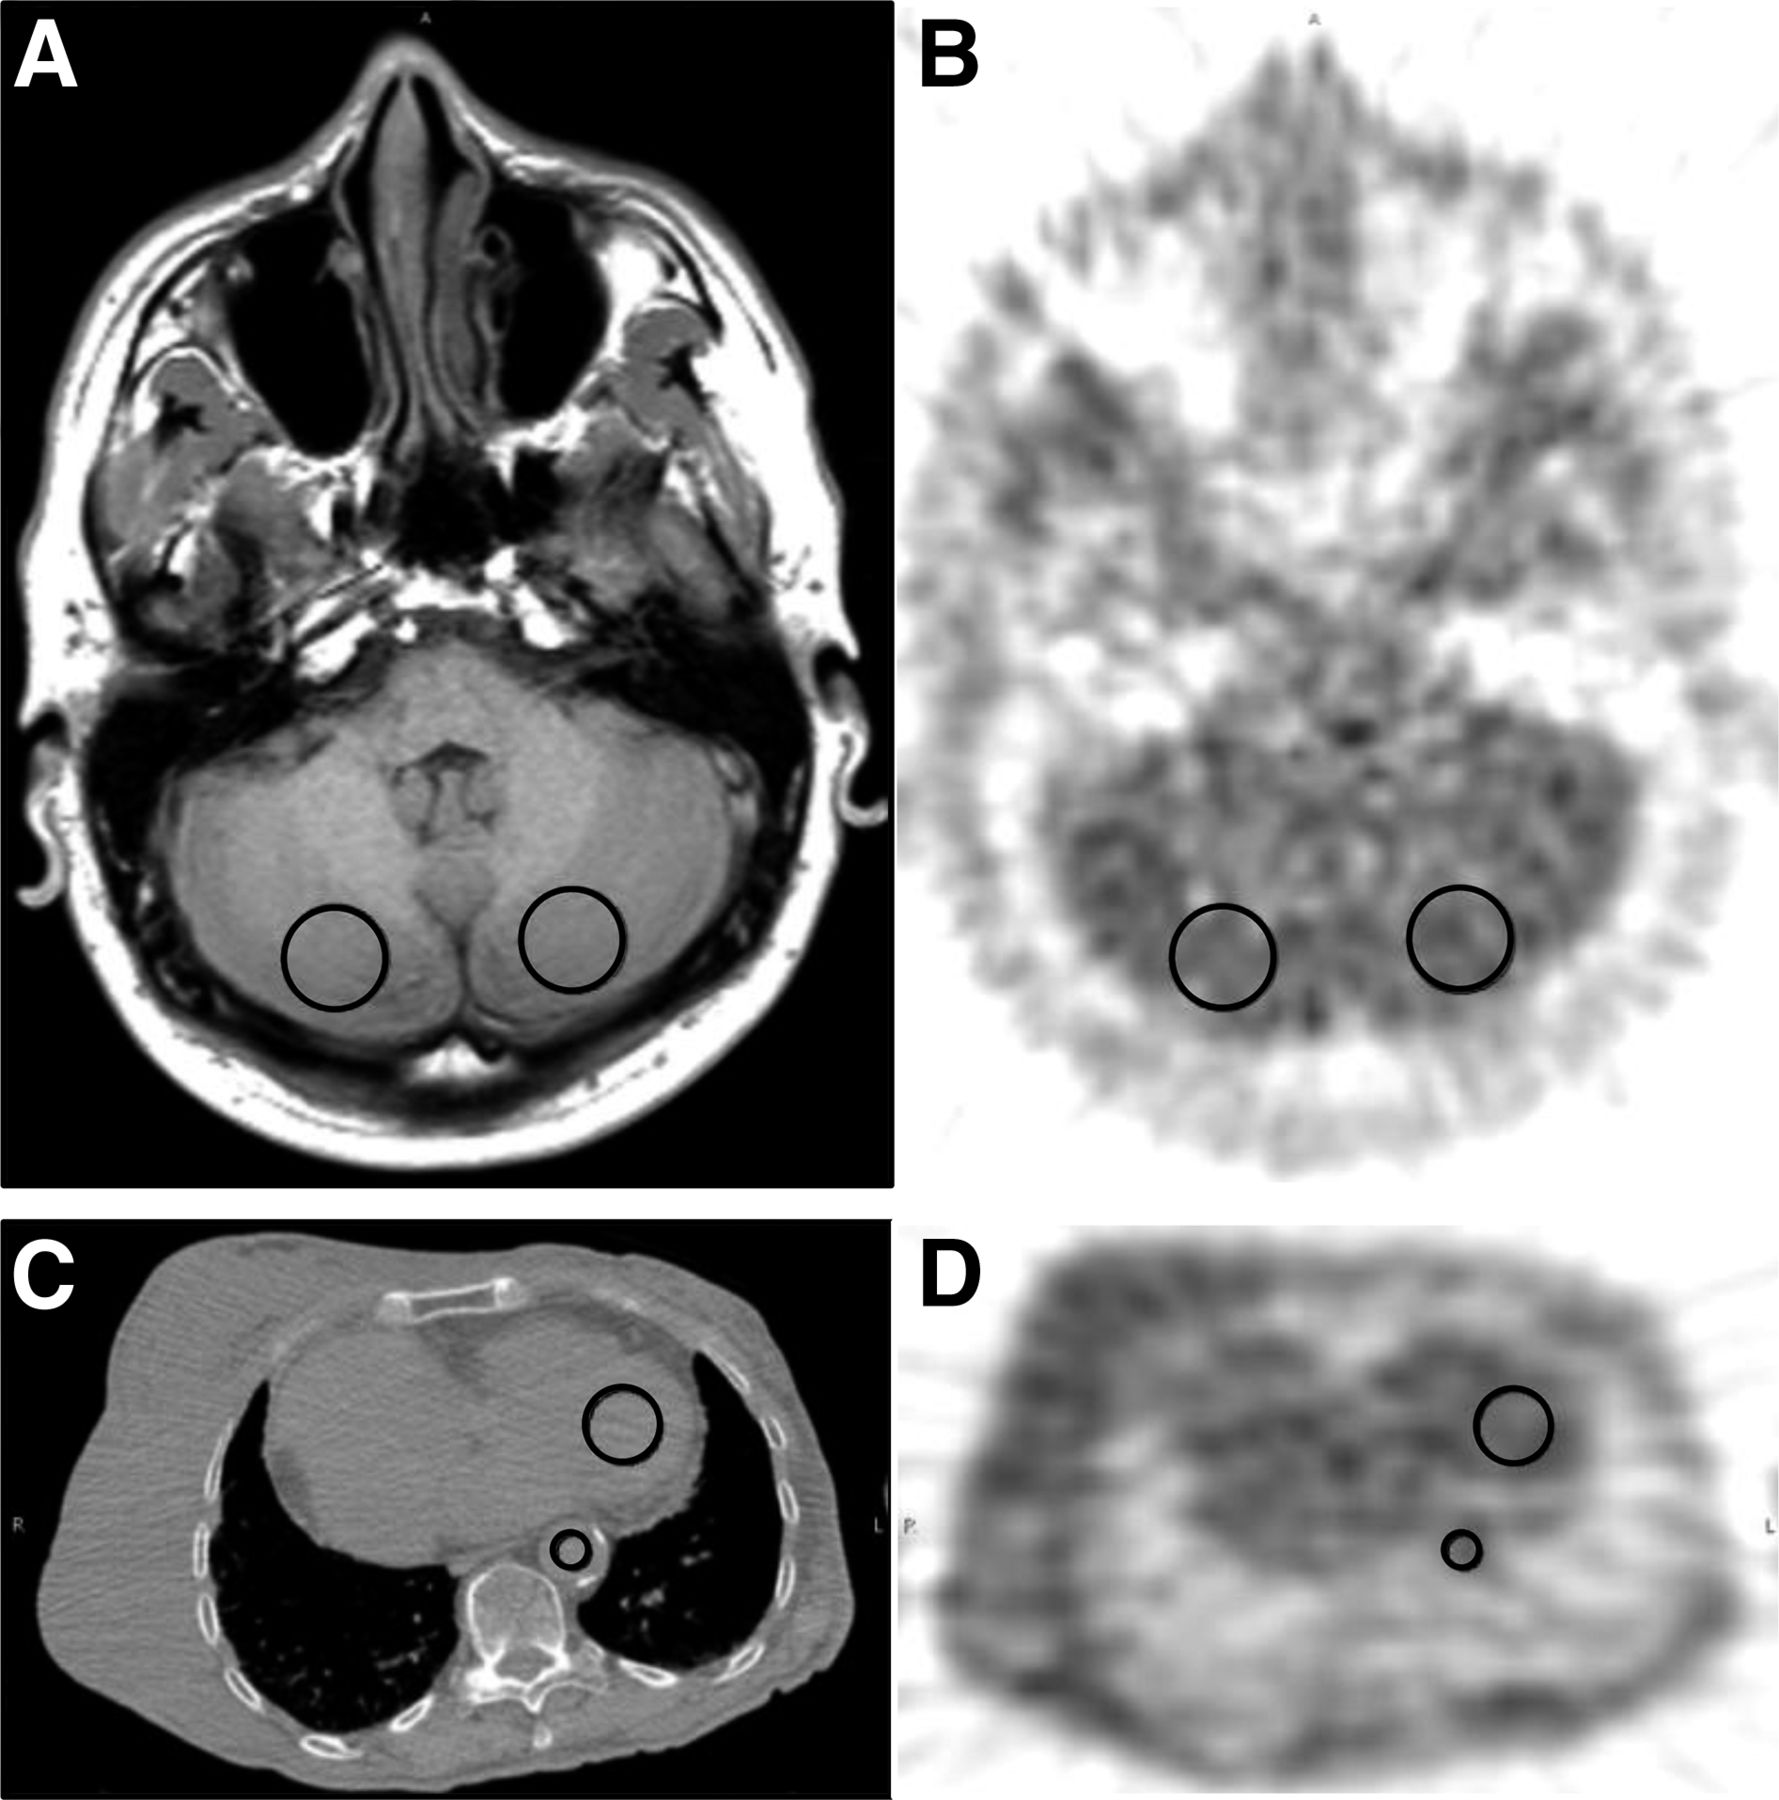
    Correlation of hypoxia parameters. (A) Regression plot of TBmax vs. ID TBmax for 269 surrogate blood regions shows strong relationship with small coefficient of variation (SEE/mean). (B) Bland–Altman plot shows clustering around mean with little bias. Plots of HV vs. ID HV values in C and D show similar profile.

  • FIGURE 4.
    • Download figure
    • Open in new tab
    • Download powerpoint
    FIGURE 4.

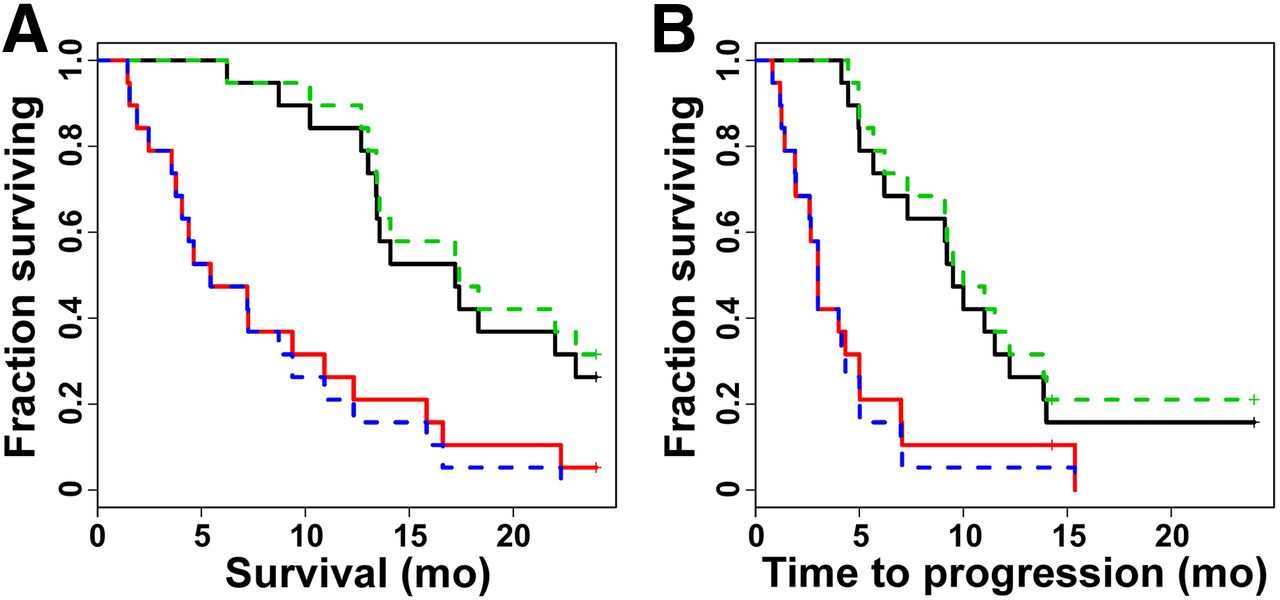
    Kaplan–Meier survival analysis. Hypoxia parameters were used to stratify 38 pretreatment glioma patients with respect to 2-y survival and TTP. Kaplan–Meier plots for TBmax demonstrated significantly shorter survival (A) and TTP (B) in high-risk patients (red line) whose tumors possessed TBmax ratios greater than median (TBmax > 1.83) relative to low-risk patients (black line). Using cerebellum as blood surrogate produced hypoxia parameter ID TBmax (dotted lines, median ID TBmax = 1.77) that had nearly predictive power nearly identical to TBmax. Kaplan–Meier plots and results for HV appear in supplemental materials.

Tables

  • Figures
  • Additional Files
    • View popup
    TABLE 1

    18F-FMISO Patient Region Summary

    ID blood regions
    Cancer typeCerebellumAortaHeart
    Brain93
    H&N7543
    Sarcoma22117
    Breast1515
    Lung108
    Lymphoma22
    Melanoma11
    Total regions1705346
    • Two hundred twenty-three studies on 187 patients were selected on the basis of presence of detectable surrogate normoxic tissue.

    • View popup
    TABLE 2

    Blood and Hypoxia Parameter Mean Values

    ParameterCerebellum (170*)Aorta (53*)Heart (46*)
    Blood†1.51 ± 0.221.46 ± 0.241.45 ± 0.25
    ID blood†1.50 ± 0.211.42 ± 0.231.45 ± 0.25
    TBmax1.77 ± 0.551.72 ± 0.681.74 ± 0.70
    ID TBmax1.77 ± 0.561.78 ± 0.721.77 ± 0.78
    HV (mL)20.6 ± 38.535.1 ± 57.034.5 ± 53.5
    ID HV (mL)20.9 ± 42.235.4 ± 56.035.7 ± 55.3
    • ↵* No. of regions analyzed for each blood surrogate.

    • ↵† Values for blood and ID blood are SUV.

    • Values presented are mean ± SD. Blood, TBmax, and HV values were derived from blood sampling. ID blood, ID TBmax, and ID HV were determined from blood reference tissue regions.

    • View popup
    TABLE 3

    Correlation of Blood to ID Blood Surrogates

    Blood surrogatenR2SlopeρSEE/mean
    Cerebellum1700.840.890.920.06
    Heart460.840.920.920.07
    Aorta530.830.870.910.07
    Overall2690.840.890.910.06
    • Correlation results of ID to sampled blood activity. Correlation parameters are R2 (coefficient of determination), slope from linear regression, Pearson ρ, and SEE/mean as a measure of coefficient of variation of regression.

    • View popup
    TABLE 4

    Results of Univariate Analysis for Predictors of Outcome in Pretreatment Glioma Patients (n = 38)

    SurvivalTTP
    PredictorHazardPHazardP
    Age1.730.0051.730.004
    Sex1.770.1441.800.131
    KPS*0.630.0190.670.028
    HV2.30<0.0012.07<0.001
    ID HV2.69<0.0012.45<0.001
    TBmax2.51<0.0012.34<0.001
    ID TBmax2.41<0.0012.31<0.001
    Resection†1.210.6041.160.664
    • ↵* Karnofsky performance score.

    • ↵† Resection is dichotomized as biopsy or other (gross/subtotal resection).

    • Univariate analysis of hypoxia and clinical variables shows the hazard ratio with P values associated with the outcome variables survival and TTP at 2 y.

    • View popup
    TABLE 5

    Results of Multivariate Cox Regression Analysis for Predictors of Outcome in Pretreatment Glioma Patients (n = 38)

    Survival (0.390)*TTP (0.466)
    PredictorHazardPHazardP
    Age1.260.4211.440.158
    Sex1.770.5251.430.440
    KPS†0.780.3240.880.554
    TBmax2.37<0.0012.31<0.001
    Resection‡0.760.5160.750.463
    Survival (0.394)TTP (0.485)
    PredictorHazardPHazardP
    Age1.220.4831.380.210
    Sex1.230.6761.310.559
    KPS0.750.2440.820.378
    ID TBmax2.30<0.0012.30<0.001
    Resection0.810.6160.770.519
    • ↵* The coefficient of determination (R2) is given for each table.

    • ↵† Karnofsky performance score.

    • ↵‡ Resection is dichotomized as biopsy or other (gross/subtotal resection).

    • Multivariate analysis shows that after adjusting for clinical variables using a multivariate Cox model, greater tumor TBmax was still associated with shorter survival and TTP. Multivariate results for HV and ID HV appear in supplemental materials.

Additional Files

  • Figures
  • Tables
  • Supplemental Data

    Files in this Data Supplement:

    • Supplemental Data
PreviousNext
Back to top

In this issue

Journal of Nuclear Medicine: 56 (8)
Journal of Nuclear Medicine
Vol. 56, Issue 8
August 1, 2015
  • Table of Contents
  • Table of Contents (PDF)
  • About the Cover
  • Index by author
Print
Download PDF
Article Alerts
Sign In to Email Alerts with your Email Address
Email Article

Thank you for your interest in spreading the word on Journal of Nuclear Medicine.

NOTE: We only request your email address so that the person you are recommending the page to knows that you wanted them to see it, and that it is not junk mail. We do not capture any email address.

Enter multiple addresses on separate lines or separate them with commas.
18F-Fluoromisonidazole Quantification of Hypoxia in Human Cancer Patients Using Image-Derived Blood Surrogate Tissue Reference Regions
(Your Name) has sent you a message from Journal of Nuclear Medicine
(Your Name) thought you would like to see the Journal of Nuclear Medicine web site.
Citation Tools
18F-Fluoromisonidazole Quantification of Hypoxia in Human Cancer Patients Using Image-Derived Blood Surrogate Tissue Reference Regions
Mark Muzi, Lanell M. Peterson, Janet N. O’Sullivan, James R. Fink, Joseph G. Rajendran, Lena J. McLaughlin, John P. Muzi, David A. Mankoff, Kenneth A. Krohn
Journal of Nuclear Medicine Aug 2015, 56 (8) 1223-1228; DOI: 10.2967/jnumed.115.158717

Citation Manager Formats

  • BibTeX
  • Bookends
  • EasyBib
  • EndNote (tagged)
  • EndNote 8 (xml)
  • Medlars
  • Mendeley
  • Papers
  • RefWorks Tagged
  • Ref Manager
  • RIS
  • Zotero
Share
18F-Fluoromisonidazole Quantification of Hypoxia in Human Cancer Patients Using Image-Derived Blood Surrogate Tissue Reference Regions
Mark Muzi, Lanell M. Peterson, Janet N. O’Sullivan, James R. Fink, Joseph G. Rajendran, Lena J. McLaughlin, John P. Muzi, David A. Mankoff, Kenneth A. Krohn
Journal of Nuclear Medicine Aug 2015, 56 (8) 1223-1228; DOI: 10.2967/jnumed.115.158717
Twitter logo Facebook logo LinkedIn logo Mendeley logo
  • Tweet Widget
  • Facebook Like
  • Google Plus One
Bookmark this article

Jump to section

  • Article
    • Abstract
    • MATERIALS AND METHODS
    • RESULTS
    • DISCUSSION
    • CONCLUSION
    • DISCLOSURE
    • Acknowledgments
    • Footnotes
    • REFERENCES
  • Figures & Data
  • Supplemental
  • Info & Metrics
  • PDF

Related Articles

  • This Month in JNM
  • PubMed
  • Google Scholar

Cited By...

  • ACRIN 6684: Assessment of Tumor Hypoxia in Newly Diagnosed Glioblastoma Using 18F-FMISO PET and MRI
  • Noninvasive PET Imaging and Tracking of Engineered Human Muscle Precursor Cells for Skeletal Muscle Tissue Engineering
  • Imaging Hypoxia with 18F-Fluoromisonidazole: Challenges in Moving to a More Complicated Analysis
  • Google Scholar

More in this TOC Section

  • Cardiac Presynaptic Sympathetic Nervous Function Evaluated by Cardiac PET in Patients with Chronotropic Incompetence Without Heart Failure
  • Validation and Evaluation of a Vendor-Provided Head Motion Correction Algorithm on the uMI Panorama PET/CT System
  • Prognostic Role of 68Ga-PSMA11 PET–Based Response in Patients with Prostate Cancer Undergoing Taxane-Based Chemotherapy
Show more Clinical Investigations

Similar Articles

Keywords

  • hypoxia
  • PET
  • 18F-FMISO
  • quantitation
SNMMI

© 2025 SNMMI

Powered by HighWire