


Article Figures & Data
Figures
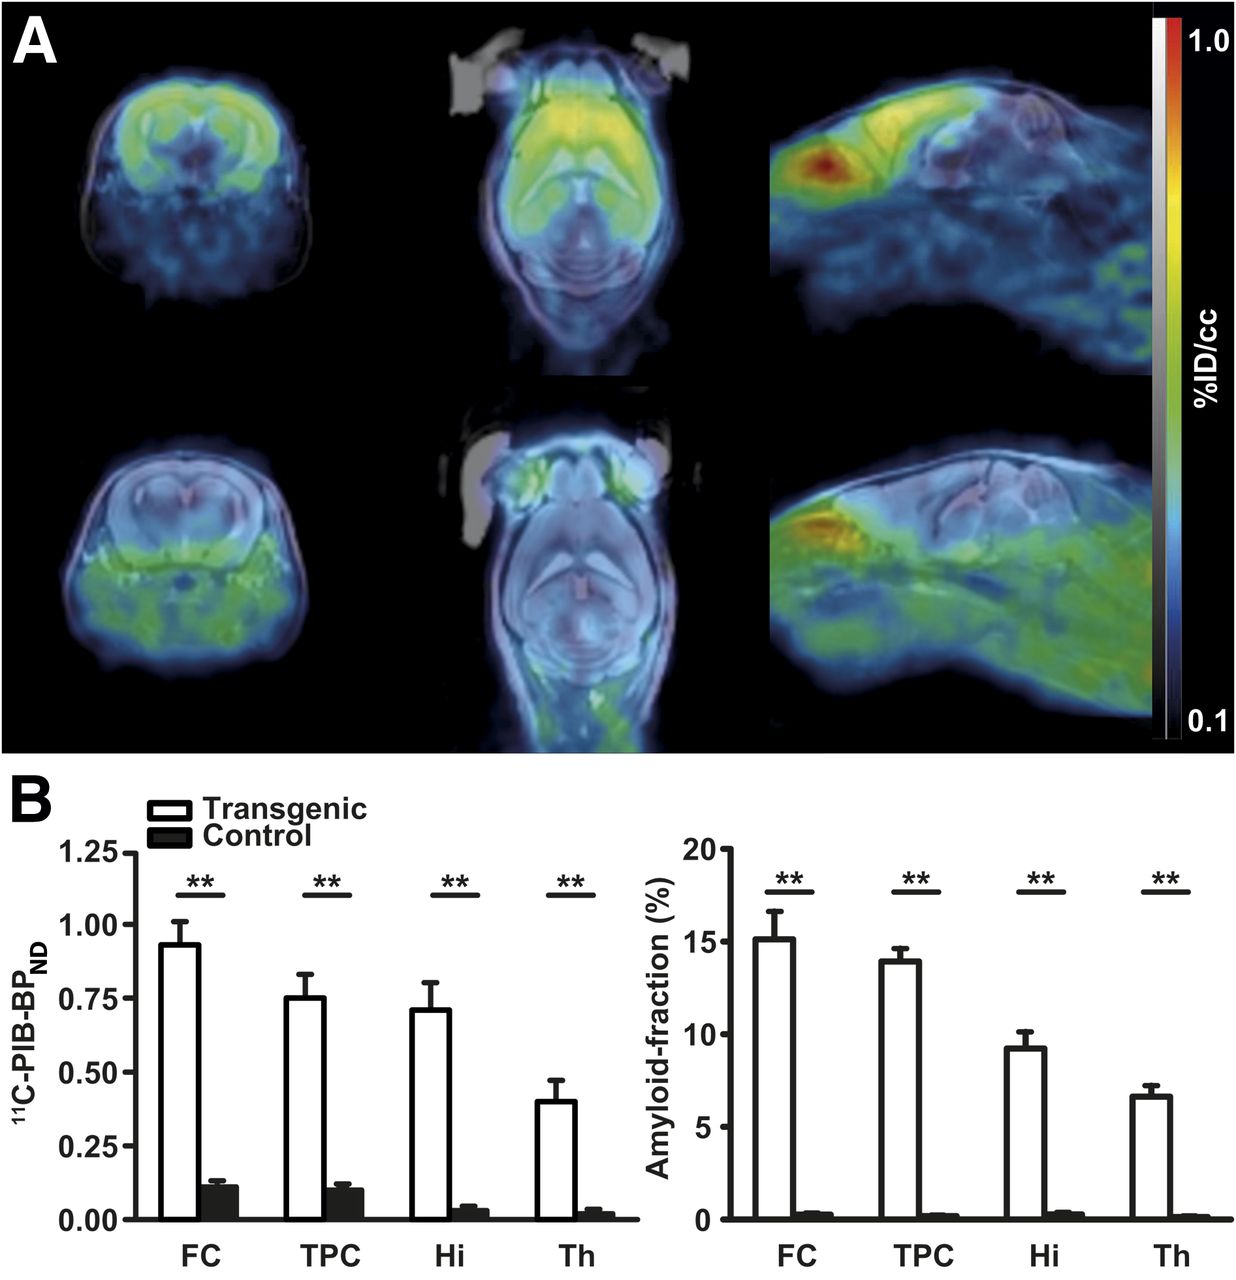
- FIGURE 1.
Quantification of amyloid burden with 11C-PIB PET and amyloid histology. (A) Transversal, horizontal, and sagittal views of fused 11C-PIB PET/tse3DT2 MR imaging at 7 T of 30-mo-old transgenic APP23 mouse (upper panel) and of age-matched control mouse (lower panel). Note specific 11C-PIB binding in amyloid-affected brain regions of transgenic animal (frontal cortex, hippocampus, temporoparietal cortex, thalamus) in contrast to cerebellum, which is amyloid-unaffected. (B) Quantification of 11C-PIB BPND in transgenic and control mice reveals significantly higher binding in transgenic mice (n = 5) and matches amyloid load assessed by amyloid histology (n = 5). **P < 0.01. FC = frontal cortex; TPC = temporoparietal cortex; Hi = hippocampus ; Th = thalamus.
- FIGURE 2.
Correlation of 11C-PIB PET and T2*-weighted microscopic MR imaging at 16.4 T. (A–C) Example of tse3DT2 MR imaging at 7 T (A), corresponding dedicated 11C-PIB PET and MR imaging overlay (B), and respective postmortem T2*-weighted imaging (C) at 16.4 T of same 30-mo-old transgenic APP23 mouse as shown in Figure 1. (D) 11C-PIB BPND and microscopic MR imaging amyloid fractions calculated from T2*-weighted imaging at 16.4 T were correlated linearly (R2 = 0.98, Pearson correlation coefficient; P = 0.99; data are shown for animal presented in A–C and refer to 11C-PIB BPND ± SE of Logan fitting routine and percentage of T2*-weighted amyloid-positive fraction of thalamus, hippocampus, temporoparietal cortex, and frontal cortex). Highres-3DT2*= T2*-weighted.
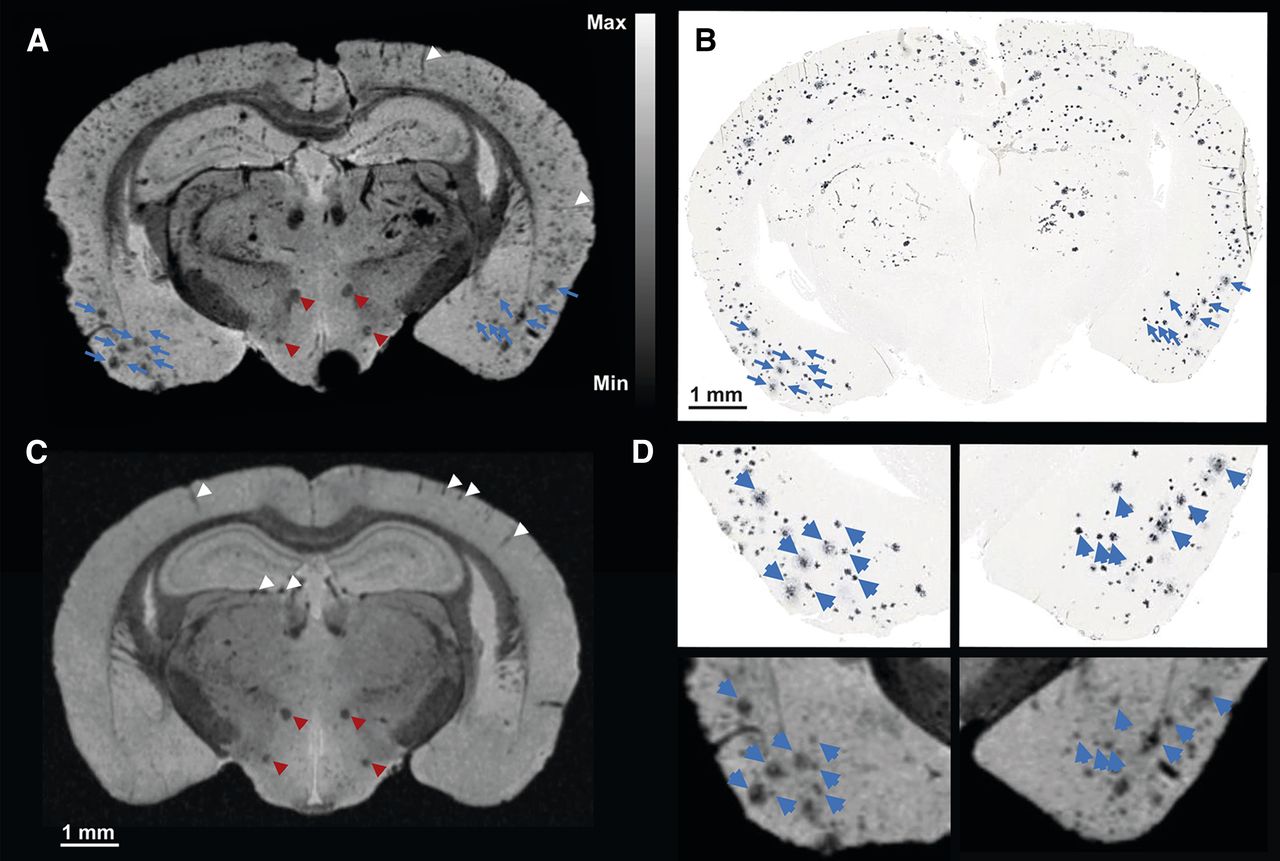
- FIGURE 3.
Correlation of T2*-weighted microscopic MR imaging at 16.4 T and amyloid histology. T2*-weighted image (A) at 16.4 T of 30-mo-old transgenic APP23 mouse and corresponding amyloid histology (B), with matching amyloid plaques are indicated by blue arrowheads. (C) T2*-weighted image at 16.4 T of littermate control APP23 mouse. Only rare hypointensities are present in temporoparietal cortex corresponding to blood vessels parallel to imaging plane or in hippocampus orthogonal to imaging plane (indicated by white arrowheads). Mammillothalamic tract and perifornical nucleus are indicated by red arrowheads. (D) Higher magnification of A and B allows identification of substructures within single amyloid plaques that are related to density of amyloid deposition (blue arrowheads).
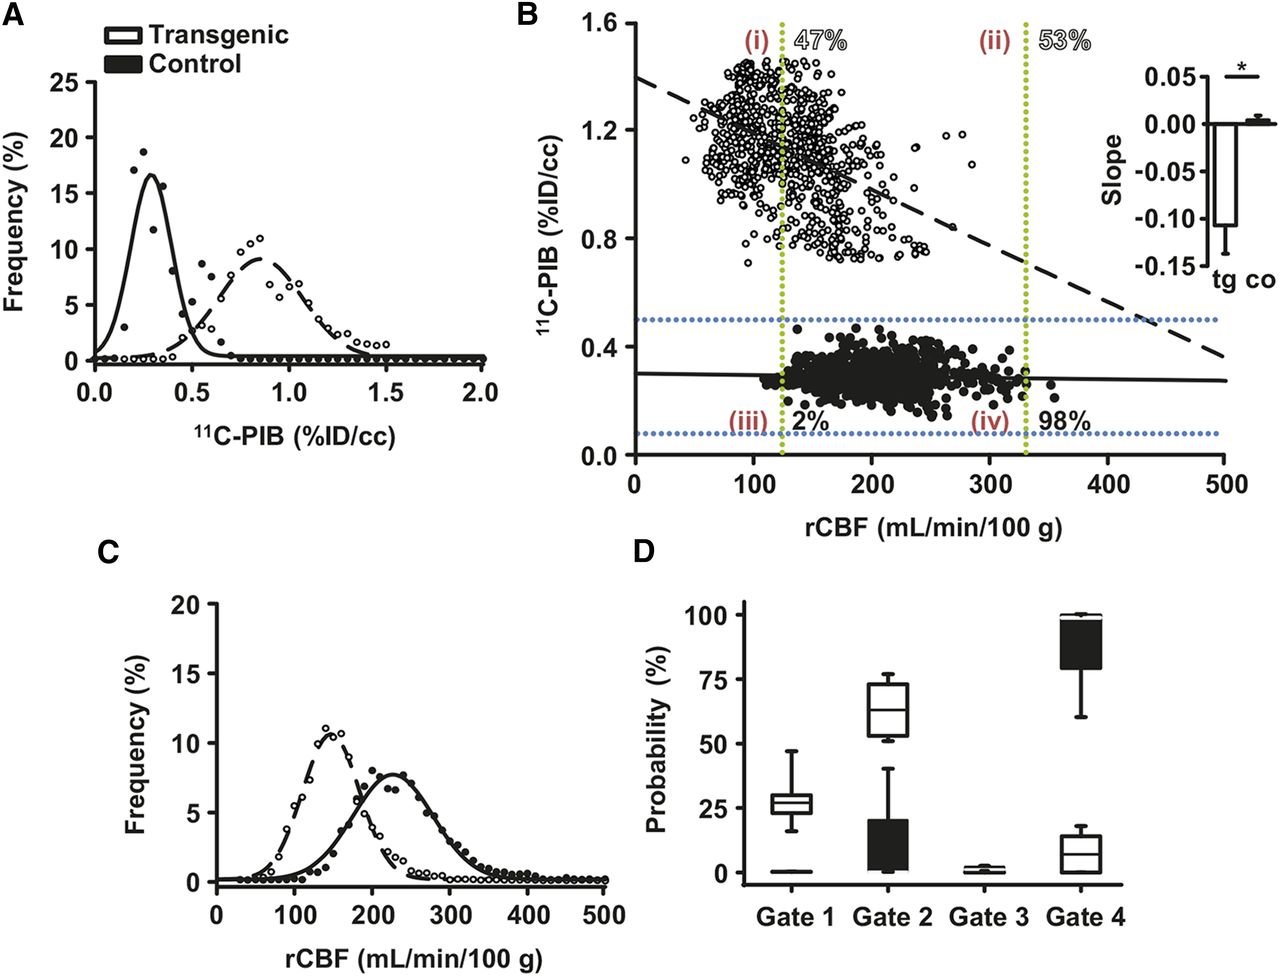
- FIGURE 4.
Voxel-based correlation of 11C-PIB PET and ASL MR imaging at 7 T. (A and C) Frequency distribution and gaussian fits of 11C-PIB (A) and of rCBF values (C). (B) Example of 2-dimensional voxelwise correlation of 30-mo-old transgenic and littermate control APP23 mouse. Mean ± 2 SD thresholds calculated from A and C are indicated by dashed lines (blue: 11C-PIB thresholds; green: ASL thresholds). This allows assignment of 2-dimensional voxelwise datasets to 4 described gates (indicated by red numbers), gate assignments as percentage for both animals are shown in open numbers (transgenic) and solid numbers (control). (Inset: linear fits to voxelwise correlation plots revealed inverse correlation of 11C-PIB and rCBF in transgenic APP23 mice; littermate controls displayed no such correlation (n = 5, P < 0.05)). (D) Two-dimensional voxel-value probability distribution of all transgenic and control APP23 mice (shown is voxel distribution in 4 gates as percentage).


Additional Files
Supplemental Data
Files in this Data Supplement:


