


Abstract
The Clinical Trials Network (CTN) of the Society of Nuclear Medicine and Molecular Imaging (SNMMI) operates a PET/CT phantom imaging program using the CTN’s oncology clinical simulator phantom, designed to validate scanners at sites that wish to participate in oncology clinical trials. Since its inception in 2008, the CTN has collected 406 well-characterized phantom datasets from 237 scanners at 170 imaging sites covering the spectrum of commercially available PET/CT systems. The combined and collated phantom data describe a global profile of quantitative performance and variability of PET/CT data used in both clinical practice and clinical trials. Methods: Individual sites filled and imaged the CTN oncology PET phantom according to detailed instructions. Standard clinical reconstructions were requested and submitted. The phantom itself contains uniform regions suitable for scanner calibration assessment, lung fields, and 6 hot spheric lesions with diameters ranging from 7 to 20 mm at a 4:1 contrast ratio with primary background. The CTN Phantom Imaging Core evaluated the quality of the phantom fill and imaging and measured background standardized uptake values to assess scanner calibration and maximum standardized uptake values of all 6 lesions to review quantitative performance. Scanner make-and-model–specific measurements were pooled and then subdivided by reconstruction to create scanner-specific quantitative profiles. Results: Different makes and models of scanners predictably demonstrated different quantitative performance profiles including, in some cases, small calibration bias. Differences in site-specific reconstruction parameters increased the quantitative variability among similar scanners, with postreconstruction smoothing filters being the most influential parameter. Quantitative assessment of this intrascanner variability over this large collection of phantom data gives, for the first time, estimates of reconstruction variance introduced into trials from allowing trial sites to use their preferred reconstruction methodologies. Predictably, time-of-flight–enabled scanners exhibited less size-based partial-volume bias than non–time-of-flight scanners. Conclusion: The CTN scanner validation experience over the past 5 y has generated a rich, well-curated phantom dataset from which PET/CT make-and-model and reconstruction-dependent quantitative behaviors were characterized for the purposes of understanding and estimating scanner-based variances in clinical trials. These results should make it possible to identify and recommend make-and-model–specific reconstruction strategies to minimize measurement variability in cancer clinical trials.
Multicenter oncology clinical trials are increasingly using PET/CT imaging as primary and secondary endpoints to define success or failure of treatment regimens, with considerable effort expended in understanding reproducibility and variability (1–11). PET, as an inherently quantitative imaging technique, is arguably the most powerful imaging modality available to researchers to assess response to therapy in the multicenter clinical trial setting. However, the accurate and reproducible quantitation methodology necessary to successfully complete a trial involving quantitative PET imaging has been complicated by vendors of commercial PET/CT scanner systems that understandably strive to generate higher quality diagnostic images to achieve market differentiation. Although these efforts advance the field, they also paradoxically add variability to multicenter trials that include PET/CT equipment whose inherent hardware and software technologies can differ by more than a decade. The introduction of time-of-flight (TOF)–capable scanners and reconstruction advancements including iterative approaches that account for the position-sensitive point-response function have further increased both quantitative and qualitative differences between older- and newer-generation scanners. The divergent image quality and varying quantitation make comparison of quantitative data associated with different makes and models of scanners of different vintages problematic within the context of multicenter clinical trials seeking to use metrics such as standardized uptake values (SUVs) and total lesion glycolysis (1,12).
Several professional societies have initiated programs and are devising and promoting standardization practices designed to reduce variability within the context of image quantitation in clinical trials. Organizations such as the American College of Radiology Imaging Network (ACRIN), The Radiologic Society of North America’s Quantitative Imaging Biomarker Alliance, the American Association of Physicists in Medicine, the European Association of Nuclear Medicine’s Research 4 Life, and the Society of Nuclear Medicine and Molecular Imaging (SNMMI), both alone and together, have made significant strides in this area. Several of these organizations administer PET/CT phantom imaging programs to aid in the standardization of quantitation in clinical trials and clinical practice (13–16). These programs are separate and distinct from clinical accreditations such as those administered by the American College of Radiology and the Intersocietal Accreditation Commission as well as the Joint Commission.
In September 2008, the Clinical Trials Network (CTN) was created by SNMMI. The mission of the CTN is to advance the use of molecular imaging radiopharmaceuticals in clinical trials through standardization of chemistry and imaging methodology. This includes using imaging radiopharmaceuticals during the course of drug development and bringing new radiopharmaceuticals to regulatory approval. The CTN operates a phantom-based validation program for PET/CT scanners that uses a unique anthropomorphic chest phantom specifically for validating the quantitative performance of PET/CT scanners for use in oncology clinical trials.
From its inception through January 2014, the CTN has gathered and analyzed more than 400 phantom datasets collected from 237 unique PET/CT scanners acquired from a diverse group of 170 international imaging centers. These centers run the gamut from community-based imaging centers to academic sites. Virtually all makes and models of scanners from the last decade are represented in the datasets. Specifically excluded from the oncology phantom data are those collected from mobile PET/CT systems and PET-only systems. The image data from scanners that passed the validation criteria in these phantom studies form the basis of the analysis presented here.
The study includes PET/CT scanners with technology advancements spanning more than a decade. Reconstruction methods have also evolved substantially during this period. GE Healthcare and Siemens PET/CT systems have historically used similar iterative reconstructions, giving users a broad level of flexibility in determining their own level of convergence by specifying their preferred number of updates (iterations and subsets) and also allowing the ability to apply postreconstruction gaussian smoothing filters of user-defined width. Reconstructions with Philips scanners, although also iterative, allow the user less latitude in reconstruction and do not provide the ability to filter the images after reconstruction.
The overall goal of this analysis was to assess quantitative variability of PET data in the context of single-site and multicenter clinical trials that is introduced specifically by variability in scanner calibration and quantitative maximum SUV (SUVmax) measurement of spheric tumorlike lesions in the CTN oncology phantom. By better understanding the magnitude and sources of these variances, the field should be able to devise strategies to predictably enhance the quality of quantitative PET imaging data for clinical trials.
MATERIALS AND METHODS
Phantom Imaging and Data Collection
The CTN oncology clinical simulator phantom is an anthropomorphic chest phantom with lung fields and 6 spheric objects with inner diameters ranging from 7 to 20 mm reproducibly secured at specific locations within the phantom (Fig. 1) (16,17). The 6 spheres are serially connected via narrow-bore tubing allowing a single syringe to fill all 6 spheres. The phantom has a single 7-mm-diameter sphere located in the mediastinum, two 10-mm spheres placed in the lung fields, a 10-mm sphere in an area corresponding to an axillary lymph node, a single 15-mm-diameter sphere in the left shoulder, and a single 20-mm-diameter sphere in the right lung field. The nominal concentration of the spheres and background at phantom imaging times are 24.0 and 6.0 kBq/mL, respectively, resulting in a 4:1 lesion–to–background concentration ratio with scanning commencing precisely 60 min after assay of the fill syringes. These concentrations were designed to simulate clinically relevant concentrations and contrasts found in 18F-FDG PET oncology imaging. Phantom imaging was performed for 4 min per bed position for 3-dimensional imaging and 6 min per bed position for 2-dimensional imaging. The sites were instructed to use their standard low-dose attenuation-correction CT protocol and to reconstruct the images using their standard clinical reconstruction parameter set. However, the sites were also instructed not to implement point-response-function–assisted reconstructions because of variability of reconstructed quantitation using these techniques at this time. A predetermined patient weight (63 kg) and injected dose (555 MBq) were designed to produce a background SUV of 1.00 if the prescribed fill instructions were followed.
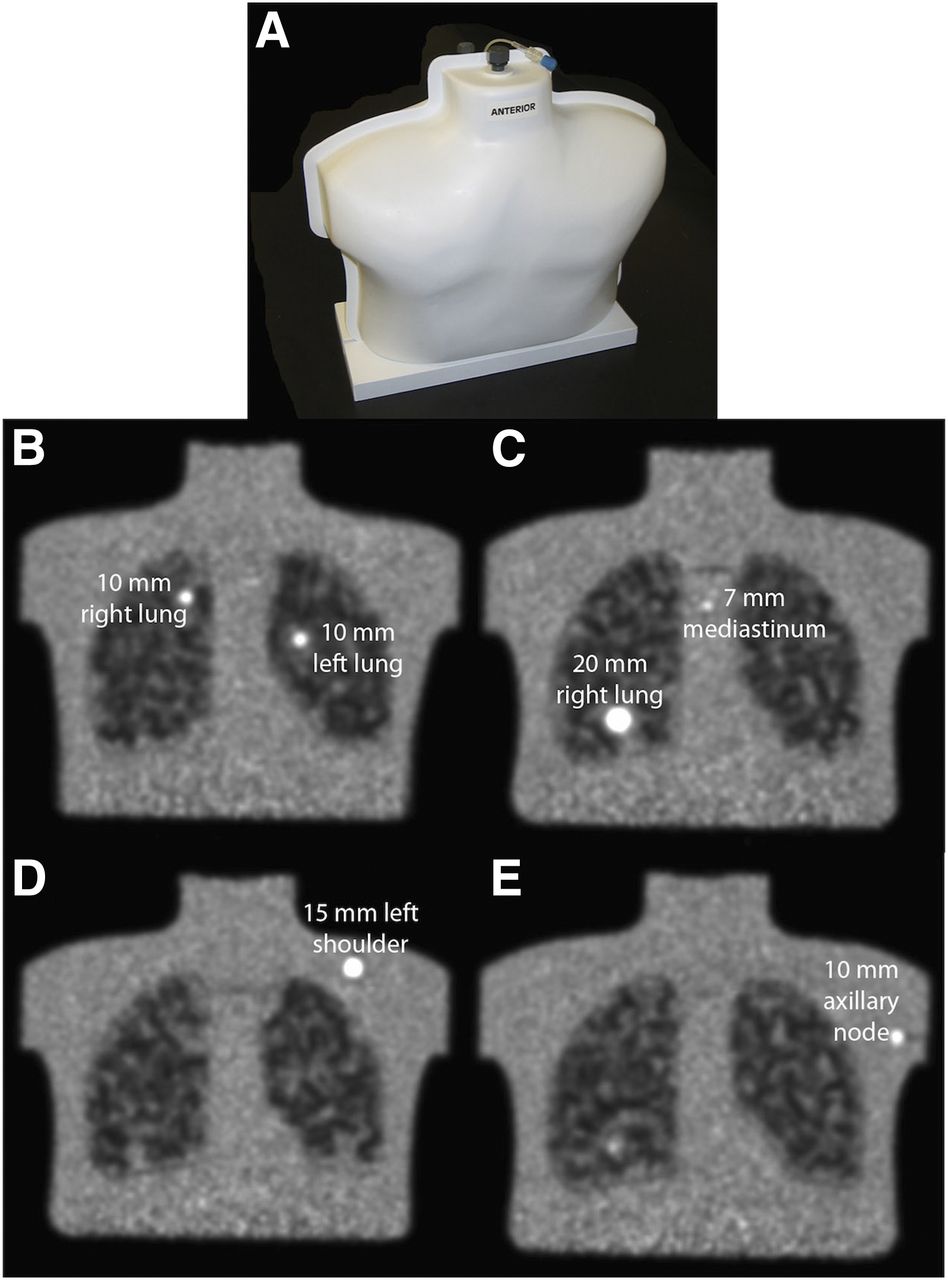
Representative phantom images from later-model TOF-enabled PET/CT scanner capable of visualizing all 6 spheres. (A) CTN oncology phantom. (B) Coronal slice visualizing both left and right 10-mm lung lesions. (C) Coronal slice visualizing 7-mm mediastinal lesion and 20-mm right lung sphere. (D) Coronal slice visualizing 15-mm sphere in left shoulder. (E) Coronal slice visualizing 10-mm axillary lymph node.
For validation purposes, each site submitted the attenuation-corrected PET scans, non–attenuation-corrected PET scans, and CT scans used for attenuation correction to the CTN Phantom Imaging Core. The phantom-fill data (activities and times), as well as PET and CT acquisition and reconstruction parameters and general information regarding the scanner, were submitted on paper.
The Scanner Validation Core Lab performed a series of quality control steps before final quantitative analysis using Siemens syngo.via (va20), Siemens Inveon Research Workstation (IRW; version 4.2), and OsiriX (Pixmeo SARL; version 5.9). The PET/CT datasets were overlaid using the above software to assess the accuracy of the PET/CT registration for the scanner by comparing the 3-dimensional position of each of the 6 spheres on the CT scan with their location on the PET scan. Misregistrations on the order of 3 mm in any dimension were visually detectable. The CT scan was carefully checked for the existence of air bubbles in the spheric lesions, because this will cause anomalously low SUV readings. An incomplete fill resulted in a request for the site to refill and rescan the phantom.
The sites were also asked to make both an SUVmax measurement of all identified lesions and a background measurement in the right shoulder region for assessment of scanner calibration accuracy. The CTN Scanner Validation Core Lab subsequently made its own measurements of the SUVmax for the spheric lesions and mean SUV (SUVmean) for the background. The Core Lab measurements are those reported in this article.
The acceptance criterion for the SUVmean of the background region was set at 1.0 ± 0.1. This criterion ±10% permissible variability is consistent with criteria of most other organizations that are currently addressing limits for acceptable quantitative PET scanner calibration performance for clinical trials (2,13–15,18). Because spheres of different sizes are placed within the phantom in different background settings, and scanner-specific performance in this complex environment was originally unknown, rigid sphere-specific acceptance criteria for SUVmax for the various sphere sizes are currently not strictly set. The current work presented here will act as the basis for these acceptance criteria moving forward.
Phantom Analysis Approach
For the purposes of analysis and data reduction, scanner models from a particular vendor whose PET imaging properties were generally equivalent were bundled together. Fourteen distinct scanner groups were ultimately identified and are listed in Table 1. The proportion of GE Healthcare, Siemens, and Philips scanners in this sample make up approximately 56%, 34%, and 10% of the scanners, respectively.
Categorization of Scanners into Groups of Like Quantitative Performance
For this analysis, the phantom data collected were analyzed in 2 general areas: overall scanner calibration and scanner- and reconstruction-specific lesion quantitation.
The analysis of the reconstruction parameter sets (iterations, subsets, gaussian filter width) of the more than 240 PET/CT scanners revealed more than 100 different reconstruction parameter sets being used from the imaging sites in the database, demonstrating a substantial lack of standardization. Supplemental Table 1 (supplemental materials are available at http://jnm.snmjournals.org) details the reconstruction parameter sets and the frequency distribution per scanner. The database and data collection were not initially configured to collect Philips-specific parameters and are therefore not reported in the supplemental table.
Scanner Validation Core Lab analysis was performed using Siemens syngo.via workstations, Siemens IRW, and OsiriX. All workstations were verified to generate the same SUVmax generally to within 2% of one another; however, not all workstations were capable of generating SUV measurements from all scanner system image sets. OsiriX proved most universally capable of quantitation of concentration and SUVs and was used in those cases in which the other workstations failed to generate quantitative information.
Scanner Calibration Analysis
For scanner calibration assessment, an approximately 30-mm-diameter spheric volume of interest (VOI) was created in the right shoulder, which was a uniform region devoid of complicating structures and concentrations. The region was placed far from the edges of the phantom to avoid partial-volume effects. The mean and SD of the VOI were recorded. The calibration data from similar models as described in Table 1 were pooled to assess scanner model–specific trends. Two-sided t test analysis was performed to determine whether the individual scanner-specific background distributions were statistically significantly different from the parent background distribution of all scanners combined. An additional spheric VOI was placed in the uniform region located caudally in the phantom in the area near where the myocardium would be anatomically located (the myocardial background region). The difference between the right shoulder background SUVmean and the background myocardial SUVmean was calculated for all scanner studies. Results were compiled for each make and model of scanner to determine whether scanner-specific quantitative anatomic biases exist.
Reconstruction-Specific Quantitation
For the scanner- and reconstruction-specific lesion quantitation analysis, spheric VOIs with diameters at least 2 times the diameter of the actual spheres were drawn over all 6 spheric objects. CT information was used when the precise location of the lesion was not apparent on the PET scan. SUVmax measurements were made for each of the lesions. Both the imaging site and the Scanner Validation Core Lab made this measurement. The Core measurements are those presented. For the purposes of this analysis, only the SUVmax measurements from the 5 spheres 10 mm and larger are reported. They were first combined by scanner model and then subsequently subcategorized by reconstruction. Measurements of the 7-mm sphere were specifically excluded from this analysis because so few scanners were able to detect it. Subcategorization was performed by the width of the gaussian reconstruction filter used, because this was determined to have the most significant quantitative impact. To achieve meaningful statistical numbers of phantom scans, gaussian filter width ranges were typically used, rather than a specific filter width. Because Philips scanner reconstructions do not provide the ability to choose a postreconstruction filter, Philips phantom data were analyzed per scanner but not subsequently subcategorized.
RESULTS
Scanner Calibration
The assessment of accuracy of scanner calibration was performed on all submitted phantom studies by creating a spheric VOI in the uniform region of the left shoulder as described above. The SUVmean was calculated for each attenuation-corrected phantom study, and the results were tabulated into frequency histograms for all 14 scanner models. Representative SUVmean histogram distributions for background measurements (nominally = 1.00) for 2 PET/CT scanner models are presented in Figures 2A and 2B. The mean and SD calculated for each of the 14 scanner models are shown in Figure 2C.
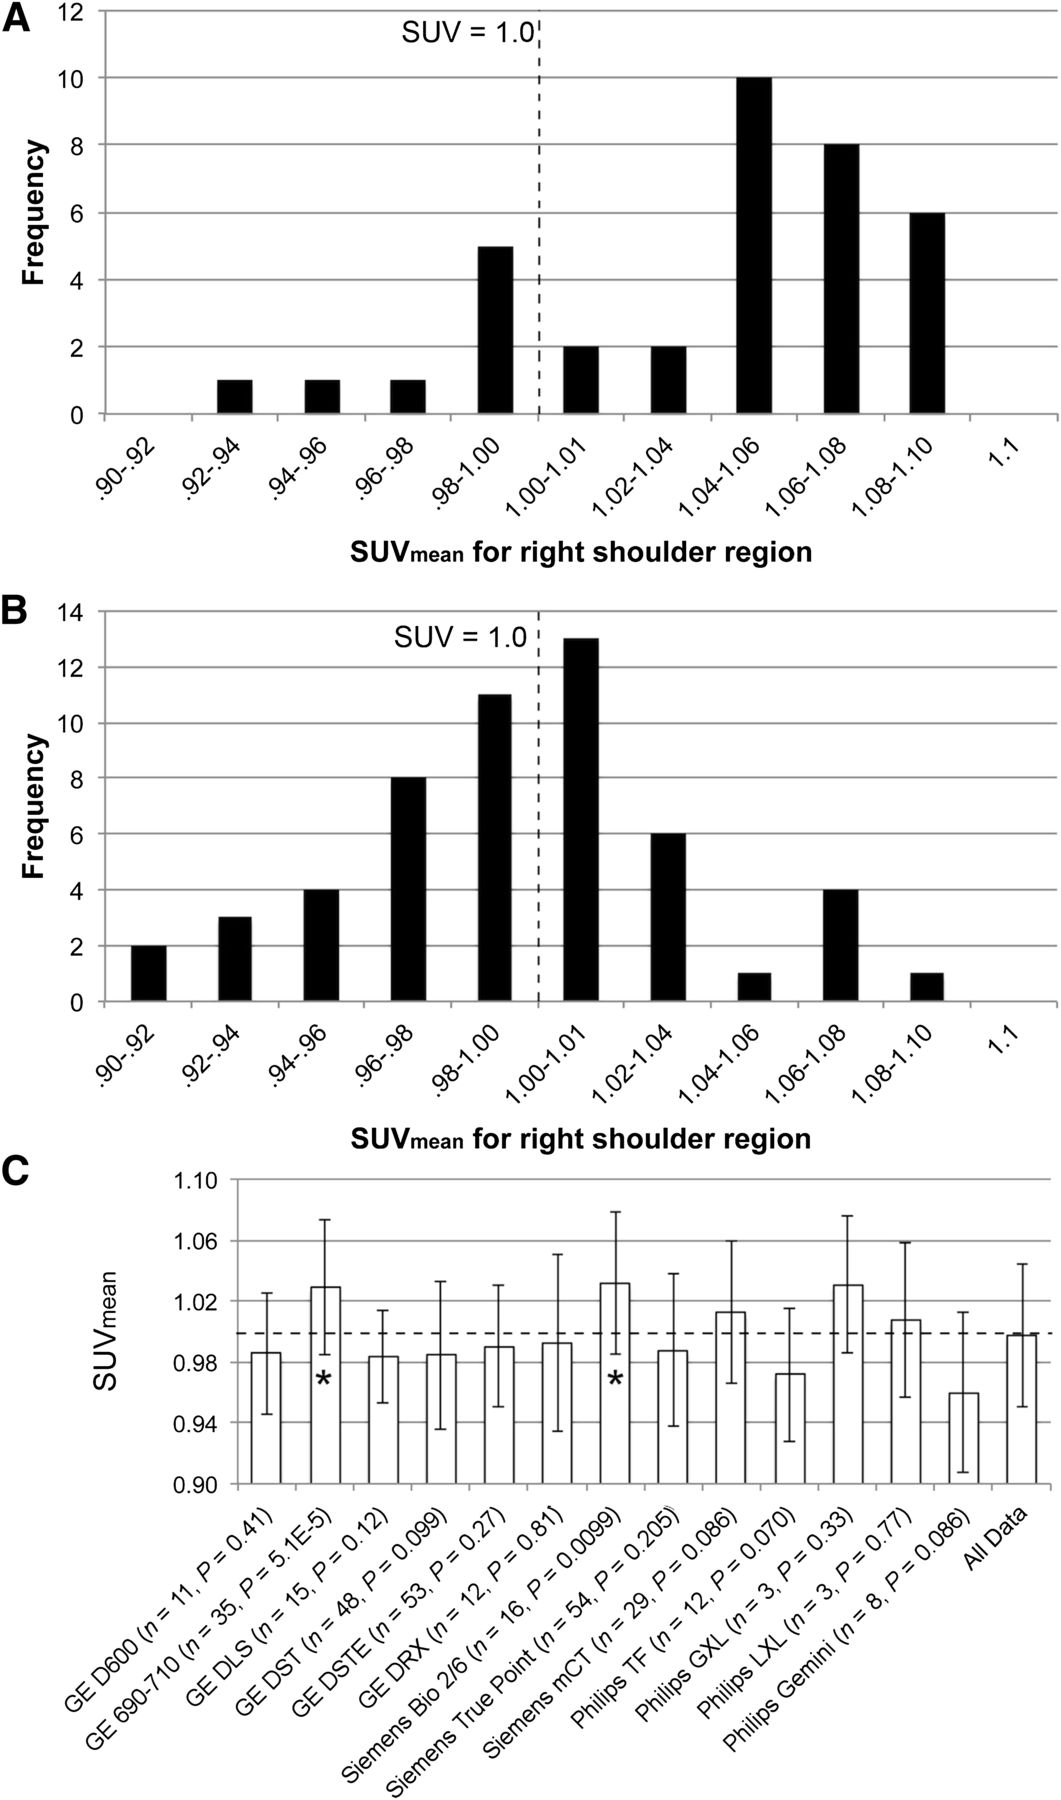
Representative background SUVmean measurements in right shoulder region. (A) Asymmetrically distributed histogram distribution of background measurements for GE 690–710 PET/CT scanner models. (B) Generally symmetric histogram distribution for the GE Discovery STE PET/CT scanner platform centered on SUV of 1.0. (C) Mean of all background SUVmean compiled for each scanner make and model. * = GE 690–710 models and Siemens Biograph 2–6 both had means statistically significantly higher than 1.0.
All pooled model-specific mean background values (Fig. 2C) are within ±4% of the actual concentration. However, the Discovery 690–710 scanners (GE Healthcare) and the Biograph 2–6 scanners (Siemens) both demonstrated a statistically significant positive bias when compared with the parent background SUV distribution. Four other scanner models (annotated in Fig. 2C) had P values between 0.05 and 0.1, suggesting the possibility of slight bias.
Scanner-specific differences between shoulder background SUVmean and the background myocardial SUVmean are listed in Tables 2 and 3. In nearly half of the 14 scanner models investigated, there was a clear reconstruction-driven bias between the measurements in the shoulder region and the myocardial region. Investigating the GE Healthcare line of PET/CT scanners gives insight into these phenomena. In 10 of 11 phantom scans with the 600 PET/CT scanner (GE Healthcare), the myocardial background region concentration measurement was greater than that in the shoulder region. However, with the 690–710 scanners (GE Healthcare), the opposite was found, with 31 of 33 scans having the shoulder region greater than the myocardial region. GE Healthcare’s older models (the ST and STE) demonstrated no such bias.
Differences in Background SUVmean Measurements for Uniform Areas in Phantom for GE Healthcare Scanners
Differences in Background SUVmean Measurements for Uniform Areas in Phantom for Siemens and Philips Scanners
Lesion Quantitation
Although updates (defined as iterations × subsets) affect quantitation, categorizing individual scanner data by the postreconstruction gaussian filter width demonstrated the most significant and systematic quantitative impact and is the basis of the data and analysis presented. The reconstructions for each of the PET/CT scanner models (Table 1) were sorted and pooled by gaussian filter width. The complete set of data for the 14 scanner models is presented in Table 4. Representative results of the SUVmax for each of the 5 spheres 10 mm and larger for the Discovery STE and Discovery 690–710 (GE Healthcare), Biograph TruePoint (Siemens), and TF (Philips) are graphically presented in Figure 3. All results for individual scanner models are presented in histogram plots in Supplemental Figures 1–3. In each of these histogram plots, the leftmost bar is the mean SUVmax for that sphere for the entire 406 phantom datasets. Subsequent bars represent mean SUVmax for increasing gaussian filter width ranges used in reconstructions for that model scanner. Three filter bin widths were typically selected for each of the scanner models primarily to balance, to the extent possible, the number of phantom scans in each bin. However, balanced distribution was often not possible. Philips, as previously mentioned, does not allow the user the capability to filter the image after reconstruction. Given the limited number of scanners per model in our sample, refining filter bin widths beyond 3 bins would have resulted in too little data per bin for conclusions to be drawn.
SUVmax Measurements for 5 Spheric Lesions ≥ 10 mm in CTN Oncology Phantom
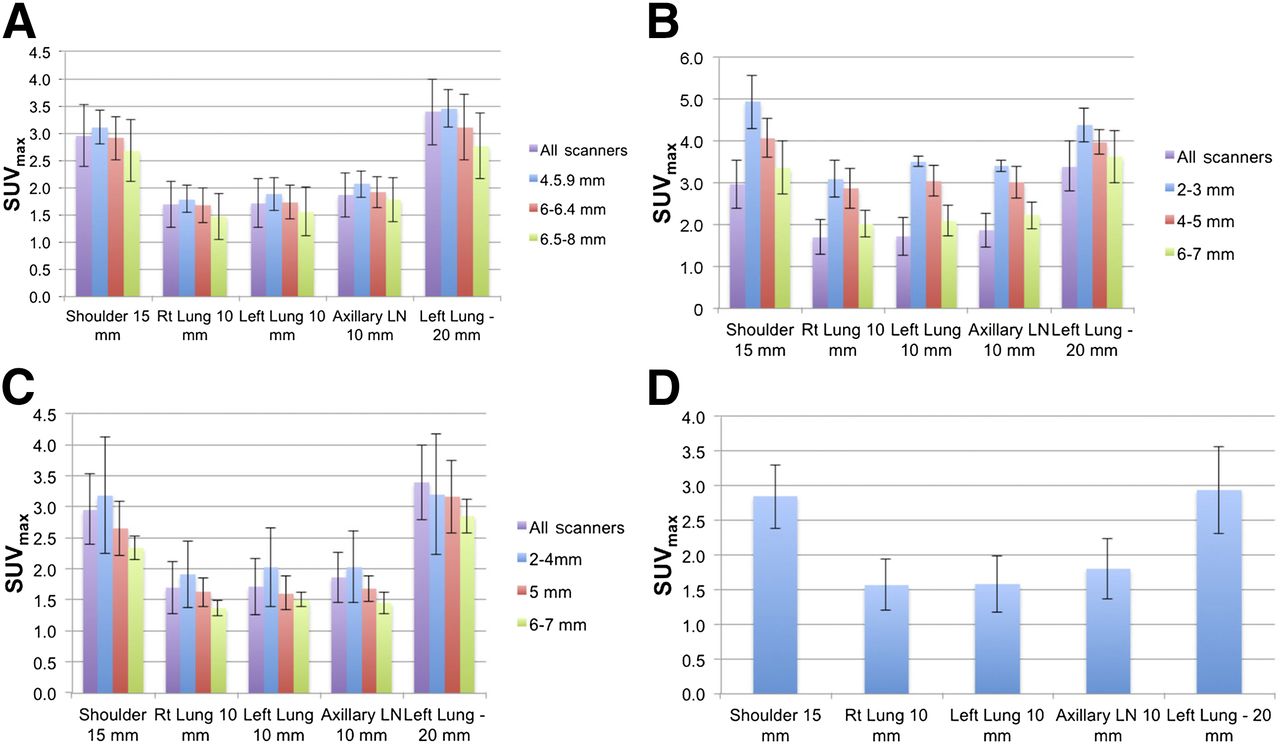
Representative SUVmax histograms of 5 spheric lesions in CTN oncology phantom ≥ 10 mm for 4 different PET/CT scanner makes and models. In A–C, first bar in each histogram grouping is mean value for that lesion in all phantom studies from all scanners. Subsequent histogram bars are averages for specified reconstruction filter width bins. (A) Discovery STE (GE Healthcare). (B) Discovery 690–710 (GE Healthcare). (C) Biograph TruePoint (Siemens). (D) Gemini TF (Philips). Gemini TF shows only single bar as reconstructions were not broken down for Philips scanners because they do not allow user to apply reconstruction filter. LN = lymph node.
Differences in general quantitative performance between vendors was not observed; however, the vintage of scanner models did appear to affect the range and distribution of measured SUVmax for the spheres. For the purposes of this analysis, early-generation PET/CT scanners (Discovery LS, Biograph Duo and Biograph 6, and Gemini and Gemini GS [Philips]) were bundled into 1 category, recent higher performance TOF scanners (690–710, mCT [Siemens], and Ingenuity [Philips]) were put into a second category, and the remaining PET/CT scanners were segregated into a third mid-range performance category. Examples of the different SUVmax distributions for these 3 categories for the 15-mm left shoulder sphere and the 10-mm right lung sphere are shown in Figures 4A and 4B. Virtually all of the anomalously high SUVmax in the plots in the high-performance TOF scanner distribution are associated with point-response-function reconstructions that were inadvertently submitted to CTN (CTN specifically excludes point-response-function reconstructions from its official analyses). The inclusion of these data in these plots is to demonstrate the broad and largely unpredictable quantitative behavior of these reconstructions with current implementations.
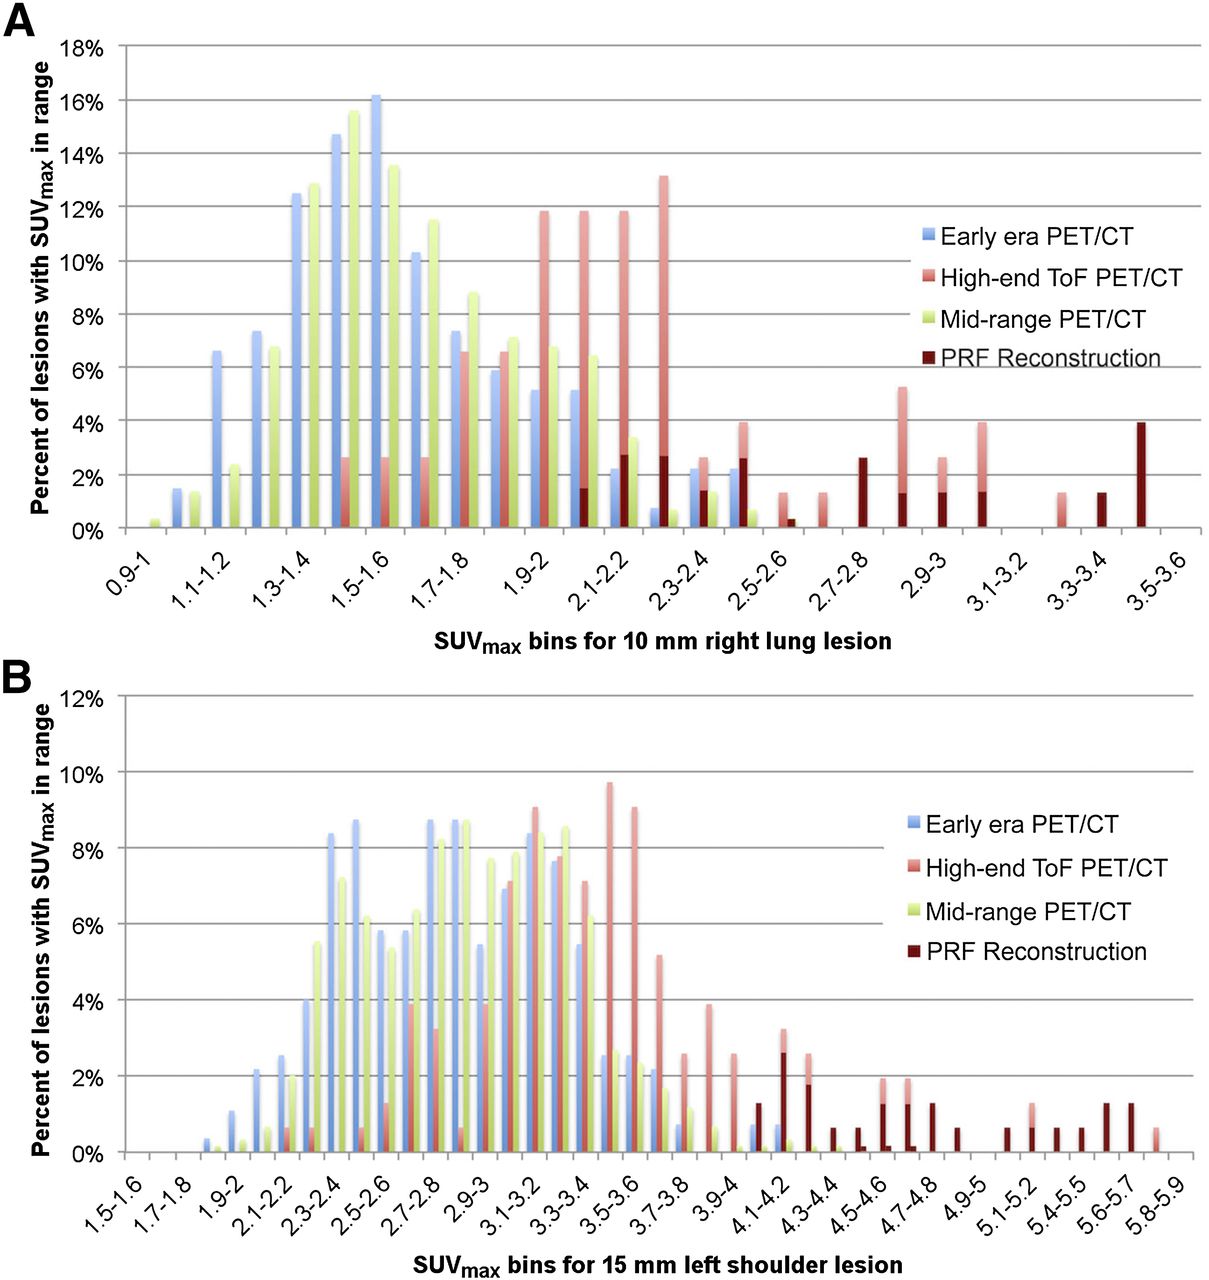
(A) Histogram distribution of SUVmax for 10-mm right lung lesion of CTN oncology phantom for 3 different vintage/performance PET/CT scanner models. (B) Similar SUVmax histogram distribution for 15-mm left shoulder spheric lesion. More recent model TOF-enabled scanners demonstrated higher SUVmax, in general, than non-TOF machines. Point-response-function (PRF) reconstructions primarily but not exclusively from some TOF-enabled machines are designated by maroon bars in both A and B.
DISCUSSION
Multicenter clinical trials typically, and sometimes necessarily, recruit a cross-section of medical centers that range from community-based clinics to world-class academic centers. Imaging sites at these institutions use a range of scanners of different make and model, and the trial protocol generally asks the sites to image their study subjects using their standard clinical acquisition and reconstruction. The impact of this uncontrolled approach to imaging on any quantitative endpoint within the context of a multicenter clinical trial is largely unknown. However, it is clear that any additional variance that results from quantitative variability across imaging equipment and technique will detrimentally affect the statistical power of the study and require more subjects at significantly greater expense.
The collection of more than 400 CTN oncology phantom datasets is a rich and diverse set of qualitative and quantitative information on scanner performance across site type, scanner make and model, and vintage. The data presented provide the first, to our knowledge, large-scale controlled systematic analysis of the impact of scanner and reconstruction-specific quantitative performance.
Perhaps the most surprising result of the phantom dataset is the diversity of reconstruction parameter sets even when limited to a single scanner model. Each scanner site typically begins with a default reconstruction parameter set but then experiments with different parameter sets to achieve a clinical image quality with which the particular site physicians are comfortable. Vendors understandably are providing both the means and the opportunity for each site to optimize reconstructions to their own preferences. However, means and opportunity create an environment where quantitative variability will be inevitable in any multicenter trial.
Scanner Calibration
By convention, all PET scanners are calibrated with a 20-cm-diameter cylindric phantom with known concentration. The accuracy of this calibration is tied to the accuracy of the dose calibrator, timing, and volume measurements associated with the calibration procedure. A properly calibrated scanner will demonstrate accurate concentration measurements in the cylindric phantom across the entire axial field of view, which is precisely what the ACRIN phantom procedure measures and verifies.
The CTN oncology phantom is neither designed to nor capable of confirming full axial field-of-view calibration. Because the VOI for background measurement in the anthropomorphic chest phantom is in the right shoulder, far from the center of the scanner field of view, and because of phantom asymmetry, there is the possibility for calibration measurement bias as compared with that obtained from a standard 20-cm-diameter cylindric phantom. The background SUV distributions for each of the 3 TOF systems from the 3 vendors each demonstrated a nonstatistically significant, but suggestive, calibration bias as measured in the shoulder area of the phantom. These biases, if real, may result from scatter corrections tuned to standard simple geometries that may be rendered inaccurate under more complex situations.
The hypothesis that the complexity of the phantom presents a more significant quantitative challenge is supported by additional background measurements that were made in the uniform myocardial region of the phantom. Specific scanner models frequently showed significant differences between the shoulder background and myocardial background measurements. These differences are not evident in the more common ACRIN-style cylindric phantom test of scanner uniformity. ACRIN’s own observation of differences in mean liver SUV between vendors supports the existence of this problem (13).
Current scatter-correction assessments, such as in National Electrical Manufacturers Association (NEMA) measurements or with the NEMA image quality phantom, are made closer to the center of the scanner field of view and have a uniform concentration and density. The CTN oncology phantom is complex in design and geometry, with multiple-density internal objects, and therefore presents a different and more challenging imaging scenario.
Benchmarking
One of the primary uses of the current CTN oncology phantom image and reconstruction database is benchmarking. An individual scanner can be quantitatively benchmarked against itself, based on prescribed periodic phantom imaging during the course of a clinical trial to determine long-term quantitative stability and variance. Additionally, a particular scanner’s performance can be benchmarked against both identical scanners that use different reconstructions and also identical scanners with virtually identical reconstructions. In either case, an individual phantom scan result, when compared with the compiled and categorized data, can inform the site and trial sponsor of a scanner’s performance relative to relevant statistical parent distributions.
With these data, it is also possible for a trial sponsor to estimate an anticipated variance of quantitative data based on the mix of scanner makes and models used in a multicenter trial (with associated reconstructions) using the compiled SUVmax database for the phantom.
For trial sponsors interested in more prospectively harmonized quantitative data, the database can help sponsors identify make-and-model–specific candidate reconstructions that might help reduce variances prospectively. Because current TOF-enabled scanners demonstrated significantly higher quantitative performance (higher SUVmax) than those without TOF capabilities (Figs. 4A and 4B), a sponsor might consider requiring TOF scanners to reconstruct without the TOF information to reduce differences between scanners. Alternatively, excluding earlier vintage scanners from multicenter clinical trials may be a reasonable strategy for trials in which absolute quantitative measurements are critical.
Quantitative scanner performance as defined by SUVmax of the spheres in the CTN phantom demonstrated significant variability, which was not unexpected given the broad range of scanner vintages and the diversity of reconstructions. Categorizing SUVmax results by scanner and subcategorizing by postreconstruction gaussian filter width demonstrated expected reduction of SUVmax with increasing filter width for all spheres and all scanner makes and models. Within a given model, this decrease in SUVmax occurred at a rate of approximately 0.2–0.3 SUV units per additional millimeter of filter width.
CONCLUSION
The current assembly of more than 400 CTN oncology phantom scans includes multiple image sets from virtually all makes and models of PET/CT scanners. The CTN oncology phantom demonstrated utility in both validating scanner calibration and characterizing the reconstruction-specific quantitative imaging characteristics of 14 different makes and models of PET/CT scanners through the measurement of SUVmax for the phantom’s 5 spheric objects (10–20 mm). The analysis of the variability in the reported phantom lesion measurements should enable sponsors and designers of clinical trials to better estimate quantitative variance within a multicenter clinical trial setting. The reconstruction-specific data should also be useful to help trial designers minimize variance by selecting scanner-specific reconstructions toward quantitative harmonization.
DISCLOSURE
The costs of publication of this article were defrayed in part by the payment of page charges. Therefore, and solely to indicate this fact, this article is hereby marked “advertisement” in accordance with 18 USC section 1734. Financial support for the study was provided by the Clinical Trials Network of the Society of Nuclear Medicine and Molecular Imaging. No other potential conflict of interest relevant to this article was reported.
Acknowledgments
We kindly thank Tina Kiss, Jina Kim, and Bonnie Clarke of the SNMMI for their hard work in administering the CTN scanner validation program and its associated database. Further, we thank Keith Bigham, Medical Designs, Inc., Newtown, Connecticut, for his work in designing, manufacturing, and maintaining the phantoms. Lastly, thanks go to the hard-working members of the CTN scanner validation committee for shepherding the program.
Footnotes
Published online Dec. 18, 2014.
- © 2015 by the Society of Nuclear Medicine and Molecular Imaging, Inc.
REFERENCES
- Received for publication September 8, 2014.
- Accepted for publication November 13, 2014.


Jump to section
Related Articles
Cited By...
- Advantages and Challenges of Total-Body PET/CT at a Tertiary Cancer Center: Insights from Sun Yat-sen University Cancer Center
- Imaging With PET/CT of Diffuse CD8 T-Cell Infiltration of Skeletal Muscle in Patients With Inclusion Body Myositis
- A Path to Qualification of PET/MRI Scanners for Multicenter Brain Imaging Studies: Evaluation of MRI-Based Attenuation Correction Methods Using a Patient Phantom
- Improving prediction of amyloid deposition in Mild Cognitive Impairment with a timed motor task
- The Australasian Radiopharmaceutical Trials Network: Clinical Trials, Evidence, and Opportunity
- Automated Segmentation of Baseline Metabolic Total Tumor Burden in Diffuse Large B-Cell Lymphoma: Which Method Is Most Successful? A Study on Behalf of the PETRA Consortium
- SPECT/CT: Standing on the Shoulders of Giants, It Is Time to Reach for the Sky!
- Optimization of 89Zr PET Imaging for Improved Multisite Quantification and Lesion Detection Using an Anthropomorphic Phantom
- PennPET Explorer: Design and Preliminary Performance of a Whole-Body Imager
- Use of a Qualification Phantom for PET Brain Imaging in a Multicenter Consortium: A Collaboration Between the Pediatric Brain Tumor Consortium and the SNMMI Clinical Trials Network
- Measuring PET Spatial Resolution Using a Cylinder Phantom Positioned at an Oblique Angle
- Time-of-Flight Information Improved the Detectability of Subcentimeter Spheres Using a Clinical PET/CT Scanner
- PET Imaging Stability Measurements During Simultaneous Pulsing of Aggressive MR Sequences on the SIGNA PET/MR System
- Does PET SUV Harmonization Affect PERCIST Response Classification?