


Article Figures & Data
Figures
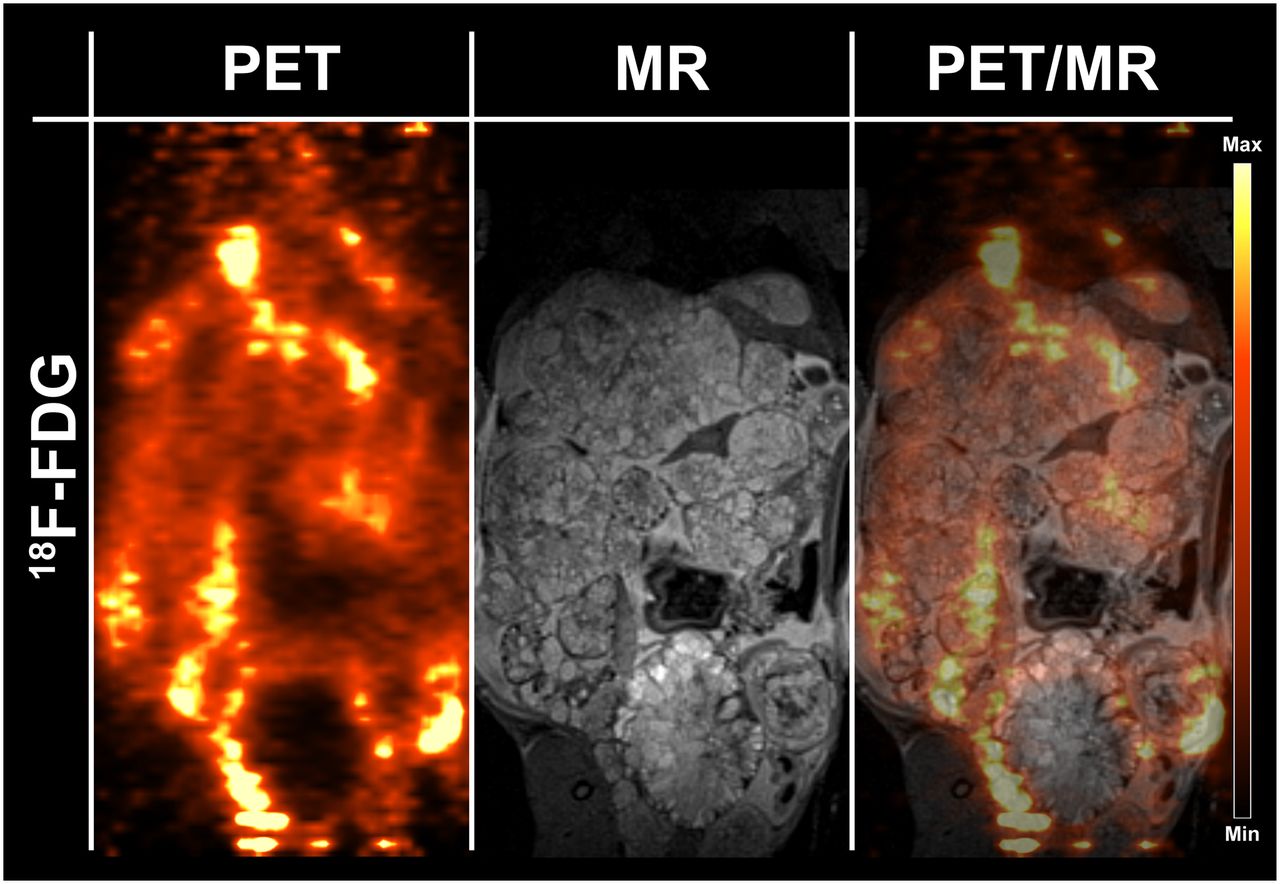
- FIGURE 1.
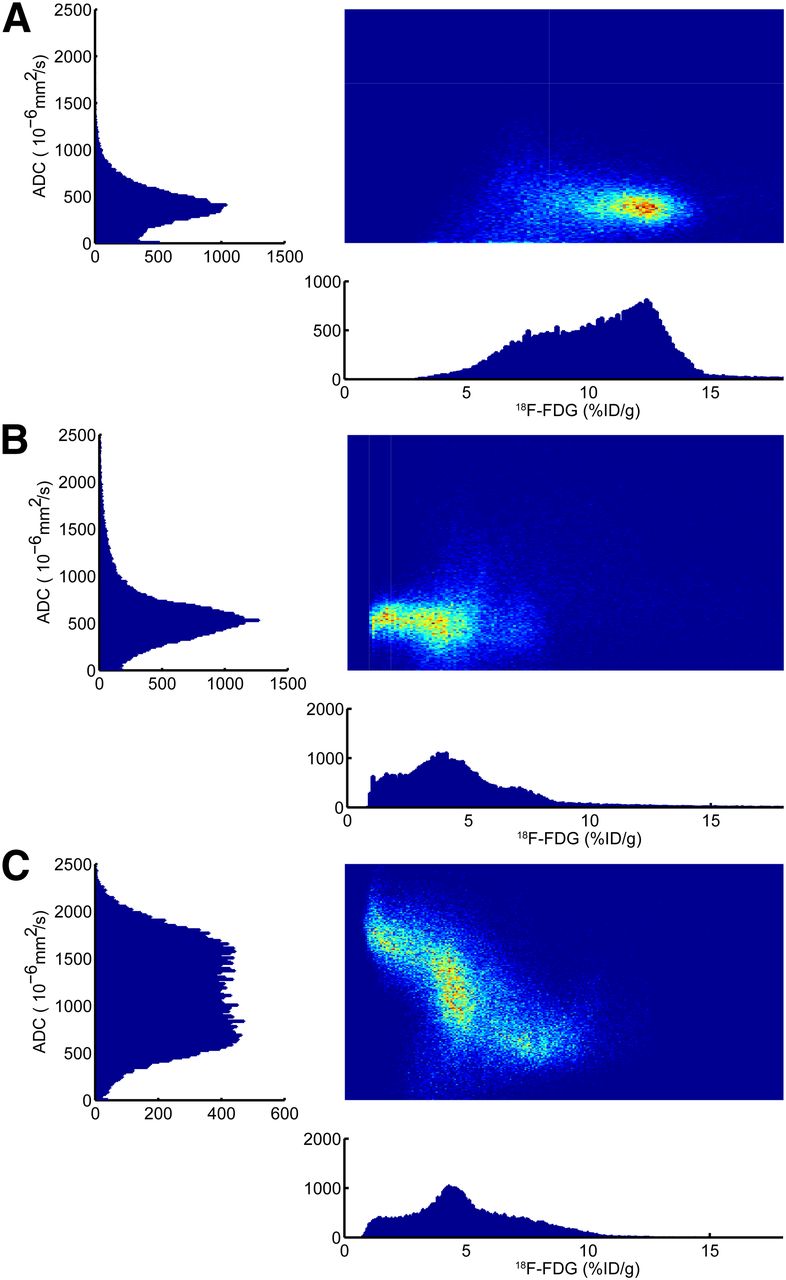
Density scatterplots with corresponding histograms of 18F-FDG on x-axes and apparent diffusion coefficient (ADC) on y-axes. This representation emphasizes the gain of information from simultaneous imaging compared with individual measurements. (A) Baseline measurement depicts relatively high 18F-FDG uptake compared with later measurements, and apparent diffusion coefficient is tightly centered at approximately 500 × 10−6 mm2/s, representing aggressive tumor with high cellular density. (B) After initiation of therapy, 18F-FDG signal decreases dramatically, reflecting metabolic breakdown of glucose consumption. Interestingly, average apparent diffusion coefficient value changes only slightly, reflecting that cellular density in tumor remains stable. By final, late measurement time point, the tumor is well differentiated, depicting areas of high cellularity with two populations of glucose metabolism and two areas of low cellularity with low and medium glucose uptake. %ID = percentage injected dose.
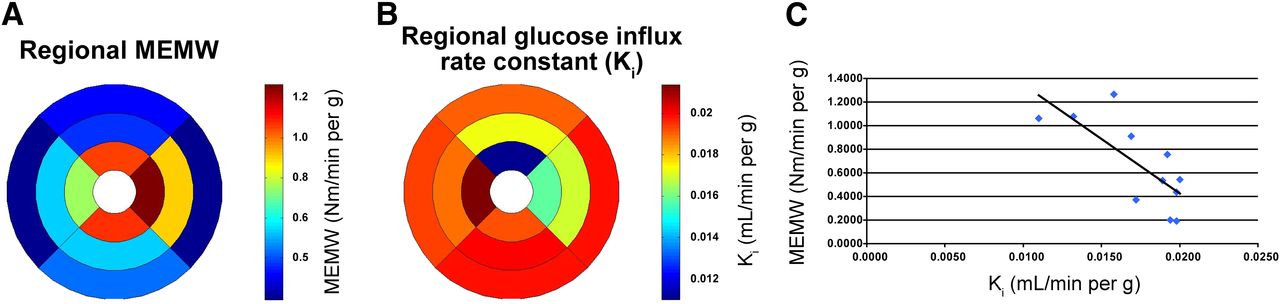
- FIGURE 2.
(A) MEMW calculated using strain and stress calculations and displayed as polar plot. Units for MEMW are in Newton meters/minutes/gram of tissue. (B) 18F-FDG metabolic rate Ki, displayed as polar plot, using PET simultaneously with tagged MR imaging that was used for MEMW assessment. (C) Correlation of regional metabolic rate of 18F-FDG with MEMW. Regression analysis shows negative correlation (R = 0.75) between MEMW and influx constant for 18F-FDG, suggesting that metabolites other than glucose are preferred at rest. This correlation was significantly different from zero (P = 0.0322). Heart prefers substrates that maximize efficiency, such as fatty acids, which provide 38 kJ/g compared with 17 kJ/g for glucose. Figure shows strength of PET/MR imaging in cardiac imaging insofar as it combines mechanical information derived from high-resolution MR imaging with metabolic information derived from PET.
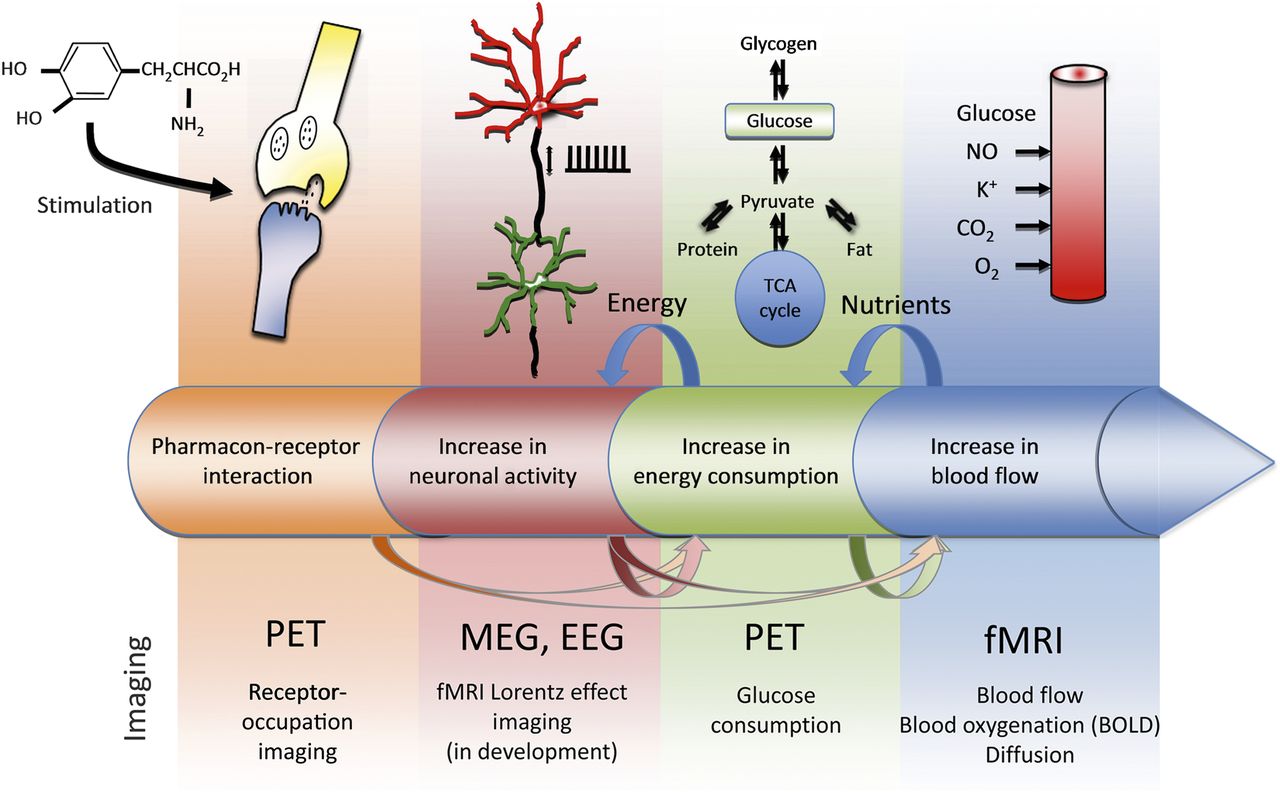
- FIGURE 3.
Metabolic cascade of brain function and available imaging technologies. In this example, pharmacologic stimulus triggers entire cascade of processes in brain. Pharmacoreceptor interaction, which can be monitored by PET, leads to increase in neuronal activity and spiking rates. This increase in neuronal activity is met by increase in energy consumption, which is domain of glucose PET. Finally, nutrients need to be delivered to site of activity, which leads not only to increases in blood flow and blood volume but also to changes in blood oxygenation and other parameters. Both fMR imaging and PET techniques exist to monitor these changes. As indicated by arrows, possibility exists for shortcuts and decoupling between metabolic steps. PET/MR imaging is excellent tool with which to monitor these multiple stages of metabolism simultaneously because it allows combination of high-sensitivity PET techniques and advanced MR methods, such as BOLD imaging. (Modified and reproduced with permission of (77).)
- FIGURE 4.
Simultaneous PET/MR imaging during whisker stimulation in small animals. Simultaneous BOLD fMR imaging and 18F-FDG PET depict activated areas in brain. Main activation focus, contralateral barrel field cortex (S1BF), is seen in both modalities, albeit with different statistical significance and spatial extents. However, 18F-FDG PET reveals additional activated areas, such as insular cortex (GI/DI) and amygdala (Amyg), which were not present in BOLD imaging. In some areas of brain, BOLD signal change may be too small or too slow to be picked up by fMR imaging. This figure shows complementary nature of PET/MR imaging in brain research. RSGB = retrosplenial granular cortex; Cg = cingulate cortex; M1 = primary motor cortex; S1ULp = primary somatosensory cortex, upper-lip region; CA = cornu ammonis areas (areas of the hippocampus); Tha = thalamus; CPu = caudate putamen; VPL = ventral posterolateral nucleus; VPM = ventral posteromedial nucleus; Ect = ectorhinal cortex; PRh = perirhinal cortex; Z = represents the anterior (positive) or posterior (negative) position of the displayed slice relative to the bregma. (Reprinted with permission of (3)).
- FIGURE 5.
Simultaneous small-animal PET/MR imaging using 18F-FDG as PET tracer for detection of Echinococcus multilocularis in infected Mongolian gerbil. Images were acquired 1 h after injection of 10 MBq of 18F-FDG. Surrounding inflamed tissue is highlighted by the glucose PET tracer, but parasite tissue is not highlighted, depicting the need for disease-specific PET tracer.
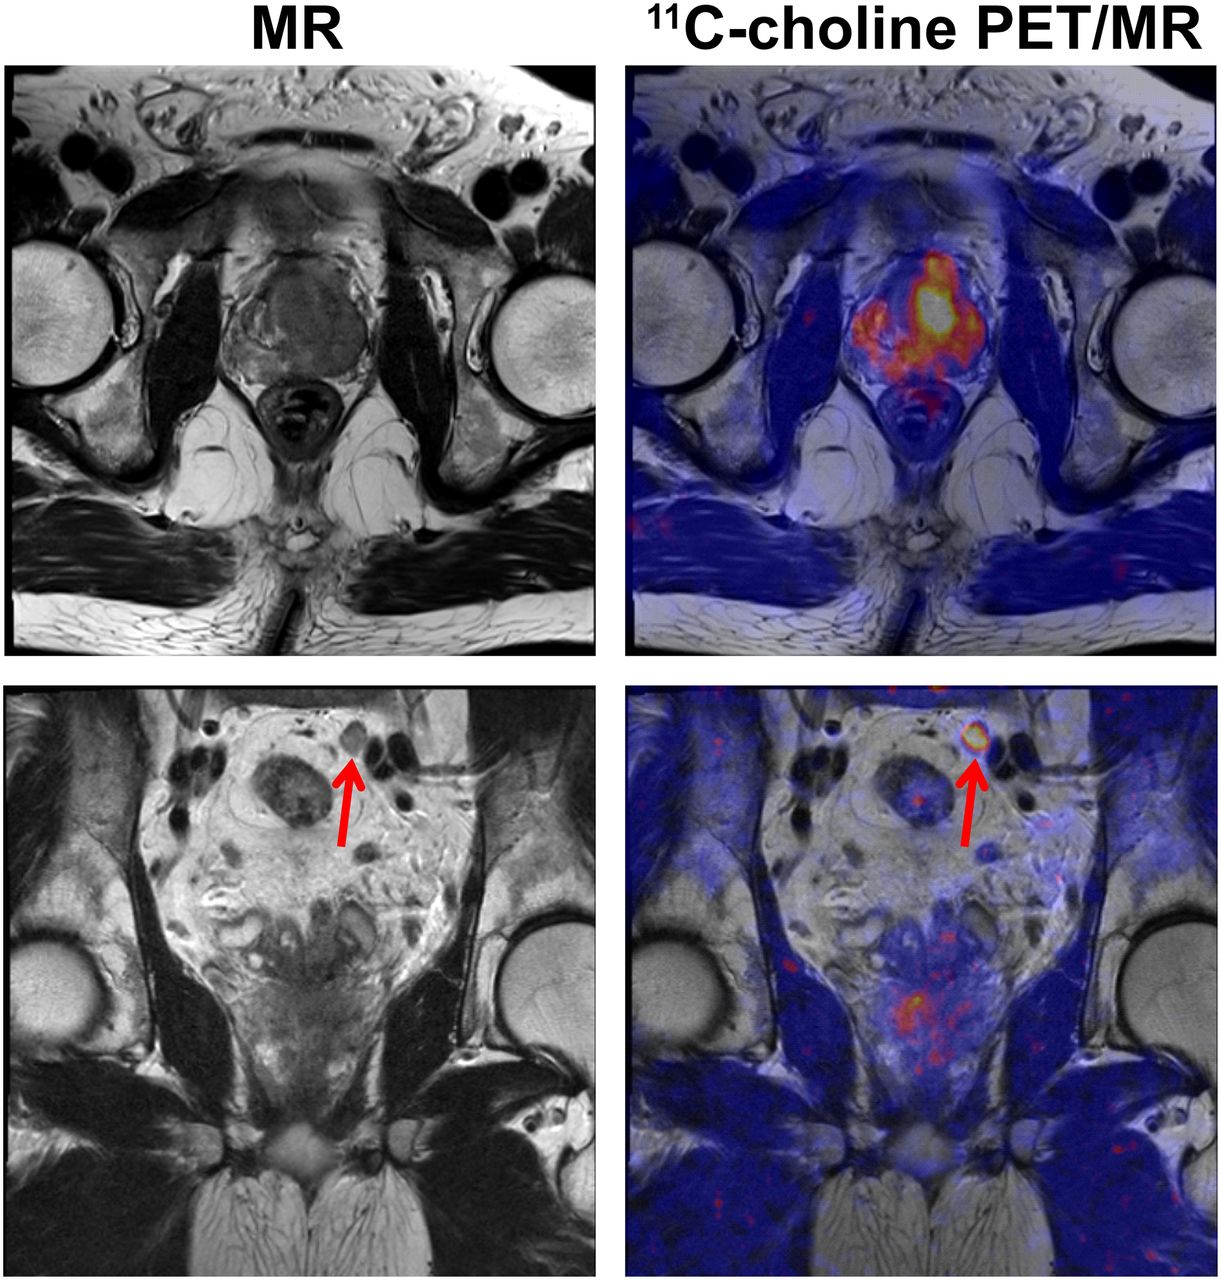
- FIGURE 6.
58-y-old man with prostate cancer. 11C-choline PET/MR image shows primary cancer in prostate gland (upper row) as well as pelvic lymph node metastasis (bottom row, arrow). This example emphasizes value of PET/MR imaging in oncologic diagnostics because high-resolution MR imaging can be combined with specific PET tracers.


Jump to section
Related Articles
Cited By...
- Imaging of red-shifted photons from bioluminescent tumours using fluorescence by unbound excitation from luminescence
- Impact of the Arterial Input Function Recording Method on Kinetic Parameters in Small-Animal PET
- Comparison of the Accuracy of FMT/CT and PET/MRI for the Assessment of Antibody Biodistribution in Squamous Cell Carcinoma Xenografts
- In Vivo Imaging of Tumor Metabolism and Acidosis by Combining PET and MRI-CEST pH Imaging
- ImmunoPET/MR imaging allows specific detection of Aspergillus fumigatus lung infection in vivo
- Alzheimer Disease: Approaches to Early Diagnosis and High-Accuracy Imaging
- Combined PET/MR: A Technology Becomes Mature
- Introduction