


Abstract
11C-(+)-4-propyl-9-hydroxynaphthoxazine (11C-(+)-PHNO) is an agonist radioligand for imaging dopamine D2 and D3 receptors in the human brain with PET. In this study we evaluated the reproducibility of 11C-(+)-PHNO binding parameters using a within-day design and assessed parametric imaging methods. Methods: Repeated studies were performed in 8 subjects, with simultaneous measurement of the arterial input function and plasma free fraction. Two 11C-(+)-PHNO scans for the same subject were separated by 5.4 ± 0.7 h. After compartment models were evaluated, 11C-(+)-PHNO volumes of distribution (VT) and binding potentials relative to the concentration of tracer in plasma (BPP), nondisplaceable tracer in tissue (BPND), and free tracer in tissue (BPF) were quantified using the multilinear analysis MA1 method, with the cerebellum as the reference region. Parametric images of BPND were also computed using the simplified reference tissue model (SRTM) and SRTM2. Results: The test–retest variability of 11C-(+)-PHNO BPND was 9% in D2-rich regions (caudate and putamen). Among D3-rich regions, variability was low in the pallidum (6%) but higher in substantia nigra (19%), thalamus (14%), and hypothalamus (21%). No significant mass carry-over effect was observed in D3-rich regions, although a trend in BPND was present in the substantia nigra (−14% ± 15%). Because of the relatively fast kinetics, low-noise BPND parametric images were obtained with both SRTM and SRTM2 without spatial smoothing. Conclusion: 11C-(+)-PHNO can be used to compute low-noise parametric images in both D2- and D3-rich regions in humans.
The tracer 11C-(+)-4-propyl-9-hydroxynaphthoxazine (11C-(+)-PHNO) is used to study dopamine D2 and D3 receptors (D2R and D3R) in vivo with PET (1). As an agonist tracer (2), 11C-(+)-PHNO is useful to study the high-affinity states of D2R/D3R and to amplify the signal in studies of dopamine release (3). Other available D2R/D3R agonist radioligands include (−)-N-11C-propyl-norapomorphine (11C-NPA) and [O-methyl-11C]2-methoxy-N-propylnorapomorphine (11C-MNPA). In contrast to existing radioligands, however, 11C-(+)-PHNO is D3R-preferring, with a 30- to 50-fold higher affinity for D3R than for D2R both in vitro (4) and in vivo (5). Therefore, 11C-(+)-PHNO–specific binding derives from contributions of both D2R and D3R, in proportions that vary across regions based on their respective densities. The D3R fraction of specific binding ranges from 0% in the putamen to 100% in the substantia nigra (SN) and hypothalamus in humans (6). Though 11C-(+)-PHNO is not a perfectly selective D3R radioligand, it is, to date, the most specific radioligand available to assess D3R in vivo in humans (7).
Kinetic modeling of 11C-(+)-PHNO has been performed previously in humans (8). For studies with arterial blood sampling, a constrained form of the 2-tissue-compartment (2TC) model was selected as the method of choice to estimate BPND binding potentials, and for studies without arterial blood sampling, the simplified reference tissue model (SRTM) provided highly correlated outcomes (albeit with a 10% underestimation of BPND) (9). One goal of the present study was to evaluate the test–retest (T-R) variability (TRV) of 11C-(+)-PHNO parameter estimates using a within-day design and the high-resolution PET scanner, High-Resolution Research Tomograph (HRRT; Siemens/CTI). The latter is especially relevant in light of the regional D3R specificity of small structures, such as the SN. The second goal of this study was to evaluate strategies for computing parametric images of 11C-(+)-PHNO binding potentials to minimize image noise while using the lowest amount of spatial smoothing possible, for purposes of elucidating receptor topology at high resolution. In addition, potential mass carry-over effect on binding parameters, as seen in previous preclinical studies (10), was also investigated in this within-day, repeated-scan paradigm, particularly in high-affinity D3R-rich regions.
MATERIALS AND METHODS
Subjects
Eight subjects (7 men, 1 woman) were included in the study: 5 were healthy controls (HCs) and 3 were cocaine-dependent (CD) according to the Diagnostic and Statistical Manual of Mental Disorders (DSM-IV) (11) criteria. We purposefully included a patient group in the T-R assessment (see the “Discussion” section). The average age and weight were 35 ± 9 y and 80 ± 16 kg, respectively. The absence of recent substance use was confirmed by urine toxicology on both the day of screening and the day of PET scanning, before tracer injection.
The study was performed under protocols approved by the Yale School of Medicine Human Investigation Committee, the Human Subjects Subcommittee of the Veterans Affairs Connecticut Healthcare System, the Yale-New Haven Hospital Radiation Safety Committee, and the Yale University Radiation Safety Committee. Subjects were recruited by public advertisement. Written informed consent was obtained from all participants after full explanation of study procedures.
Radiochemistry
11C-(+)-PHNO was prepared by N-acylation of the norpropyl precursor with 11C-propionyl chloride, followed by reduction of the resulting amide with lithium aluminum hydride and purification by reversed-phase high-performance liquid chromatography, in a modified literature procedure (1). The supplemental information provides details (supplemental materials are available at http://jnm.snmjournals.org). The radiochemical and chemical purity were greater than 98% and greater than 99%, respectively, and the specific activity at the end of synthesis was 83 ± 35 MBq/nmol.
PET Imaging
Each subject underwent 2 PET scans on the same day, separated by 5.4 ± 0.7 h (minimum, 4.5 h), on the HRRT. 11C-(+)-PHNO (328 ± 103 MBq) was injected by a computer-controlled infusion pump (Harvard PHD 22/2000; Harvard Apparatus). The tracer specific activity at the time of injection was 45 ± 18 MBq/nmol. The injected mass was 25 ± 5 ng/kg (maximum, 31 ng/kg). The injected dose, injected mass, and specific activity did not differ significantly between the test and retest scans (paired t test, P = 0.13, 0.97, and 0.60, respectively) (Table 1). The metabolite-corrected arterial input function and the plasma free fraction (fP) of 11C-(+)-PHNO were measured. The supplemental information provides details.
Synthesis and Injection Parameters
Quantification of PET Data
Gray matter regions of interest (ROIs) were taken from the anatomic automatic labeling template. Six ROIs were selected: cerebellum, caudate, putamen, pallidum, amygdala, and thalamus. Extra ROIs corresponding to the hypothalamus and ventral striatum were also drawn on the template MR image, and an SN template ROI was also created using PET images (supplemental information). The template ROIs were applied to the PET data using nonlinear transforms (supplemental information).
On the basis of a previous report (8), the 2TC model and multilinear analysis (MA1) method (12) were evaluated to quantify the volume of distribution (VT) (9) using arterial blood sampling. To compare the quality of fit between the 1TC and 2TC models, the residual sum of square was compared with the F test, using a cutoff P value of 0.05 corrected for the number of comparisons (i.e., the number of scans, 16). For MA1, the starting time of the fit, t*, was set to 30 min. On the basis of the VT values, 3 versions of the binding potential (BPF, BPP, and BPND) (9) were calculated, with the cerebellum used as the reference region. In addition, the SRTM (13) was used to estimate 11C-(+)-PHNO BPND without arterial blood sampling.
For parametric imaging, both the SRTM (13) and the SRTM2 (14) methods were tested. Both SRTM and SRTM2 were implemented using a basis-function approach restricting the parameter k2 (the clearance rate constant of each voxel) to the range of 0.01–1.0 min−1. No spatial smoothing was applied. In SRTM2, the clearance rate constant of the reference region,  , was estimated from SRTM parametric images as the median
  estimate from brain voxels where BPND was greater than 0.5. ROIs, as described above, were applied to the parametric images, and the mean values for BPND were compared with those obtained by fits of regional time–activity curves.
TRV Estimation
TRV was estimated for each parameter of interest p by computing first ∆p as defined below: Eq. 1and then by computing the means of ∆p across subjects (noted as
  ) and the SD of ∆p across subjects (noted as
  ), with
  indicating whether there is a trend between the 2 scans for the parameter of interest p and
  as an index of the variability for the estimates of the parameter of interest p. An alternate index of the variability for the estimates of the parameter of interest p was also computed as the mean across subjects of the absolute value of ∆p and noted as
  . For comparison with a previous study (15),
  was computed, where
  . Finally, the intraclass correlation coefficient (ICC) was also computed as in the study of Shrout and Fleiss (16). Because this study includes HCs and CD subjects, the between-subject variance is larger than what would be present in a single-group study, causing the ICC values to be increased (see the “Discussion” section).
For parametric images, TRV was computed in 2 ways: first, to estimate variability in ROI-based analyses, TRV was computed using the regional averages of the parametric images. Second, to assess variability for statistical analyses of parametric images, test and retest parametric images were resliced to the ROI template space, images of  and
and  were generated in template space, and finally the median of
  and
and  within each ROI was computed.
RESULTS
Kinetic Analysis with Arterial Input Function
In the pallidum, hypothalamus, ventral striatum, and SN, the 2TC model provided better fits than the 1-tissue-compartment (1TC) model for all subjects and scans (F2,29, P < 0.003). In other regions, 2TC provided better fits for most scans. However, 2TC did not provide reliable VT estimates in most regions, with at least 25% of the VT relative SEs (%SE) being higher than 50% in the cerebellum, putamen, ventral striatum, hypothalamus, and SN and ICC values for VT estimates being lower than 0.03.
Because of the variability in 2TC VT estimates, MA1 was also evaluated. Typical fits obtained with MA1, 1TC, and 2TC models are shown in Figure 1. For the subset of regions and scans for which the 2TC VT %SE was lower than 5%, the VT values estimated with MA1 (t* = 30 min) and 2TC were nearly identical (r2 = 0.996, y = 0.97x + 0.17, where x represents the 2TC estimates and y represents the MA1 estimates). With MA1, the %SE of VT was less than 5% for all scans in the amygdala, caudate, putamen, pallidum, and thalamus. In the SN, ventral striatum, and hypothalamus, the highest %SEs were 12%, 7%, and 12%, respectively.

Sample fits obtained with MA1 (solid line) and with 1TC (dashed line) and 2TC (dotted line) models in 1 typical subject’s test scan. Data are derived from standardized uptake values in cerebellum (A), putamen (B), pallidum (C), and SN (D).
The MA1 parameter estimates from the test scan for HCs (n = 5) and the T-R statistics for all subjects (n = 8) are listed in Table 2. There were no significant differences between test and retest VT in any ROI (paired t test; P value from 0.37 to 0.92), and the mean relative change of VT,  , ranged between −9% and +2%. The variability of VT (
 ) ranged from 13% in the putamen to 25% in the SN. The means of the absolute values of ∆VT,
  , were lower than
  and ranged from 9% to 21% (see the “Discussion” section). The ICC values for VT estimates ranged from 0.28 in the cerebellum to 0.88 in the pallidum. The fP was 0.44 ± 0.03 (n = 5) for the test scans, with no T-R change (∆fP = 0% ± 7%, n = 8; P = 0.88, paired t test;
  = 5%). Normalizing VT by fP did not change TRV (supplemental information). σ(∆BPND) ranged from 10% to 29%, and
  ranged from 6% to 25%. The variability of BPP and BPF was approximately 22% and approximately 13% higher, respectively, than that of BPND (based on
  ) (supplemental information). The ICC values for MA1 BPND estimates ranged from 0.29 in the amygdala to 0.92 in the SN and caudate.
VT and BPND Estimates for MA1 Fits of Regional Time–Activity Curves
Kinetic Analysis with Reference Region
SRTM BPND in the caudate, putamen, pallidum, and SN was well correlated with BPND estimated with MA1. The parameters of the regression line between MA1 and SRTM BPND values were slope = 0.966 ± 0.012, intercept = 0.080 ± 0.032, and r2 = 0.984. The thalamus was not included in this comparison because SRTM BPND estimates in the thalamus had poor identifiability (maximum %SE > 100%; ∆BPND = 1% ± 105%). TRV indices for SRTM BPND are listed in Table 3. The variability of SRTM BPND estimates was similar to that of MA1 BPND estimates in the basal ganglia and SN (neither ∆BPND nor |∆BPND| was significantly different between these 2 methods in these ROIs: paired Student t test P > 0.11). The ICC values for SRTM BPND estimates ranged from 0.06 in the hypothalamus to 0.92 in the caudate.
BPND Estimates for SRTM Fits of Regional Time–Activity Curves
Parametric Imaging
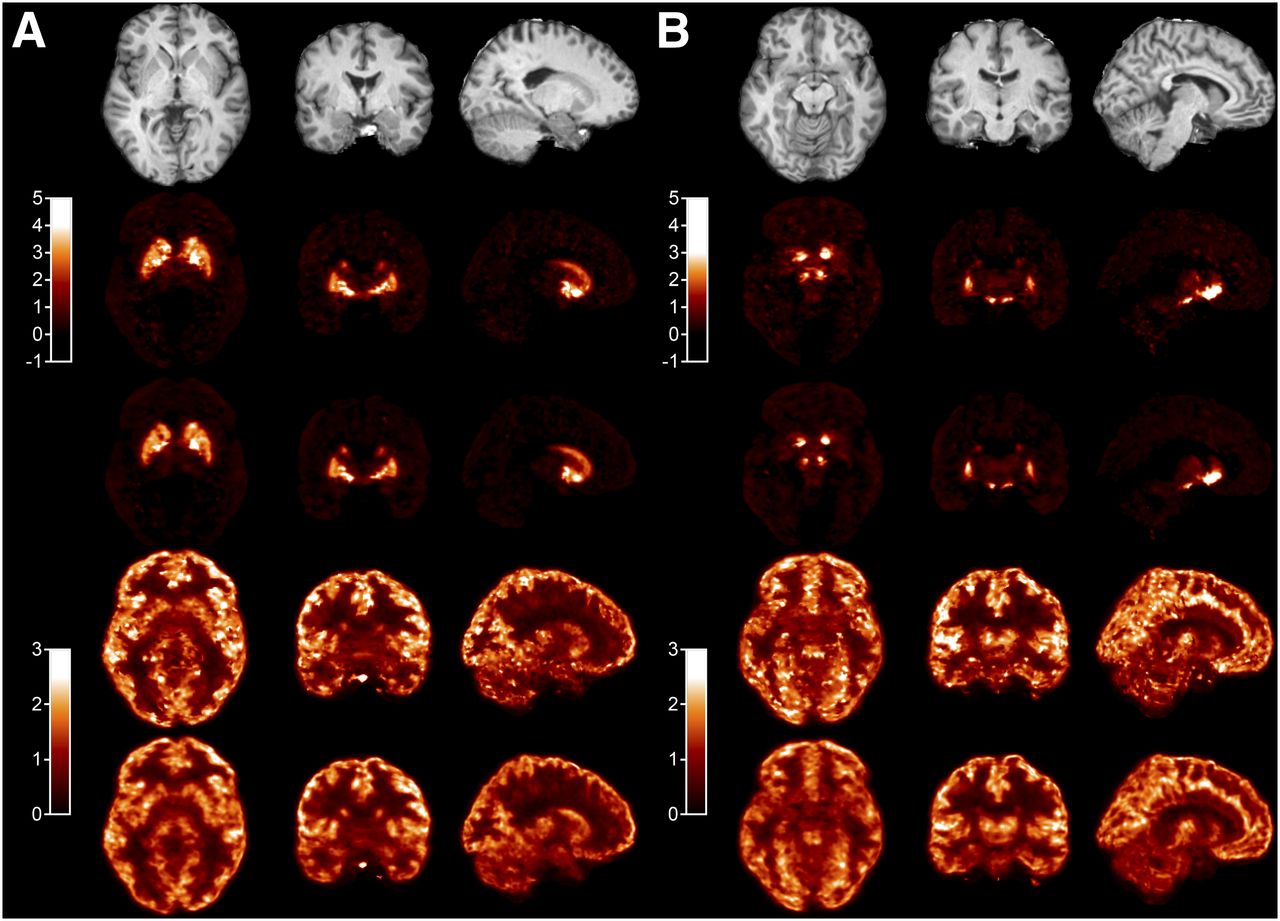
Typical SRTM and SRTM2 parametric images are shown in Figure 2. Visually, SRTM and SRTM2 BPND images are similar, with slightly lower noise in SRTM2 images (noise reduction is more visible in low-binding regions or near high-BPND areas) but also slightly lower BPND values in D3-rich regions. There was a visually bigger reduction of noise with SRTM2 for delivery (R1) images. The variability of the parametric images was quantified by computing parametric images of σ(∆R1) and σ(∆BPND) in template space. The median value in each ROI is reported in Supplemental Table 3. The median of σ(∆R1) ranged from 20% to 37% with SRTM and from 14% to 23% with SRTM2, and the improvement with SRTM2 ranged from 2 percentage points (in the SN) to 14 percentage points (in the amygdala). The median of σ(∆BPND) ranged from 34% (in the caudate) to 155% (in the amygdala) with SRTM and from 22% (in the caudate) to 86% (in the amygdala) with SRTM2, and the improvement with SRTM2 ranged from −1 percentage point in the hypothalamus to 69 percentage points in the amygdala.

Typical parametric images at level of pallidum (A) and SN (B). Row 1 is coregistered MR image; row 2, SRTM BPND; row 3, SRTM2 BPND; row 4, SRTM R1 (relative delivery); and row 5, SRTM2 R1.
ROI values from the parametric images (Table 4) were well correlated with BPND estimated from fits of regional time–activity curves. The regression parameters between MA1 and parametric BPND were slope = 0.888 ± 0.018, intercept = 0.219 ± 0.047, and r2 = 0.952 for SRTM and slope = 0.861 ± 0.019, intercept = 0.133 ± 0.048, and r2 = 0.941 for SRTM2. At the regional average level, SRTM2 and SRTM BPND were highly correlated (slope = 0.971 ± 0.009, intercept = –0.081 ± 0.021, and r2 = 0.990), though SRTM2 values were slightly lower than SRTM values, with relative differences ranging from 0% ± 2% in the putamen to −19% ± 7% in the hypothalamus, with −12% ± 8% in the SN (significant in all regions except the putamen).
Regional BPND Values from Parametric Maps
TRV indices and ICC values of regional averages from SRTM and SRTM2 parametric images are listed in Table 4. The variability of SRTM and SRTM2 values was similar to that of MA1 BPND estimates in all ROIs.
Carry-over Mass Effect
There were no significant differences between test and retest BPND in any ROI outside the SN (paired t test; P = 0.14–0.95). In the SN, there was a trend level or significant reduction in BPND in the retest scans depending on the method. The P values were 0.06 with MA1 and less than 0.05 with SRTM and parametric SRTM and SRTM2 (paired t test; n = 8). The average reduction of the SN BPND across all methods was −14% ± 15%.
DISCUSSION
The current study extends evaluations of optimal image and data analyses for 11C-(+)-PHNO–bolus-injection PET studies in humans using multiple modeling methods, parametric imaging, and T-R studies. A detailed comparison of kinetic modeling methods for quantifying 11C-(+)-PHNO binding in humans has been published previously (8). In that study, the 2TC model was the method of choice to estimate 11C-(+)-PHNO VT. However, in the current study, high %SE was observed in some scans and ROIs. The differences between these 2 studies may also be due to different noise properties of the 2 datasets (both were acquired on the same type of scanner but with different reconstruction algorithms), differences in the delineation of the regions of interest, or differences in the fitting routines and settings.
A method providing a compromise between the quality of fit of 2TC and the stability of VT estimates was needed. The Logan graphical analysis was tested in the previous study and was found to provide VT estimates highly correlated to, and not statistically different from, those obtained using unconstrained 2TC fits (8). However, the Logan graphical analysis is sensitive to noise, especially for small regions or single-voxel time–activity curves. The multilinear analysis MA1, which was designed to reduce this bias (12), was tested and proved to be the preferred method, as it provided more stable parameter estimates than 2TC.
In theory, SRTM is not a valid method for 11C-(+)-PHNO because the regional time–activity curves are not well fitted with the 1TC model when the arterial input function is used. However, SRTM provided BPND estimates in good agreement with the MA1 estimates, which is partially in agreement with the earlier results (8): in that report, SRTM BPND estimates were in good agreement with BPND estimates with unconstrained 2TC fits (method B in the study by Ginovart et al. (8)), but they were lower than BPND estimates from constrained 2TC fits (method D in the study by Ginovart et al. (8)), the latter being the method of choice in that study. However, in the current study the good correlation between MA1 and SRTM BPND estimates was verified in a larger selection of ROIs, adding the SN, amygdala, and hypothalamus. SRTM2 also provided BPND estimates in good agreement with MA1 estimates.
In this study, 2 TRV indices were computed:  and
and  . The main advantage of computing the mean and SD of ∆p (
 and
and  ) is that it can be used to assess whether there is a systematic trend or significant change in binding parameters between the test and retest scans. Computing only
  does not permit the assessment of that trend. However,
  and
and  tend to provide numerically different indices for the variability of the parameter p, with
  being typically higher than
  . Indeed, for a gaussian variable p, with no trend between the test and retest scans (i.e.,
  ),
),  is close to the relative SD of p, whereas
  is higher than the relative SD of p by a factor √2, because it represents the combined errors in the test and retest scans. On the other hand,
  will be close to the SD of
  obtained in studies comparing baseline with postintervention scans, when the effect of the intervention is small. Thus,
  is useful to evaluate the possibility to detect small differences or effects. However,
  is frequently used in the literature and, thus, is useful to be computed in addition to
  when tracers or methods are being compared.
Because of the high affinity of 11C-(+)-PHNO for D3R and prior suggestions that PET studies performed using 0.03 μg/kg of 11C-(+)-PHNO may not actually occur under true tracer conditions (5,17), it was postulated that binding potential estimates would be lower in D3-rich regions during the same-day retest scanning. This was seen in a previous preclinical study (10), where the injected mass of 11C-(+)-PHNO was approximately 0.04 μg/kg and the delay between injections was approximately 3 h and  ranged from −22% to −42% in D3-rich regions. The current study was not designed to maximize chances of observing a carry-over mass effect but rather to evaluate whether such an effect could be detected despite the deliberate use of a longer (5-h) interval between 11C-(+)-PHNO injections. As postulated, a significant reduction in BPND was detected in the SN in the retest scans, though this reduction was not significant with all methods and would not survive correction for multiple comparisons. The average
  was −14% across all methods. Three mechanisms for this carry-over effect are possible. First, sufficient unlabeled (+)-PHNO from the first injection might remain and compete for tracer binding during the second injection. Second, receptor changes in response to nontracer doses of the agonist during scan 1 are also possible (albeit unlikely here). Finally, we cannot rule out potential differences resulting from circadian variations, because by design all initial injections were around 10 am and all second injections around 3–4 pm. The first hypothesis is compatible with estimates of the remaining concentration of (+)-PHNO during the second scan and previous estimates of the effective dose of (+)-PHNO inhibiting 50% of 11C-(+)-PHNO–specific binding ((+)-PHNO ED50). Indeed, during the first scan, the observed BPND would be given by the following equation:
 Eq. 2where
  is the true binding potential at tracer dose, C is the concentration of tracer in tissue, and
  is the concentration of tracer to induce 50% reduction in binding. During the retest scan, assuming that the injected dose is similar, the observed BPND would be:
 Eq. 3where f is the fraction of tracer remaining from the first injection. Between the end of the first scan and the beginning of the second, the concentration of free (+)-PHNO in the SN may have decreased by 64%, based on extrapolation of the cerebellum curve, to 48%, based on extrapolation of the SN curve. To observe a mean
  value of 14% in such conditions, the concentration C in the above equations would need to be approximately 50% of the tracer
  . The average dose of 11C-(+)-PHNO used in this study was 25 ng/kg, which is indeed close to 50% of the 11C-(+)-PHNO ED50 estimated in a previous study (40 ng/kg) (17). Although there was no significant difference in the hypothalamus, another region in which approximately 100% of 11C-(+)-PHNO BPND is due to D3R binding, there was, nonetheless, a similar trend (
 of −10% in average across all methods, which was not significant because of the higher variability of 11C-(+)-PHNO BPND in this region.
When the various methods of computing BPND are compared, the variability of MA1 and SRTM estimates was comparable for ROI time–activity curve analyses, except in the thalamus, for which SRTM results were quite unreliable. When regional averages from parametric images were used, the variability of SRTM and SRTM2 BPND values was slightly lower than that of MA1 estimates. This effect was attributed to the choice of basis functions, which acted like a filter or a prior (see discussion below about parametric images). The ICC criterion leads to a similar conclusion: ICC values were slightly lower for SRTM BPND estimates than for MA1 BPND estimates, whereas ICC values for BPND values from parametric images (SRTM or SRTM2) were closer to the ICC values for MA1 BPND estimates.
The TRV of 11C-(+)-PHNO BPND estimated with SRTM in this study was slightly better (lower) than in a previous study (15) for the caudate and putamen ( was 9%–10%, vs. 12% in the previous study) and much lower for the pallidum (
 was 11% vs. 28% in the previous study). Conversely, the TRV of BPND estimated with SRTM in this study was slightly higher (
 was 2% ± 4% higher on average for the caudate, putamen, pallidum, ventral striatum, and SN) than the variability of BPND estimated by equilibrium analysis using a bolus–infusion protocol (18).
In comparison to other tracers, the TRV of 11C-(+)-PHNO VT estimates was higher than that of 11C-raclopride: m(|∆VT|) was 12% and 10% in the cerebellum and caudate/putamen for 11C-(+)-PHNO versus 9% for 11C-raclopride (19). Similarly, the TRV of 11C-(+)-PHNO BPND was higher than that of 11C-raclopride: m(|∆BPND|) of 9% for 11C-(+)-PHNO in the caudate/putamen versus only 4%–6% for 11C-raclopride (20).
Compared with other D2R/D3R agonist radioligands, the TRV of 11C-(+)-PHNO was also greater than that for 11C-NPA, where m(|∆VT|) was 6%–9% and m(|∆BPND|) was 4%–10%, depending on the region (21). Compared with 11C-MNPA (22), 11C-(+)-PHNO m(|∆BPND|) was higher in the putamen (9% vs. 5%) and lower in the caudate (8% vs. 12%).
Parametric images were computed using SRTM and SRTM2 with a basis-function approach. Because of the relatively rapid kinetics of 11C-(+)-PHNO, it was possible to obtain low-noise parametric images with both methods without spatial smoothing by restricting the range of the basis functions (restricting k2 to be > 0.01 min−1). Indeed, the basis functions used in the SRTM model are of the form  , where
  is the reference region time–activity curve. We chose to limit the k2 values based on results of ROI time–activity curve analyses with SRTM2. Because of this restriction, SRTM parametric BPND images had relatively low noise, and the simplified model, SRTM2, mostly improved flow images (R1) and BPND images outside the main ROIs.
In this T-R study, we intentionally included subjects who were not HCs. Including such subjects helped to ensure that the selected methods are applicable without major increases in TRV in subjects who may have atypical binding, because either higher or lower BPND in some regions can have an impact on the variability of the measures. On average, across all ROIs, the ratio of m(|∆BPND|) in CD subjects and in HCs was 1.02, indicating that there was no global difference in variability between the 2 groups. The inclusion of noncontrol subjects can, however, have a bigger impact on ICC than TRV, because the ICC value is sensitive, by design, to the variability across subjects, which may be increased by including noncontrol subjects. This sensitivity of ICC to the study population does not prevent its use as a criterion to compare quantification methods but can be an issue when comparing results between studies on different populations (by diagnosis, age, or other demographic criteria influencing binding).
CONCLUSION
The TRV of 11C-(+)-PHNO binding potential was 9% in the caudate and putamen, which is good, though higher than that of the leading antagonist, 11C-raclopride, and other available agonists, including 11C-NPA and 11C-MNPA. Parametric images of 11C-(+)-PHNO can be computed with low noise using both SRTM and SRTM2.
DISCLOSURE
The costs of publication of this article were defrayed in part by the payment of page charges. Therefore, and solely to indicate this fact, this article is hereby marked “advertisement” in accordance with 18 USC section 1734. This work was supported by a NARSAD Young Investigator Award grant (M132018), the National Institute on Drug Abuse (NIDA) (K24 DA017899; 1R03DA027456-01), the National Institute of Mental Health (NIMH; T32 MH019961), Yale PET Center and YCCI Pilot Projects Utilizing Core Technologies, and the Department of Mental Health and Addiction Services (DMHAS) of the State of Connecticut. This publication was also made possible by CTSA grant UL1 RR024139 from the National Center for Research Resources (NCRR) and the National Center for Advancing Translational Science (NCATS), components of the National Institutes of Health (NIH). Its contents are solely the responsibility of the authors and do not necessarily represent the official view of NIH. No other potential conflict of interest relevant to this article was reported.
Acknowledgments
We thank the staff of the Clinical Neuroscience Research Unit (CNRU) at Connecticut Mental Health Center (CMHC).
Footnotes
Published online Apr. 14, 2014.
- © 2014 by the Society of Nuclear Medicine and Molecular Imaging, Inc.
REFERENCES
- Received for publication September 27, 2013.
- Accepted for publication January 21, 2014.


Jump to section
Related Articles
Cited By...
- Translational Evidence for Dopaminergic Rewiring of the Basal Ganglia in Persons with Schizophrenia
- Dopaminergic organization of striatum is linked to cortical activity and brain expression of genes associated with psychiatric illness
- First-in-Human Assessment of 11C-LSN3172176, an M1 Muscarinic Acetylcholine Receptor PET Radiotracer
- First-in-Human Assessment of the Novel PDE2A PET Radiotracer 18F-PF-05270430
- Imaging synaptic density in the living human brain