


Abstract
Epidermal growth factor receptor (EGFR) expression is upregulated in many types of tumors, and the EGFR tyrosine kinase inhibitor gefitinib has high potential as an anticancer drug. However, accumulating clinical evidence has indicated that only a subset of patients benefit from gefitinib treatment. This study aimed to determine whether optical imaging of vascular endothelial growth factor (VEGF) expression can be an early biomarker for tumor response to gefitinib therapy. Methods: A VEGF-targeting fluorescent probe Dye-BevF(ab′)2 was prepared and tested in vivo. Longitudinal optical imaging studies using Dye-BevF(ab′)2 were performed in both 22B (gefitinib-resistant) and A549 (gefitinib-responsive) tumor models at different times (days 0, 2, and 5) before and after gefitinib treatment. The imaging results were validated by ex vivo immunofluorescence staining and enzyme-linked immunosorbent assay. Results: Dye-BevF(ab′)2 exhibited high specificity for VEGF in vivo. There was no significant change in the Dye-BevF(ab′)2 uptake in gefitinib-treated 22B tumors, compared with the control group. In contrast, the A549 tumor uptake of Dye-BevF(ab′)2 in the gefitinib-treated group was significantly lower on days 2 and 5 than that in the control group and at the baseline. An in vivo gefitinib treatment study confirmed that 22B tumors were gefitinib-resistant, whereas A549 tumors were gefitinib-responsive. Immunofluorescence staining and enzyme-linked immunosorbent assay confirmed that changes in the Dye-BevF(ab′)2 uptake were correlated with VEGF expression levels in tumors. Conclusion: Optical imaging of VEGF expression with Dye-BevF(ab′)2 can be used for the early assessment of tumor response to gefitinib therapy. This approach may also be valuable for preclinical high-throughput screening of novel antiangiogenic drugs.
Epidermal growth factor receptor (EGFR), a member of the ErbB family of receptor tyrosine kinases, is overexpressed in various human epithelial malignancies (1). EGFR activation mediates several processes that are critical to tumor formation and progression, including proliferation, migration, invasion, and angiogenesis. The upregulation of EGFR expression in tumors is usually associated with poor prognosis (2). In recent years, several EGFR inhibitors have been developed to interfere with EGFR-mediated signaling, thereby inhibiting tumor progression (3,4). The 2 most widely used approaches to date involve monoclonal antibodies directed against the extracellular domain of EGFR and small-molecule compounds (tyrosine kinase inhibitors) that interfere with intracellular EGFR tyrosine kinase activity. Gefitinib (ZD1839, Iressa; AstraZeneca/Teva) is an EGFR tyrosine kinase inhibitor that received Food and Drug Administration approval in 2003 for the treatment of non–small cell lung cancer. Although clinical results for gefitinib are promising, most studies indicate that only a subset of patients benefit from gefitinib treatment, with a significant majority exhibiting intrinsic or acquired resistance to the drug (3,4). Therefore, a diagnostic tool that allows early assessment of tumor response is crucial for optimizing gefitinib use in cancer patients.
The antitumorigenic effects of gefitinib are mediated, in part, by the inhibition of tumor angiogenesis (5). It was also reported that gefitinib can inhibit the growth of human umbilical vein endothelial cells, a frequently used in vitro model for human endothelial cells (6). Angiogenesis is an essential step for tumor development and metastasis. Vascular endothelial growth factor (VEGF), a member of the growth factor family, plays a central role in tumor angiogenesis. VEGF binding to cognate receptors stimulates tumor cell proliferation and migration, inhibits apoptosis, and regulates the permeability of vascular endothelial cells (7). EGFR and VEGF share a common downstream signaling pathway (8); VEGF is a transcriptional target of EGF (9), the EGFR ligand, and blocking EGFR with gefitinib reduces VEGF expression (10,11). Therefore, the quantification of VEGF expression may serve as an early biomarker of tumor response to gefitinib.
Molecular imaging techniques such as PET, SPECT, molecular MR imaging, and optical imaging offer noninvasive means of visualizing and quantifying in vivo cellular and molecular processes (12). Molecular imaging has many potential clinical applications in terms of early detection of diseases, patient stratification, and treatment monitoring. Optical imaging has the advantages of nonrequirement of ionizing radiation, low cost, and easily generated optical imaging probes. The current study aimed to develop an optical imaging platform for the preclinical molecular imaging of cancer responses to therapy. A VEGF-targeted optical imaging probe was designed and tested in gefitinib-responsive and gefitinib-resistant tumor models to assess whether optical imaging of VEGF expression could be a biomarker for tumor early response to gefitinib therapy.
MATERIALS AND METHODS
Preparation of F(ab′)2 Fragment and DyLight 680-F(ab′)2 Conjugate
The F(ab′)2 fragment of bevacizumab (Avastin; Roche), an anti-VEGF monoclonal antibody, was obtained by digesting bevacizumab using a F(ab′)2 preparation kit (Pierce). The product denoted as BevF(ab′)2 was confirmed by sodium dodecyl sulfate polyacrylamide gel electrophoresis. The concentration of BevF(ab′)2 was determined using a microbicinchoninic acid protein assay kit (Pierce). The immunoreactivity of BevF(ab′)2 was determined using a competition binding assay as described in the supplemental materials and methods (available at http://jnm.snmjournals.org).
BevF(ab′)2 was conjugated with a DyLight 680-NHS ester (Pierce) according to a standard protocol. Briefly, DyLight 680-NHS (10 mg/mL in N,N-dimethylformamide) was added to BevF(ab′)2 in bicarbonate buffer (pH 9.0) at a 7:1 molar ratio. After incubation for 1 h, the DyLight 680-BevF(ab′)2 conjugate denoted as Dye-BevF(ab′)2 was purified using a PD-10 desalting column (GE Healthcare). The degree of labeling (dye-to-protein ratio) for DyLight 680-BevF(ab′)2 was calculated as approximately 3.1 based on ultraviolet measurements.
Cell Culture and Animal Models
Human umbilical vein endothelial cells were isolated and cultured as previously described (13). UM-SCC-22B (22B) human head and neck squamous carcinoma cells and A549 human non–small cell lung cancer cells were grown in high glucose Dulbecco modified Eagle medium supplemented with 10% fetal bovine serum at 37°C in humidified atmosphere containing 5% CO2.
All animal experiments were performed in accordance with the Guidelines of Peking University Animal Care and Use Committee. To establish the 22B and A549 subcutaneous tumor models, tumor cells (5 × 10⁶) were inoculated subcutaneously into the right front flanks of female BALB/c nude mice. The tumor growth was measured using a caliper, and the tumor volume was calculated using the formula volume = length × width2/2.
Enzyme-Linked Immunosorbent Assay (ELISA)
22B and A549 tumor cells grown in 12-well plates were incubated with or without 1 μM gefitinib at 37°C. After 0, 2, 8, and 24 h, the cell culture supernatants were collected and centrifuged to remove any cell remnants. The supernatants were stored at −20°C until the VEGF levels were determined using a human VEGF ELISA kit (CoWin Bioscience Co.). Tumor cells in the plates were trypsinized, stained with trypan blue, and counted; values obtained from ELISA were normalized to the number of live (trypan blue–negative) cells.
For in vivo studies, frozen 22B or A549 tumor tissues were homogenized and lysed using a T-PER tissue protein extraction buffer (Pierce). VEGF levels were determined by ELISA as described above and normalized to the protein concentration measured using the microbicinchoninic acid protein assay kit.
In Vivo Gefitinib Treatment Protocol
22B and A549 tumor–bearing nude mice with tumors approximately 200 mm3 were chosen for in vivo treatment studies. For longitudinal small-animal optical imaging experiments, mice (n = 5 per group) received daily intraperitoneal injections of gefitinib (80 mg/kg in 50 μL of dimethyl sulfoxide [DMSO]) or DMSO (vehicle control) starting immediately after the baseline optical scan (day 0) and for the next 5 d. Mice underwent additional optical scans on days 2 and 5.
In a second study, groups of 10–12 tumor-bearing mice received daily intraperitoneal injections of gefitinib or DMSO under the conditions described above to observe the effects of gefitinib on tumor growth. Tumor sizes were measured every other day. On day 5, 5 mice from each group were sacrificed, and the tumors were harvested. Half of the samples were immediately frozen in optimal-cutting-temperature medium (Sakura Finetek) and then cut into 5-μm-thick slices for immunofluorescence staining. The remaining tumor samples were stored at −80°C until the VEGF levels were determined using the human VEGF ELISA kit as described above.
In Vivo Optical Imaging
To evaluate the in vivo distribution of Dye-BevF(ab′)2, A549 tumor–bearing mice (n = 5 per group) were injected with 0.5 nmol of Dye-BevF(ab′)2 through the tail vein. At 1, 2, 4, 24, and 48 h after injection, mice were anesthetized by inhalation of 2% isoflurane in oxygen and then subjected to optical imaging using an IVIS small-animal imaging system (Xenogen) with excitation and emission wavelengths of 675 and 720 nm, respectively. For each scan, an aliquot of probe with 1/20 of the injected dose was simultaneously imaged. Identical illumination settings were used for all scans. Fluorescence emission was normalized to photons per second per centimeter squared per steradian (p/s/cm2/sr) (14). To quantify Dye-BevF(ab′)2 uptake, the region of interest was drawn for each tumor or contralateral normal tissue using Living Image software (Xenogen). Results were expressed as percentage of fluorescence intensity by normalizing uptake values (p/s/cm2/sr) to total injection dose. For the blocking study, 5 mice were injected with 0.5 nmol of Dye-BevF(ab′)2 mixed with 1 mg of bevacizumab and then optical-imaged at 4 h after injection under the same conditions.
Longitudinal optical imaging (days 0, 2, and 5) of tumor response to gefitinib or DMSO was performed in both 22B and A549 tumor models. For each experiment, mice were injected with 0.5 nmol of Dye-BevF(ab′)2 and then imaged at 4 h after injection.
Immunofluorescence Staining
Immunofluorescence staining was performed on day 5 to examine the expression levels of VEGF, CD31, and Ki67 in vehicle- or gefitinib-treated tumor tissue samples. Fluorescein isothiocyanate (FITC)-bevacizumab was synthesized by conjugating the VEGF-specific antibody bevacizumab with FITC-NHS (Pierce) using a previously described method (15). Detailed procedures are described in the supplemental materials and methods.
Statistical Analysis
Quantitative data were expressed as mean ± SD. Means were compared using 1-way ANOVA and Student t test. P values of less than 0.05 were considered statistically significant.
RESULTS
In Vitro Studies
The immunoreactivity of BevF(ab′)2 was compared with that of intact bevacizumab with the competition binding assay. The best-fit 50% inhibitory concentration (IC50) values for bevacizumab and BevF(ab′)2 were (2.57 ± 0.19) × 10−10 and (2.84 ± 0.33) × 10−10 M (Supplemental Fig. 1), respectively, suggesting that the VEGF binding affinity of BevF(ab′)2 was similar to that of intact IgG.
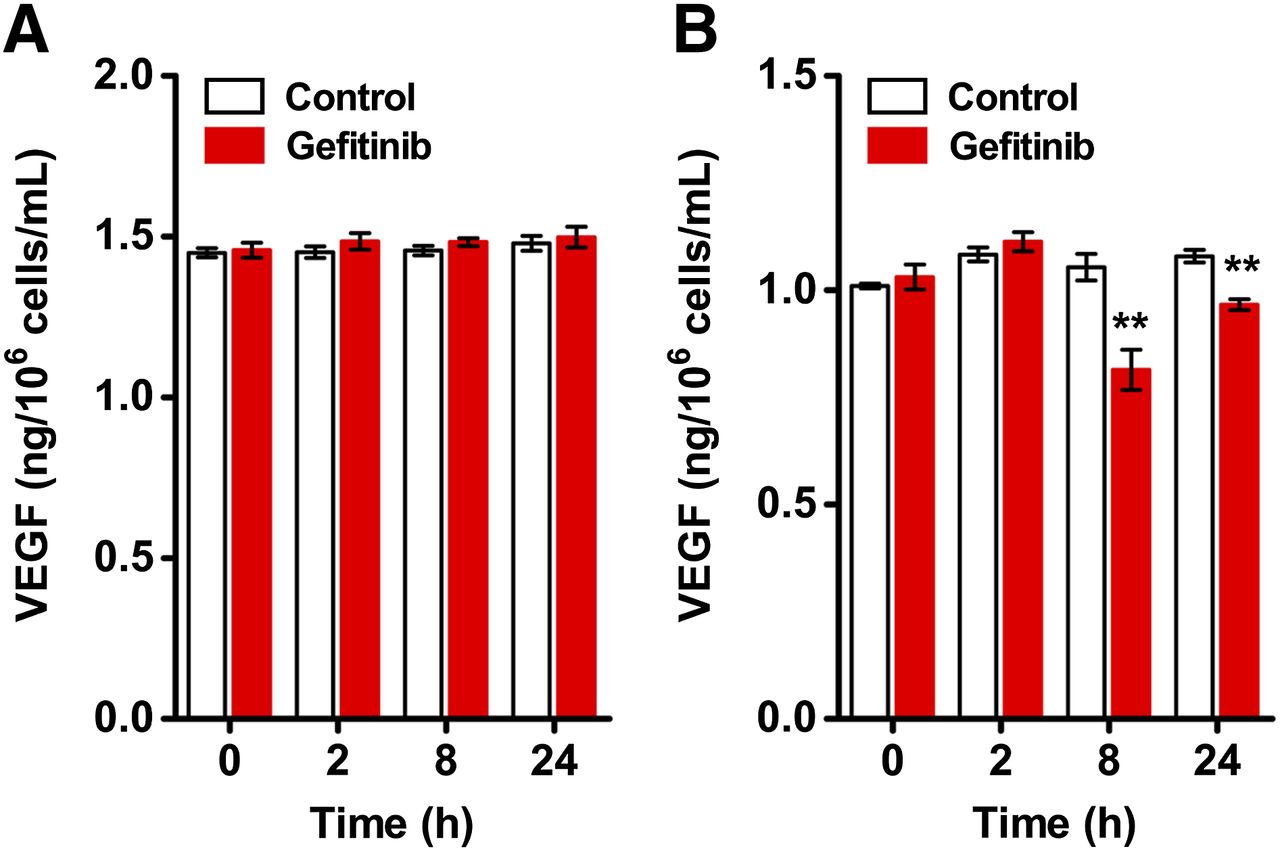
ELISA was performed to assess VEGF expression in 22B and A549 cells after gefitinib treatment. The level of secreted VEGF in the culture medium remained constant (e.g., 1.48 ± 0.02 vs. 1.50 ± 0.03 ng/106 cells/mL at 24 h, n = 6; P > 0.05) for 22B cells at all time points (Fig. 1A). In contrast, VEGF level was reduced by gefitinib treatment at 8 h (from 1.05 ± 0.03 to 0.81 ± 0.05 ng/106 cells/mL, n = 6; P < 0.01) and 24 h (from 1.08 ± 0.01 to 0.97 ± 0.01 ng/106 cells/mL, n = 6; P < 0.01) for A549 cells (Fig. 1B).

Quantification of VEGF expression in tumor cells by ELISA. VEGF levels in cell culture supernatants of 22B (A) and A549 (B) cells were evaluated at 0, 2, 8, and 24 h with or without 1 μM gefitinib treatment (n = 6). **P < 0.01.
In Vivo Optical Imaging of Dye-BevF(ab′)2
The in vivo tumor-targeting efficiency of Dye-BevF(ab′)2 was evaluated in the A549 tumor model. The tumor uptake of Dye-BevF(ab′)2 was highest at 2 h after injection (3.18% ± 0.72%) and decreased with time (Supplemental Figs. 2A and 2B). The tumor–to–normal tissue ratio of Dye-BevF(ab′)2 increased from 1 to 4 h before declining (Supplemental Fig. 2C). Coinjection of a blocking dose of bevacizumab significantly reduced the Dye-BevF(ab′)2 signal in tumors (Supplemental Fig. 2D), demonstrating the specificity of the probe.
Longitudinal imaging studies were conducted in 22B and A549 tumor–bearing mice undergoing gefitinib treatment. Optical scans were acquired on days 0, 2, and 5; the representative images are shown in Figure 2. In the 22B tumor model, no difference in Dye-BevF(ab′)2 uptake was observed between gefitinib-treated and vehicle-treated tumors (Figs. 2A and 2B). In contrast, signal intensity in A549 tumors decreased over time in the gefitinib treatment group relative to controls as indicated by a lower value for percentage tumor uptake (1.32% ± 0.51% vs. 2.40% ± 0.40%, P < 0.05, and 0.87% ± 0.48% vs. 2.23% ± 0.23%, P < 0.001, on days 2 and 5, respectively; Figs. 2C and 2D).
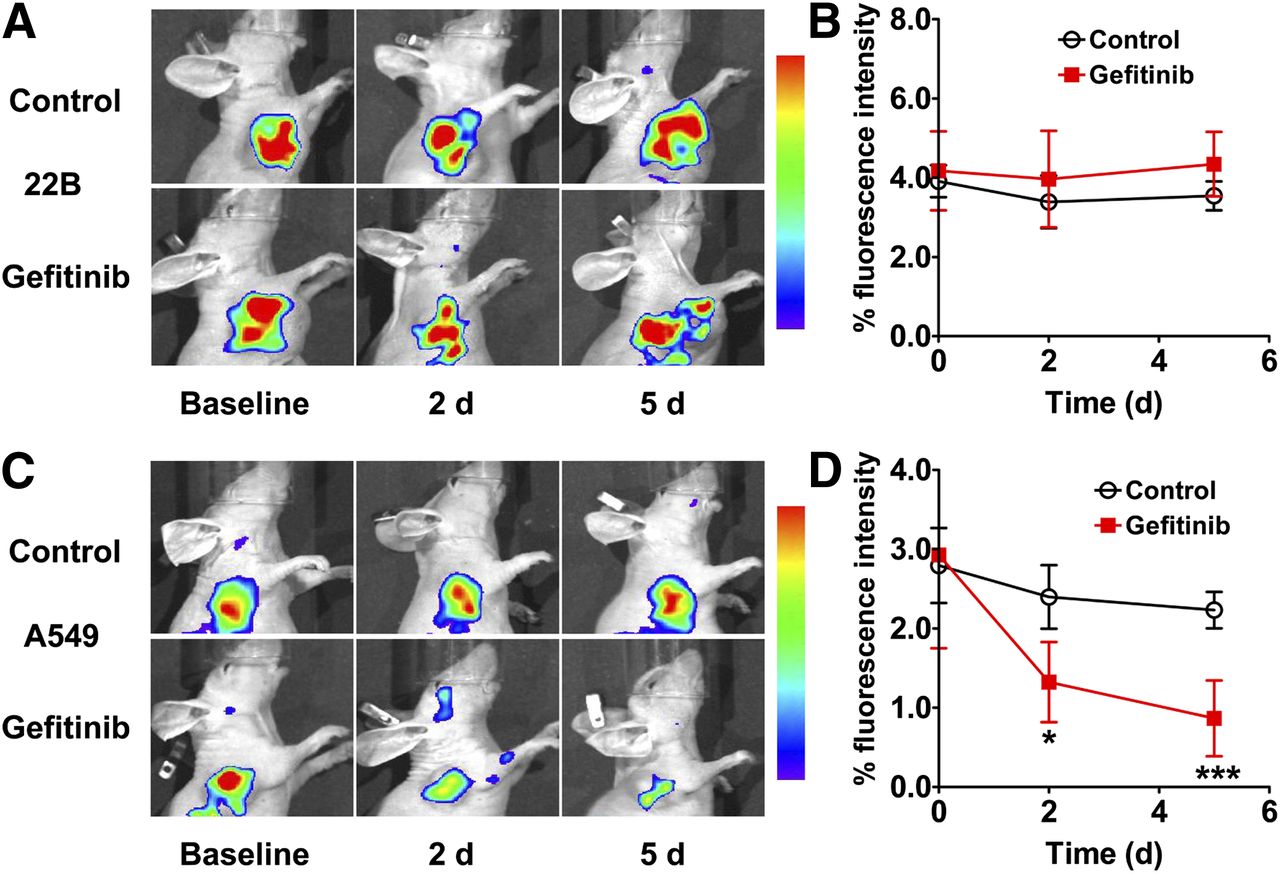
(A and C) In vivo optical imaging of 22B (A) and A549 (C) tumor–bearing mice at 4 h after intravenous injection of 0.5 nmol of Dye-BevF(ab′)2 on days 0, 2, and 5 after initiation of gefitinib treatment (80 mg/kg). (B and D) Quantified 22B (B) and A549 (D) tumor uptake from A and C (n = 5). *P < 0.05. ***P < 0.001.
VEGF Expression in Tumor Tissues
To validate the results obtained in the longitudinal optical imaging experiment, immunofluorescence staining and ELISA were performed on day 5 to determine VEGF expression levels in vehicle- or gefitinib-treated tumors. As shown in Figures 3A and 3C, both 22B and A549 tumors in the DMSO-treated animals showed high FITC-bevacizumab immunoreactivity. An excess of unlabeled bevacizumab blocked the FITC-bevacizumab signal, indicating the occurrence of specific VEGF expression. FITC-bevacizumab labeling in 22B tumor tissues was unaltered by gefitinib treatment, whereas the signal was significantly reduced in gefitinib-treated A549 tissues. Consistent with these observations, quantification of VEGF expression levels by ELISA showed that in 22B tumors, VEGF levels were similar between control and gefitinib treatment groups (0.89 ± 0.23 vs. 1.03 ± 0.05 pg/μg of protein, P > 0.05; Fig. 3B), whereas in A549 tumors, the expression was reduced by gefitinib treatment (0.41 ± 0.02 vs. 0.23 ± 0.04 pg/μg of protein, P < 0.01; Fig. 3D).
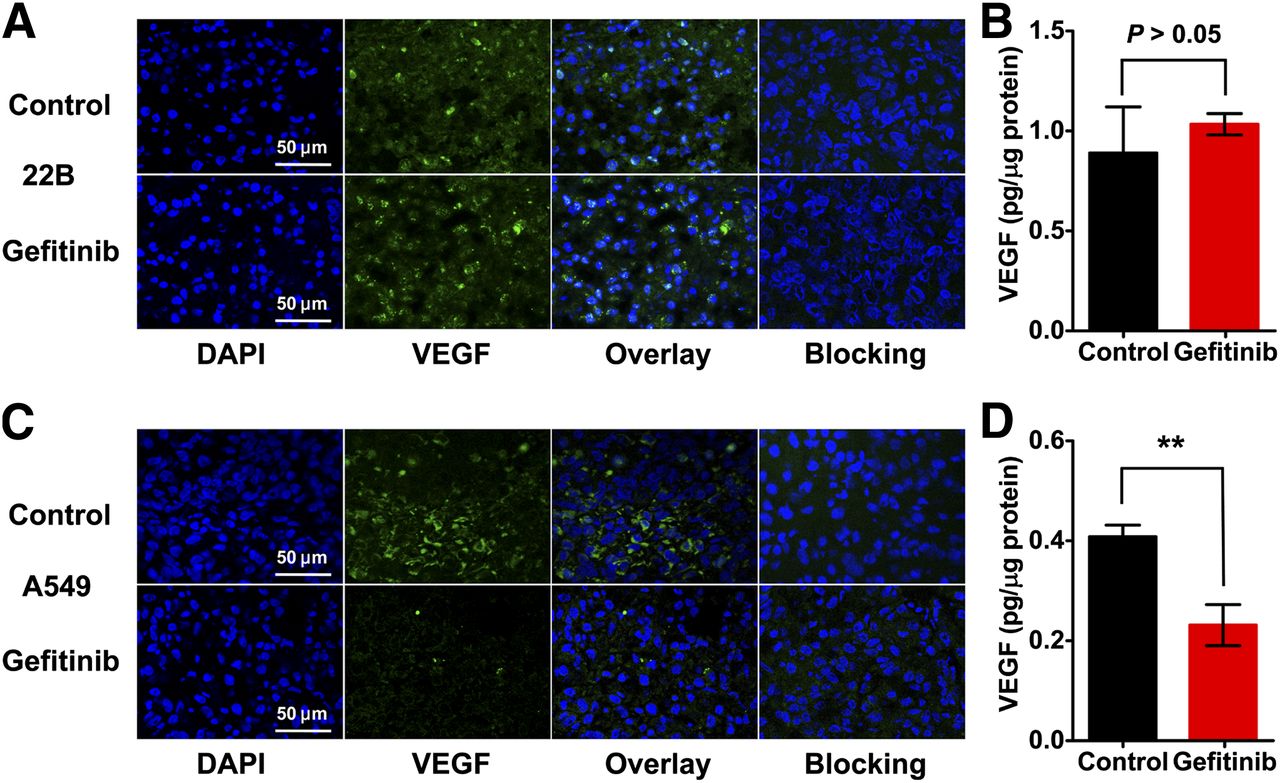
VEGF expression in vehicle (control) or gefitinib-treated tumors as determined by immunofluorescence staining and ELISA. (A and C) Immunofluorescence staining of VEGF in 22B (A) and A549 (C) tumor tissues using FITC-bevacizumab (with or without blocking using unlabeled bevacizumab). (B and D) VEGF expression levels in 22B (B) and A549 (D) tumor lysates as determined by ELISA (n = 5). **P < 0.01.
In Vivo Treatment Efficacy of Gefitinib
The antitumorigenic effects of gefitinib were investigated in both 22B and A549 models (5–7 mice per group). After several rounds of gefitinib treatment, there was no observable effect on proliferation in the 22B tumors (Fig. 4A). In contrast, treatment with gefitinib caused a reduction in A549 tumor size starting from day 4, with a significant difference observed from day 14 (P < 0.001; Fig. 4B).

Antitumorigenic effects of gefitinib treatment. Growth curves of 22B (A) and A549 (B) tumors in nude mice after intraperitoneal administration of 6 doses of gefitinib (80 mg/kg in 50 μL daily) or DMSO (control; 50 μL daily) (n = 5–7). **P < 0.01. ***P < 0.001.
After 6 rounds of gefitinib therapy, 22B and A549 tumors were harvested for immunofluorescence staining. Tissue sections were stained for CD31 and Ki67 to evaluate tumor vasculature and tumor cell proliferation, respectively. There were no differences in CD31 and Ki67 expression in the 22B tumors, followed by the gefitinib treatment regimen (Fig. 5A). However, CD31 and Ki67 fluorescence signals were decreased in the gefitinib-treated A549 tumors, compared with vehicle-treated control tumors (Fig. 5B). A quantification of microvascular density based on CD31 staining revealed a significant reduction in A549 (P < 0.001; Supplemental Fig. 3B) but not 22B (P > 0.05; Supplemental Fig. 3A) tumors on treatment with gefitinib.

CD31 and Ki67 staining of vehicle (control) or gefitinib-treated 22B (A) and A549 (B) tumor tissues.
DISCUSSION
The present study evaluated the feasibility of optical imaging of VEGF expression as a noninvasive tool to monitor tumor responses to gefitinib treatment. For this purpose, the BevF(ab′)2 probe targeting VEGF was designed using the F(ab′)2 fragment of the anti-VEGF antibody bevacizumab. Bevacizumab has been labeled with various radioisotopes for PET and SPECT imaging of VEGF expression (16–20). One limitation of using intact antibodies for molecular imaging is the long half-life and propensity to accumulate in the liver due to a high molecular weight (21,22). The F(ab′)2 fragment of IgG retains antigen-binding domains but has a lower molecular weight, allowing more rapid blood clearance and thereby increasing tumor–to–normal tissue contrast. Moreover, the removal of the Fc fragment reduces nonspecific binding to Fc receptors (23,24). The competition binding assay demonstrated that the VEGF binding affinity of BevF(ab′)2 is comparable to that of intact IgG (Supplemental Fig. 1).
In vitro changes in VEGF expression after gefitinib treatment were investigated in 2 tumor cell lines (22B and A549). There was little change in VEGF expression in 22B cells on gefitinib treatment, whereas the level decreased in A549 cells (Fig. 1). On the basis of these data, we speculated that dye-labeled BevF(ab′)2 can be used in vivo to monitor the dynamic expression of VEGF on gefitinib treatment in 22B and A549 tumor models. To test this, Dye-BevF(ab′)2 was evaluated in vivo for VEGF targeting. Although the highest tumor uptake of Dye-BevF(ab′)2 was observed at 2 h after injection, a high background signal was also present. An optimal signal-to-background ratio was observed at 4 h after injection after clearance of the probe from normal tissues (Supplemental Fig. 2C). Therefore, subsequent longitudinal optical imaging experiments were performed at 4 h after injection. A blocking experiment using an excess of bevacizumab confirmed the in vivo specificity of Dye-BevF(ab′)2 for the target VEGF (Supplemental Fig. 2D).
Several PET radiotracers have been used for longitudinal imaging of tumor responses to drugs (25–27). A significant advantage of optical probes is their stability, which eliminates the need for preparing fresh probe before each scan. The synthesis of most PET radiotracers is time-consuming and labor-intensive, and specific activity can differ between batches, introducing experimental variability. Optical probes are ideal for longitudinal imaging because they can be easily prepared and stored for long-term use.
It is generally acknowledged that the expression level of wild-type EGFR does not predict tumor response to gefitinib treatment (28–30); rather, EGFR mutations and copy number of EGFR or human epidermal growth factor receptor 2 genes as determined from biopsy, cytologic, or peripheral blood specimens have high predictive value (31–34). Longitudinal optical imaging using Dye-BevF(ab′)2 offers several advantages over these traditional approaches. First, Dye-BevF(ab′)2 optical imaging is noninvasive. Second, it can provide whole-body information and allows a quantitative assessment of VEGF expression in tumors in real time. Gefitinib not only decreased VEGF expression in tumor cells (Fig. 1B) but also directly inhibited endothelial cell growth in vitro (Supplemental Fig. 4). In an in vivo corneal neovascularization mouse model, gefitinib showed significant antiangiogenic activity in endothelial cells of neovasculature, which was partly attributable to direct inhibition of EGFR activation (5,35). In the present study, gefitinib treatment led to reduced tumor vascularization and VEGF expression in responsive (A549) but not resistant (22B) tumors. These data demonstrated that monitoring the expression of the angiogenic biomarker VEGF using Dye-BevF(ab′)2 optical imaging can be applied to the early assessment of tumor response to gefitinib therapy.
The longitudinal scans showed little change in Dye-BevF(ab′)2 uptake by 22B tumors after 6 doses of gefitinib, consistent with the gefitinib-resistant properties of this tumor (Fig. 4A). In contrast, in the A549 tumors, the Dye-BevF(ab′)2 uptake decreased on day 2, 12 d before a statistical difference in tumor size between treatment and control groups was detected (i.e., on day 14, P < 0.001; Fig. 4B). Immunohistochemical staining and ELISA confirmed that changes in Dye-BevF(ab′)2 uptake reflected tumor VEGF expression levels (Fig. 3).
One caveat for using optical imaging with Dye-BevF(ab′)2 is the depth of tissue that can be resolved, particularly for the planar imaging method used in this study; therefore, its clinical application may be restricted to superficial tumors (e.g., breast cancer) or tumors accessible by laparoscopy and endoscopy. Advanced methods such as tomographic fluorescence imaging (e.g., diffuse optical and fluorescent molecular tomography) (36,37) would allow access to deep tissues, thereby broadening the applicability.
CONCLUSION
We established an optical imaging platform for monitoring tumor response to gefitinib treatment. Optical imaging of VEGF expression using the probe Dye-BevF(ab′)2 revealed the therapeutic efficacy of gefitinib in tumor models, demonstrating that Dye-BevF(ab′)2 optical imaging is a promising method for the early assessment of tumor responses. Because VEGF is a pivotal target for the development of antiangiogenic agents, optical imaging of VEGF expression with Dye-BevF(ab′)2 could be a powerful tool for high-throughput preclinical screening of novel antiangiogenic drugs.
DISCLOSURE
The costs of publication of this article were defrayed in part by the payment of page charges. Therefore, and solely to indicate fact, this article is hereby marked “advertisement” in accordance with 18 USC section 1734. This work was financially supported, in part, by the National Natural Science Foundation of China (NSFC) projects (81222019, 81125011, 30930030, 81000625, and 81201127), “973” projects (2013CB733802 and 2011CB707703), grants from the Ministry of Science and Technology of China (2011YQ030114, 2012ZX09102301, and 2012BAK25B03), grants from the Ministry of Education of China (31300 and BMU20110263), grants from the Beijing Natural Science Foundation (7132131 and 7132123), and a grant from the Beijing Nova Program (Z121107002512010). No other potential conflict of interest relevant to this article was reported.
Acknowledgments
We thank Professor Wei Kong at Peking University for kindly providing the human umbilical vein endothelial cells.
Footnotes
Published online Mar. 17, 2014.
- © 2014 by the Society of Nuclear Medicine and Molecular Imaging, Inc.
REFERENCES
- Received for publication October 8, 2013.
- Accepted for publication January 24, 2014.


