


Abstract
Imaging spontaneous cancer cell metastasis or heterogeneous tumor responses to drug treatment in vivo is difficult to achieve. The goal was to develop a new highly sensitive and reliable preclinical longitudinal in vivo imaging model for this purpose, thereby facilitating discovery and validation of anticancer therapies or molecular imaging agents. Methods: The strategy is based on breast cancer cells stably expressing the human sodium iodide symporter (NIS) fused to a red fluorescent protein, thereby permitting radionuclide and fluorescence imaging. Using whole-body nano-SPECT/CT with 99mTcO4−, we followed primary tumor growth and spontaneous metastasis in the presence or absence of etoposide treatment. NIS imaging was used to classify organs as small as individual lymph nodes (LNs) to be positive or negative for metastasis, and results were confirmed by confocal fluorescence microscopy. Etoposide treatment efficacy was proven by ex vivo anticaspase 3 staining and fluorescence microscopy. Results: In this preclinical model, we found that the NIS imaging strategy outperformed state-of-the-art 18F-FDG imaging in its ability to detect small tumors (18.5-fold-better tumor-to-blood ratio) and metastases (LN, 3.6-fold) because of improved contrast in organs close to metastatic sites (12- and 8.5-fold-lower standardized uptake value in the heart and kidney, respectively). We applied the model to assess the treatment response to the neoadjuvant etoposide and found a consistent and reliable improvement in spontaneous metastasis detection. Importantly, we also found that tumor cells in different microenvironments responded in a heterogeneous manner to etoposide treatment, which could be determined only by the NIS-based strategy and not by 18F-FDG imaging. Conclusion: We developed a new strategy for preclinical longitudinal in vivo cancer cell tracking with greater sensitivity and reliability than 18F-FDG PET and applied it to track spontaneous and distant metastasis in the presence or absence of genotoxic stress therapy. Importantly, the model provides sufficient sensitivity and dynamic range to permit the reliable assessment of heterogeneous treatment responses in various microenvironments.
Most cancer-related deaths are a consequence of the dissemination of cancer cells from the primary tumor and outgrowth at a secondary metastatic site (1). Reliable imaging of cancer cell dissemination is imperative but difficult to achieve and requires multimodal imaging approaches (2,3). However, their application to preclinical animal models of cancer cell dissemination has not yet been widely established. Small-animal radionuclide imaging techniques such as SPECT and PET offer no depth limitation, the possibility of absolute quantification (2), and resolutions of less than 1 mm for nano-SPECT (4) and less than 2 mm for nano-PET (5). Both techniques are more expensive than bioluminescence imaging but offer higher resolution and, importantly, are not affected by differential light absorption and lack of depth penetration, thereby allowing full 3-dimensional quantification (6). SPECT and PET are well suited for cell tracking in preclinical models, because imaging agents are versatile and can be introduced conveniently through direct cell labeling, tracer uptake by endogenous transport proteins, tracer binding through specific high-affinity interactions with surface molecules, or using reporter gene strategies. Frequently used examples are 18F-FDG (7) for imaging the metabolic (i.e., glucose uptake and phosphorylation) phenotype or 3′-deoxy-3′-18F-fluorothymidine (8) for imaging the proliferative (i.e., nucleoside uptake and phosphorylation) phenotype.
State-of-the-art 18F-FDG PET–based tumor imaging exploits the plasma membrane localization of glucose transporters (GLUT), which underlie enhanced glucose uptake in tumors, and subsequent tracer phosphorylation and entrapment in the cell. This imaging strategy has the advantage of generating contrast without the need of any (genetic or biochemical) modification of the cells of interest and is therefore directly usable in the clinic. However, there are limitations, for instance, other organs such as the heart and the kidneys take up 18F-FDG, affecting contrast partly due to high metabolic activity and partly to excretion. Furthermore, immune cells infiltrating a tumor can take up 18F-FDG and thereby interfere with signals from cancer cells (9). Another complication is downmodulation of GLUTs on cancer treatment (10). For example, the genotoxic neoadjuvant etoposide, a toposiomerase II inhibitor leading to apoptosis in highly proliferating cells, negatively affects GLUT activity and expression in various cancer cell types (11,12).
Alternatively, reporter gene strategies can be used for longitudinal cell tracking. Although those strategies are more limited in patients because of the need to transduce the tissues or cells of interest, they allow a plethora of applications in preclinical models of disease. Currently, there are several options for radionuclide-based reporter gene imaging (6) including herpes simplex virus type 1 (HSV1) thymidine kinase (HSV1-tk), transporters such as the human sodium symporter (NIS), the human norepinephrin transporter, and plasma membrane receptors such as the dopamine D2 receptor. NIS is a transmembrane glycoprotein mediating the active cellular concentration of iodide, driving this process via the symport of sodium ions using the sodium gradient maintained by the Na+/K+-adenosine triphosphatase (ATPase) (13). NIS can also transport other anions such as pertechnetate (TcO4−) (14) or tetrafluoroborate (15,16), allowing its exploitation in nuclear medicine for both SPECT or PET imaging. An advantage of NIS is that suitable tracers are widely available without the need for complex radiochemistry facilities. Organs with high NIS expression are the thyroid and salivary glands, the stomach, and lactating mammary glands (13). Recently, several groups successfully introduced NIS as a reporter gene to enable imaging or therapy (with 131I−) in nonthyroidal disease (17) including the use of mesenchymal stem cells for tumor targeting (18,19). NIS overexpression was also reported for several nonthyroidal cancer types including colorectal, lung, and a subset of breast cancers (13,20–24), but it remains to be determined if those NIS expression levels are sufficient and consistent enough for accurate diagnosis and therapy. NIS has also been used as a reporter gene preclinically in cardiac (25), hematopoietic (26), and neural studies (27); for tracking macrophage migration (28); and for noninvasive imaging of gene therapy vectors (29,30). It has not yet been used for cancer metastasis tracking.
In this article, we describe a new strategy for highly sensitive and reliable preclinical longitudinal in vivo imaging of spontaneous cancer cell metastasis with the goal of enhancing tumor biology studies and facilitating discovery and validation of anticancer therapies or molecular imaging agents. We apply this to a chemotherapy setting using the neoadjuvant drug etoposide and compare the efficacy of cancer metastasis detection by 18F-FDG PET imaging and NIS-based SPECT imaging. Importantly, this novel approach allows us for the first time to measure heterogeneous responses of tumor cells to the drug etoposide in various microenvironments on the whole-body level.
MATERIALS AND METHODS
The supplemental materials section (available at http://jnm.snmjournals.org) describes details of antibodies and chemicals and for cloning, generation of stable cell lines, cell culture, in vitro radionuclide tracer uptake, tumor cell implantation, and fluorescence microscopy of cells and tissues.
Animal experiments were approved by the U.K. Home Office and an Ethical Review Panel, and all requirements dictated by U.K. legislation and the above committees were met. All animals in the study were young adult (5–6 wk old) female severe combined immunodeficient (SCID)/beige mice (CB17.Cg-PrkdcscidLyst bg/Crl) obtained from Charles River (U.K.) and housed for 1 wk before tumor initiation.
In Vivo Radionuclide Imaging and Analysis of Biodistribution of Radionuclide Tracers
Mice were anesthetized with isoflurane, and 30 min after intravenous injection of 100 μL of a 99mTcO4− solution (20 MBq) mice were imaged (30-min duration scans) using a nano-SPECT/CT instrument (Bioscan) without interruption of anesthesia. The PET/CT-based protocol for 18F-FDG imaging included intravenous injection of the 18F-FDG solution (5 MBq) and identical procedures. All tracer solutions were made up in phosphate-buffered saline. If the blocking of NIS function was desired, animals were given an intraperitoneal injection of sodium perchlorate (13) solution (250 mg/kg) 30 min before tracer injection.
On the final day of experiments, we measured the biodistribution of various radionuclide tracers. Sixty minutes after intravenous injection of tracer solutions (see above), the animals were sacrificed and tissues were harvested, weighed, optimal-cutting-temperature compound–immersed, snap-frozen, and γ counted (1282 Compugamma; LKB). Standardized uptake values (SUVs) were calculated according to Equation 1. Eq. 1
Eq. 1
Neoadjuvant Chemotherapy Response Assessment
The experimental schedules for the neoadjuvant chemotherapy experiments comparing the various imaging methods or tracers in etoposide-treated with untreated animals are outlined in the figure schematics. For assessing the chemotherapy response, a first SPECT/CT scan (99mTcO4−) was obtained on day 9 after tumor inoculation, and animals were split into 2 cohorts on day 10 after tumor inoculation. One cohort was treated with etoposide (67 mg/kg) (31) and the other with vehicle. On day 17, both cohorts were imaged with SPECT/CT (99mTcO4−) before a second dose of etoposide (67 mg/kg) or vehicle was administered. On day 19, both cohorts were subjected to PET/CT (18F-FDG) imaging. If positive signals in the SPECT/CT scan from day 17 were seen, the corresponding areas were biopsied after the animals were sacrificed at the end of the experiment (day 19); to check for false-negatives, we also harvested lymph nodes (LNs) that were not seen in the SPECT/CT scan from day 17. For the experiment documenting heterogeneous treatment response only, the SPECT/CT scans at day 17 were obtained with both treatment groups. On the final day of the experiment, either 99mTcO4− or 18F-FDG was injected into animals, and animals were sacrificed 45 min later and organs treated as described above.
Statistics
Student t tests were used to calculate P values, unless otherwise indicated, using Prism software (GraphPad). Numbers in the text indicate means of pooled data ± SD unless otherwise stated.
RESULTS
Generation and Characterization of Highly Metastatic Breast Adenocarcinoma Cell Lines Stably Expressing NIS
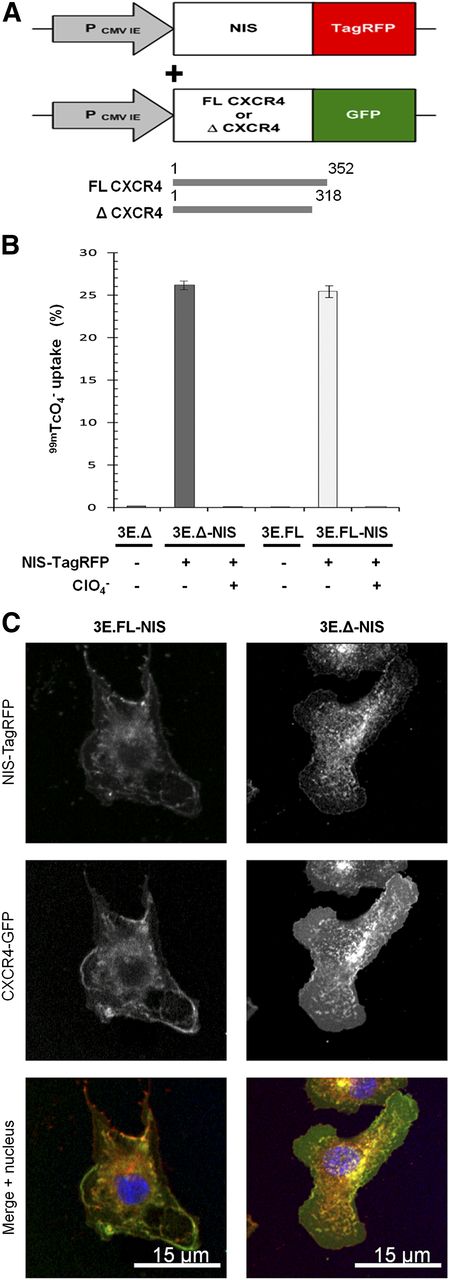
To establish a preclinical model, we chose a metastatic breast adenocarcinoma cell line (MTLn3E) and engineered it to stably and uniformly express a fusion protein made of human NIS and the red fluorescent protein TagRFP (3E.NIS; Fig. 1A) (RFP is red fluorescent protein). In addition, we confirmed correct protein localization (Supplemental Fig. 1) and function of the fusion protein, the latter by in vitro uptake of 99mTcO4− and its successful blockade by perchlorate (13). We found that the new 3E.NIS cell line had a moderately higher uptake than rat thyroid cells (1.8-fold; Supplemental Fig. 1C). We also engineered MTLn3E cells to become more metastatic by expressing the chemokine receptor CXCR4 either as wild-type or as a truncation mutant (Fig. 1A), with the latter mutation known to confer enhanced cell motility in vitro (32,33). Once stable cell lines with functional proteins had been obtained (Supplemental Fig. 1 (34,35)), we again introduced NIS-TagRFP and used fluorescence-activated cell sorting to sort all lines to equivalent NIS-TagRFP expression levels (3E.FL-NIS, 3E.Δ-NIS). NIS-TagRFP–expressing cells were significantly superior in taking up pertechnetate to cells lacking NIS-TagRFP expression (∼100-fold increase; P < 0.0001 for both cell lines), and this function was blocked by preincubation with perchlorate (∼100-fold decrease; P < 0.0001 for both cell lines) (Fig. 1B). The correct localization of both membrane proteins was shown by confocal microscopy (Fig. 1C). Using cell pellets consisting of varying amounts of NIS-expressing and non–NIS-expressing cells—while keeping the total cell number constant—we determined the detection limit of those cells in the nano-SPECT/CT scanner to be approximately 1,000 cells (Supplemental Fig. 2), sufficient for SPECT/CT-based metastasis imaging.

Generation of highly invasive mammary carcinoma cell lines stably expressing NIS-TagRFP and CXCR4-GFP variants. (A) Retroviral constructs for human NIS-TagRFP (left) and wild-type (FL) or truncated (Δ) CXCR4-GFP (right). (B) NIS-TagRFP function was measured by 99mTcO4− uptake and compared with cell lines not expressing NIS-TagRFP. Perchlorate inhibition was used to demonstrate uptake specificity. Error bars represent SD; n = 3. (C) Representative confocal micrographs of double-stable cell lines showing expected plasma membrane localization of both fusion proteins.
NIS Imaging Outperforms Metabolic Imaging in This Preclinical Tumor Model
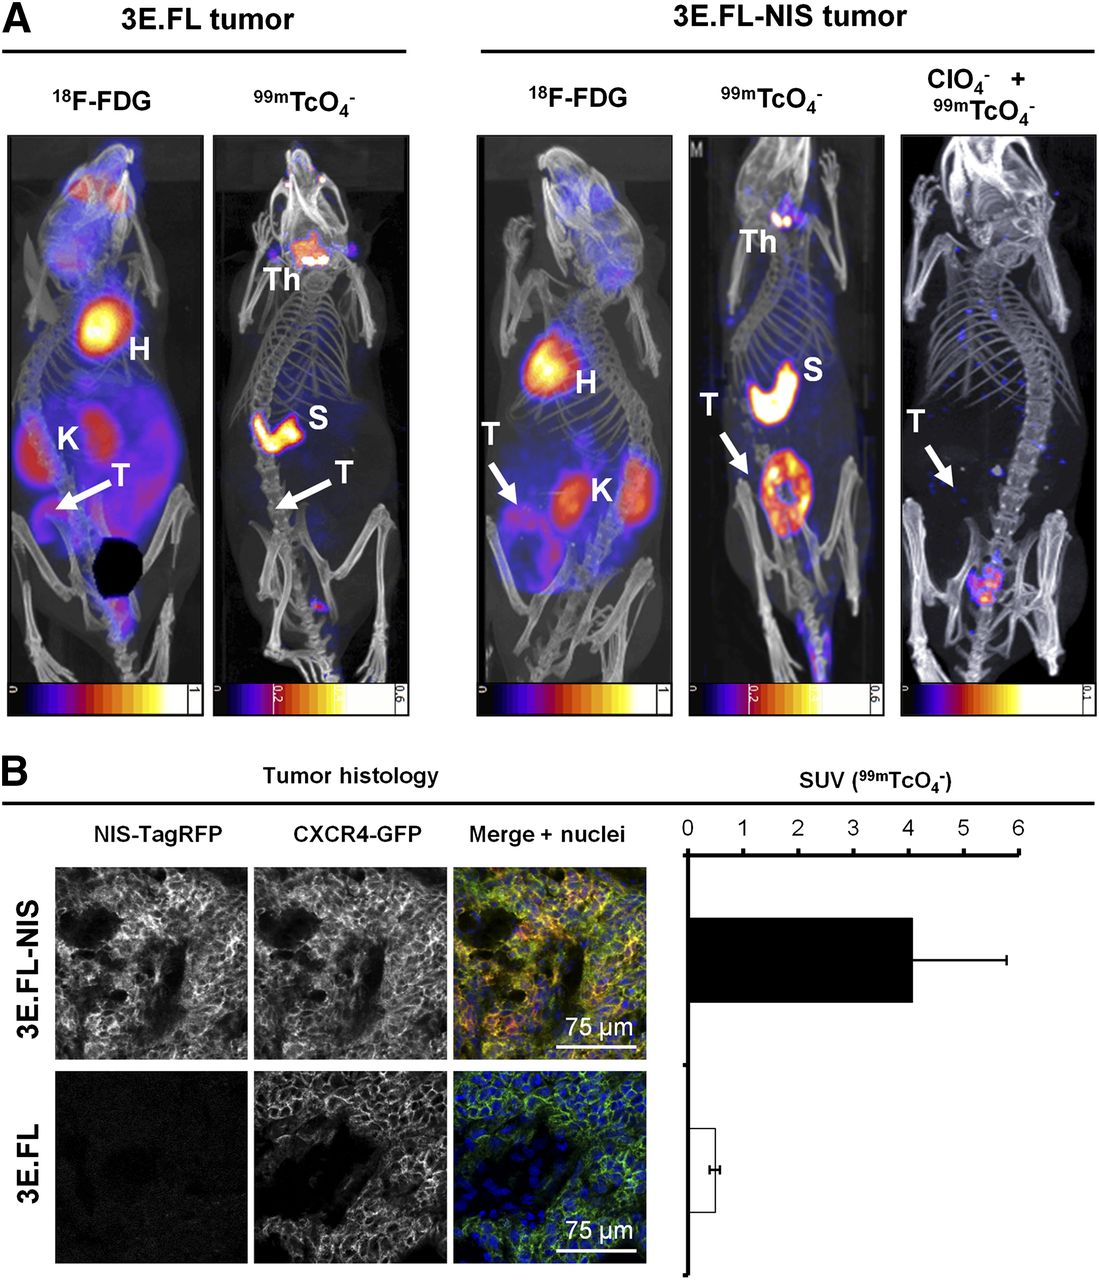
We established a preclinical mammary tumor model by subcutaneously injecting either 3E.FL or 3E.FL-NIS cells into the mammary fat pads of young adult female SCID/beige mice. Four weeks after injection, animals were first imaged with 18F-FDG, followed a day later by the NIS-specific radionuclide tracer 99mTcO4−. Primary tumors in both groups had grown to approximately 400 mm3 and frequently showed large necrotic areas in their cores as assessed by histology. Primary tumors were identified in mice by 18F-FDG imaging, albeit with significantly less contrast as compared with organs such as the heart or kidneys (Fig. 2A, left). In contrast, NIS-TagRFP–expressing FL-NIS tumors were detected on the following day, with far better contrast (Fig. 2A, right), in part because organs expressing endogenous NIS (thyroid/salivary glands and stomach (14)) were not interfering with regions of interest and expression in other tissues was negligible. Furthermore, these large tumors containing necrotic cores appear as torus-shaped objects, proving that NIS imaging is also specific to viable cells. Three days later, the same animals were scanned with 99mTcO4− after perchlorate-afforded NIS inhibition (Fig. 2A, right), proving NIS specificity in the earlier scan. Animals with NIS-negative 3E.FL tumors did not show any significant pertechnetate uptake in their tumors (Fig. 2A, left). After imaging, tumors were harvested, snap-frozen, γ counted, sectioned, and analyzed by confocal microscopy. This procedure demonstrated that 3E.FL-NIS tumors, showing significantly higher pertechnetate SUVs than 3E.FL tumors (Fig.2B, right; 4.07 ± 1.71 > 0.49 ± 0.01), expressed both FL CXCR4-green fluorescent protein (GFP) and NIS-TagRFP whereas 3E.FL tumors were devoid of the reporter protein (Fig. 2B, left).

In vivo NIS and 18F-FDG imaging of xenograft tumors established from NIS-expressing breast cancer cell lines. (A) Tumors established from 3E.FL cells expressing FL CXCR4-GFP but not NIS-TagRFP (left) or 3E.FL-NIS cells expressing FL CXCR4-GFP and NIS-TagRFP. Four weeks after tumor cell injection into mammary fat pad, tumors were first imaged by 18F-FDG PET and 1 d later by SPECT/CT using 99mTcO4−. As expected, no signals were collected by SPECT/CT in the case of 3E.FL tumors. As for 3E.FL-NIS tumors, 18F-FDG PET/CT signals were comparable to 3E.FL tumors, but SPECT/CT signals were pronounced. NIS specificity was tested in same animals 72 h later by treatment with perchlorate before repeating 99mTcO4−-afforded SPECT/CT scans. All 99mTcO4− signals (as compared with earlier image, middle) disappeared, proving successful NIS inhibition and thus NIS specificity. Images are maximum-intensity projections overlaid in CT slices. (B) Typical confocal micrographs of sections cut from primary tumors after γ counting confirming expression of FL CXCR4-GFP in both tumors but expression of NIS-TagRFP only in 3E.FL-NIS tumor (top row). Pooled 99mTcO4− SUVs of tumors from both cell lines obtained via γ counting after tissue harvesting. n = 3 animals with error bars representing SD. H = heart; K = kidney; Th = thyroid and salivary gland; S = stomach; T = primary tumor.
NIS-Expressing Tumor Cells Allow for Sensitive Detection of Metastasis In Vivo
To progress a preclinical model from tumor growth to metastasis imaging, significant metastasis must occur before the primary tumor growth exceeds the limits of its humane endpoints. Alternatively, longer term strategies involving primary tumor resection can be used but introduce an additional level of complexity (36). Therefore, we chose the first of the above options and used the highly metastatic cell line 3E.Δ-NIS, which spontaneously forms metastatic deposits at distant sites. We used 99mTcO4− SPECT/CT imaging on day 17 after tumor implantation to define cancer cell positivity in the inguinal and axillary LNs and to find additional metastases. Finally, we harvested the primary tumor, inguinal and axillary LNs, and every dissectible NIS-SPECT imaging–positive deposit; the blood, muscle, tissues, and bones; and γ-counted tissues for SUV calculation. A representative example, with the SPECT/CT image used to guide tissue harvesting (Fig. 3A), shows the animal carrying the primary tumor on its left flank with an arrow pointing toward confocal fluorescence micrographs, allowing tumor cell identification due to CXCR4-GFP and NIS-TagRFP expression (Fig. 3B, right). Organs endogenously expressing NIS—such as the thyroid and salivary glands (Fig. 3A), the stomach (Fig. 3A), and most likely the lacrimal glands, nasal mucosa, and ocular ciliar bodies (14,37)—were also detected. Furthermore, the left inguinal and axillary LNs were identified from this SPECT/CT scan to be positive for metastasis; this was confirmed by confocal microscopy of whole LN sections (Fig. 3B). In contrast, the SPECT/CT scan did not indicate metastasis in the right axillary LN, which was also affirmed by confocal microscopy (Fig. 3B). In addition, the SPECT/CT image revealed 2 sites of distant metastasis, one in the liver and another on the intestine, both of which were confirmed positive by microscopy (Fig. 3B). The 99mTcO4− biodistribution of the corresponding image-guided biopsies further support data from whole-body SPECT/CT imaging and confocal microscopy; the presence, location, and frequency of metastasis (LNs, liver, intraperitoneal) varied between mice, but SUVs of LNs and identified metastatic sites consistently had SUVs above one, indicating NIS positivity (Fig. 3C; n = 5 animals).

NIS-based metastasis model allows reliable and sensitive detection of metastasis. (A) Representative maximum-intensity-projection image (overlaid in CT slices) of a 99mTcO4− SPECT/CT scan of animal growing primary tumor established from 3E.Δ-NIS cells (19 d after orthotopic implantation). Both thyroid and salivary glands and stomach were identified because of endogenous NIS expression. Arrows originate at sites of interest and include the following objects: right axillary LN (negative for metastasis in A), left axillary LN (positive), liver metastasis (positive), metastatic nodule in peritoneal cavity (positive), left inguinal LN (positive, draining LN), and primary tumor. (B) Positivity or negativity for metastasis was determined from SPECT/CT scans, and tissues were subsequently harvested, γ counted, and sectioned; confocal microscopy confirmed classifications in all cases. LN images were obtained at low magnification to show positivity or negativity for metastasis and their respective sizes and at high magnification to show plasma membrane localization of both fusion proteins (second-level gray arrows, bottom). (C) 99mTcO4− biodistribution expressed as SUV as determined by γ counting after tissue harvesting. Pooled data (n = 4 animals) with error bars representing SEM. S = stomach; Th = thyroid and salivary glands.
Moreover, we checked whether imaging results of both radionuclide tracers (Fig. 2) were reflected in organ harvesting and γ-counting measurements. We grew tumors for 17 d and then imaged with pertechnetate by SPECT/CT to classify LNs for metastasis. On the final day, animals were randomly divided in 2 cohorts, a 99mTcO4− and an 18F-FDG group for the biodistribution experiments (Fig. 4). We found that both radionuclide tracers showed significant differences between LNs that were first identified to be positive or negative by the SPECT/CT (99mTcO4−) scan on day 17 (Fig. 4; P < 0.0001). However, in the case of 18F-FDG the SUVs for tumor and positive LNs were significantly smaller than the dominating signals from the heart and kidneys, which heavily interfered with imaging-based metastasis detection in mice (Fig. 4 and Fig. 2). 18F-FDG SUVs (±SEM) for the tumor and positive or negative LNs were 1.17 ± 0.03, 1.84 ± 0.22, and 0.74 ± 0.10, respectively, whereas SUVs for the heart and kidneys were 12.1 ± 0.5 and 6.80 ± 0.93. As a consequence of higher SUVs, metastasis to LNs was much more easily detected in NIS-based imaging (Fig. 4); corresponding SUVs for the tumor and positive and negative LNs were 10.3 ± 1.1, 3.20 ± 0.71, and 0.86 ± 0.11, respectively. Thyroid and salivary glands and the stomach also show high SUVs with pertechnetate SPECT, but these values are more similar to the values obtained for the tumor and less elevated above positive LN values as compared with the 18F-FDG situation (Fig. 4). Furthermore, these organs reside in areas that interfere less with the sites of metastasis in this model (Figs. 2 and 3), thereby contributing to a significantly improved contrast.
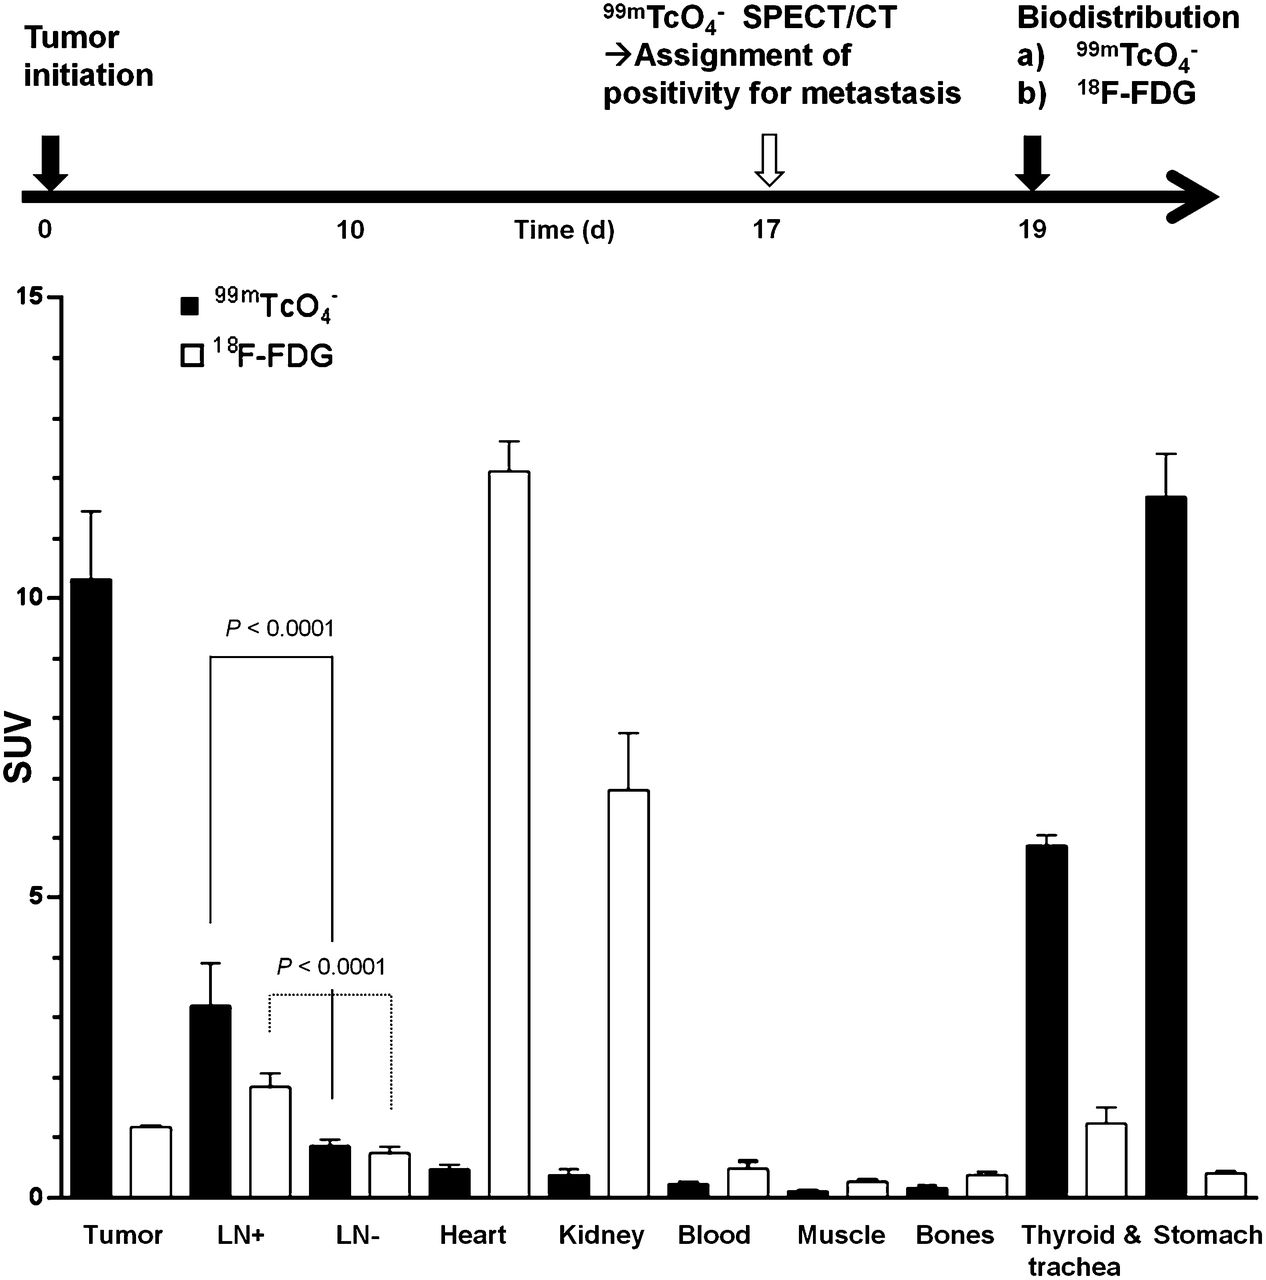
Quantitative biodistribution experiments with different radionuclide tracers. Experimental treatment and imaging schedule (top) and quantitative organ-harvesting and γ-counting measurements using radiotracers 99mTcO4− (black) and 18F-FDG (white). Pooled data (n ≥ 6 animals/group) with error bars representing SEM. LN data are pooled from all positive and negative axillary and inguinal LNs per animal (n [LN+/LN−] = 16/16 and 11/13 for 99mTcO4− and 18F-FDG, respectively). Significance was calculated using Mann–Whitney rank-sum test.
Measurement of Tumor Cell Heterogeneity After Genotoxic Stress Therapy
Because NIS imaging is unaffected by hexokinase levels, we were interested in overcoming the shortcomings of 18F-FDG in a chemotherapy setting involving the genotoxic agent etoposide (11), which was recently reported to interfere with 18F-FDG imaging (10). We established 3E.Δ-NIS tumors and grew them to palpable sizes before animals were randomly divided into treatment and control cohorts and subjected to either etoposide or vehicle, followed by longitudinal 18F-FDG– and NIS-based imaging (Fig. 5A). Etoposide administration led to a decrease of tumor volumes for 2 d after treatment (Fig. 5A), and the size of treated tumors on day 12 (15.4 ± 5.2 mm3) was significantly lower than that of control tumors (39.0 ± 3.3 mm3; P = 0.0003). During the following days, etoposide-treated tumors recovered and resumed growing until the next dose of etoposide was administered (day 17). However, tumor sizes on day 17 were still significantly smaller in the treatment group (72.6 ± 13.2 mm3) than in the control group (147.0 ± 13.8 mm3; P = 0.0001) (Fig. 5A). Three hours after administration of the second etoposide dose, we repeated SPECT/CT imaging using pertechnetate. To facilitate γ counting of harvested tissues after the final 18F-FDG PET/CT scan, we waited for a further 48 h because of the longer half-life of 99mTc (6.01 h). Although during this period tumor sizes increased in the control group (+8.1% [159.6/147.6], Fig. 5B), because of inferior contrast this did not facilitate their localization in the 18F-FDG PET image (Fig. 2). In both untreated and etoposide-treated animals (Fig. 5B), tumors were difficult to locate (control) or undetectable (etoposide). In contrast, they were always clearly identified using NIS imaging. Although in untreated animals active caspase 3 staining was minimal, there was a strong signal detected in tumor sections from etoposide-treated animals; its subcellular localization was predominantly nuclear (Fig. 5C), which is in agreement with earlier reports (38) and confirms etoposide efficacy.
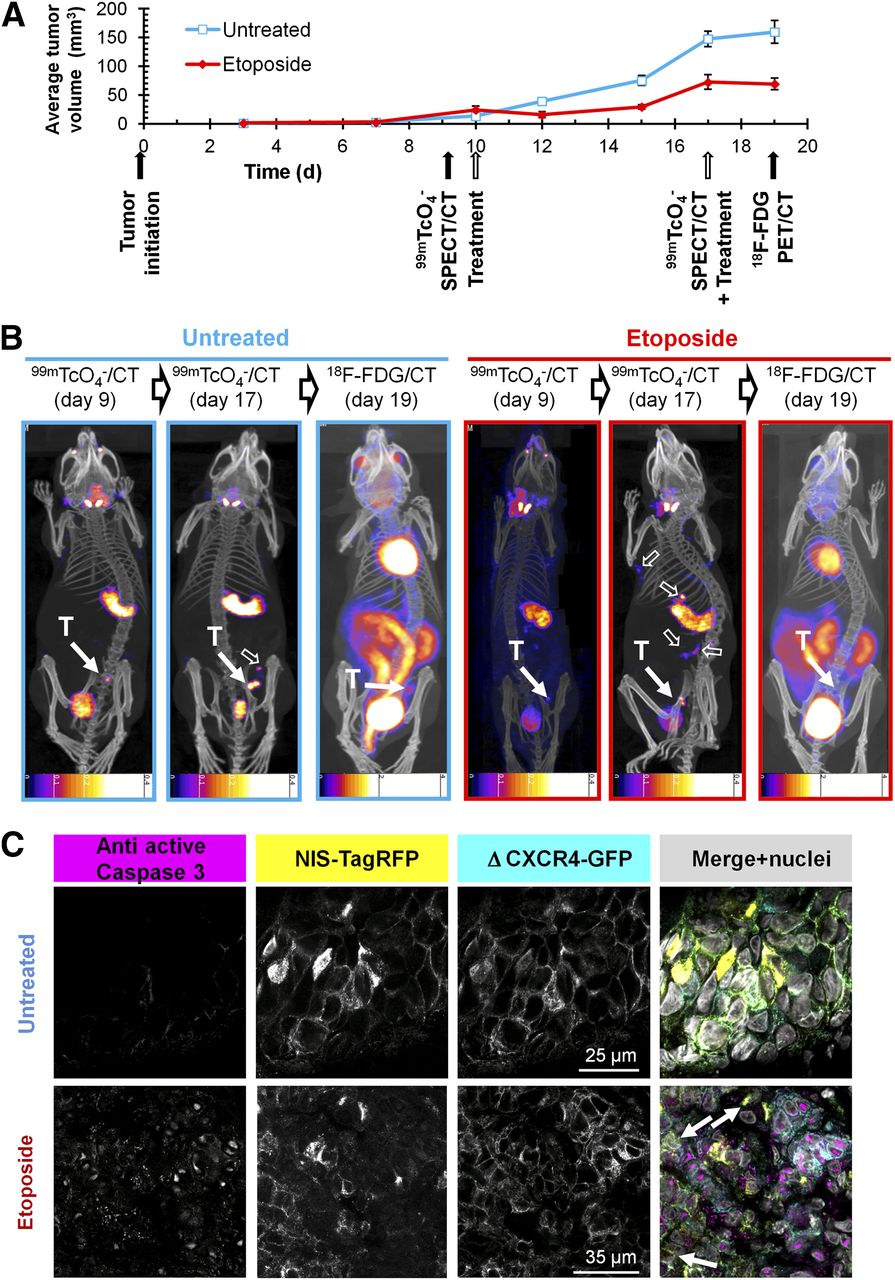
NIS-based metastasis model allows reliable and sensitive detection of primary tumor growth and metastatic spread under genotoxic stress therapy. (A) Experimental treatment and imaging schedule overlaid by tumor growth curves of etoposide-treated (red) and untreated (blue) animals growing 3E.Δ-NIS tumors. n = 4 animals/group, error bars represent SD. (B) Typical 99mTcO4− SPECT/CT and 18F-FDG PET/CT maximum-intensity projections overlaid in CT slices of etoposide-treated (red) and untreated (blue) animals representing 1 of 4 animals per group each; time points correspond to (A). T indicates primary tumor (solid arrow), and empty arrows show sites of metastasis. Because of the nature of radionuclide tracers, bladder signals are different in their relative intensities as compared with other signals. In all NIS-based images, stomach and thyroid and salivary glands are clearly recognizable whereas in 18F-FDG images strong signals are obtained from heart as well as kidneys, interfering with reliable metastasis detection. Scale bar units are kBq. (C) Typical immunostaining micrographs of tissue sections from primary tumors in B showing expected caspase-3 activation (magenta) in etoposide-treated tumors (bottom) as compared with untreated tumors (top). NIS-TagRFP (yellow) and prometastatic Δ CXCR4-GFP (cyan) expression and merged images including nucleic staining (gray) are shown.
Importantly, NIS imaging allowed following of the etoposide response longitudinally, and we found the occurrence of distant metastasis in etoposide-treated animals using NIS but not by 18F-FDG imaging (Fig. 5B, right). These data clearly show that although etoposide treatment leads to a reduction of primary tumor volumes in the first days after administration, it does not interfere with metastatic spread in this model.
Furthermore, we checked whether the imaging results were reflected in quantitative organ-harvesting and γ-counting measurements with both tracers. The experiment was performed according to the schedule in Figure 6 including a positive or negative classification SPECT/CT scan (day 17) with subsequent randomization of animals into 2 cohorts (99mTcO4−, 18F-FDG). We harvested tumors, axillary and inguinal LNs, heart, kidneys, blood, stomach, and trachea with thyroid glands and γ-counted tissues. Importantly, we found in etoposide-treated animals that the pertechnetate SUV ranges in tissues positive for cancer cells (primary tumor and positive LNs; biopsies confirmed by confocal microscopy) were drastically enlarged in the cancerous tissues (indicative of a heterogeneous treatment response, Fig. 6A). We did not find this in the 18F-FDG biodistribution measurements (Fig. 6B), because of its limited dynamic range and contrast issues. In organs not affected by the cancer (such as heart, kidneys, blood, and stomach), we did not find an enlarged SUV range in any treatment group, proving reproducibility of the technique with normally small SUV ranges. These data clearly demonstrate that this type of genotoxic stress therapy leads to a heterogeneous treatment response, both within the same and between different microenvironments.
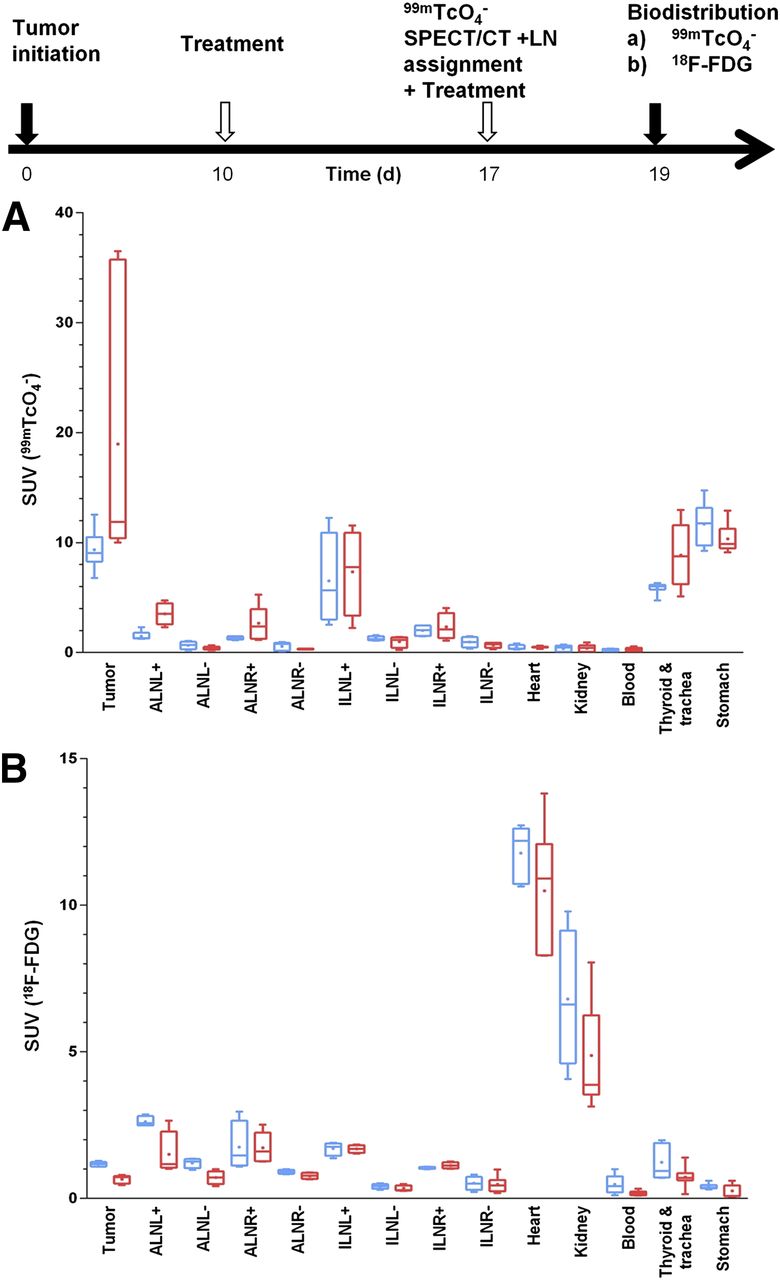
Etoposide treatment results in heterogeneous response in organs affected by metastatic deposits. Experimental treatment and imaging schedule. On day 17, 99mTcO4− SPECT/CT scan was obtained to classify LNs as either positive (+) or negative (−) for metastasis. Two days later, quantitative organ-harvesting and γ-counting measurements were performed with 99mTcO4− (A) or 18F-FDG (B), and SUVs were calculated. Box-and-whisker plots with line indicating median and dot indicating mean; bars indicate maximum range. Organs from treated (red) and untreated animals (blue) are shown (n = 8 animals/group).
DISCUSSION
In general, cell tracking is a task that involves differentiating the cells of interest (e.g., cancer cells) from all other cells of the body in space over an extended period of time. A prerequisite for this is excellent contrast; some properties of cancer cells, for instance, their elevated metabolic activity (Warburg effect), can be exploited to generate contrast (e.g., using 18F-FDG).
In principle, the sensitivity of preclinical cell tracking by radionuclide imaging depends on several parameters including the expression levels of the tracer target, the tracer affinity (e.g., if the tracer is a ligand to a targeted receptor), tracer uptake and retention (if the tracer is not biochemically retained as, for example, 18F-FDG is), the radionuclide properties, and the imaging technology. Although several different reporter genes are available (6), we chose NIS because its tracers are widely available without specialist radiochemistry facilities and at comparatively low cost, there are tracers for both SPECT and PET (6,14–16), and tracer metabolism and clearance are well understood. In our case, the sensitivity depends on NIS expression levels and function and percentage of NIS-positive cells. As a previous report has suggested that non–NIS-expressing cells have a growth advantage over NIS expressors (39), we ensured that new cell lines consist only of NIS-positive cells at comparable expression levels. Most NIS-TagRFP fluorescence was in the plasma membranes, suggesting it was in a functionally available state for radionuclide imaging (Figs. 2D and 3). Previously, exogenous NIS was introduced into prostate cancer cells and pulmonary tumors were formed via tail vein injection. The minimum size of tumor nodules detected by either 99mTcO4− or 123I SPECT was reported to be 3 mm, but not all nodules were detected, which was probably due to a population composed also of non-NIS expressors (40). In our model, we were able to identify metastasis in LNs, which had sizes below 2 mm. The weights of LNs classified by SPECT/CT to be positive were 2.4-fold (axillary, P = 0.00004) and 3.5-fold (inguinal, P = 0.00014) higher than of those classified negative for metastasis. Axillary LNs that contained metastatic deposits were found to be enlarged at the time of ex vivo microscopic assessment (∼2 vs. < 1 mm in unaffected LNs; Fig. 3). However, the tumor cells had not filled up the whole LN volume but frequently resided in the subcapsular region (Fig. 3B), a finding frequently seen in breast cancer (41) and demonstrating the high sensitivity of this approach in vivo. Importantly, our in vitro measurements revealed a detection limit of 1,000 NIS-positive cells (Supplemental Fig. 2). The method’s sensitivity together with carefully selected stably and functionally NIS-expressing cell lines allowed longitudinal whole-body imaging of spontaneous metastasis, which could not be achieved with 18F-FDG PET imaging.
By using NIS-based imaging, we also overcame some shortcomings of the 18F-FDG tracer with respect to its contrast or specificity. First, we showed improved contrast levels as compared with 18F-FDG imaging because other metabolically highly active organs such as the heart and kidneys are not expressing NIS. This can be seen from the images (Figs. 2 and 3) and was confirmed by quantitative organ-harvesting and γ-counting measurements (Fig.4); second, we reduced the background further by excluding infiltrating immune cells, which can take up 18F-FDG and thereby interfere with signals from cancer cells (9,42). Ex vivo confocal fluorescence microscopy confirmed the presence of metastasis in tissues identified to be positive in radionuclide images in every case (Fig.3) whereas γ counting confirmed the correct image-based assignments of metastasis positivity or negativity with high significance (Fig. 4).
Importantly, cancer cells can evade detection by 18F-FDG imaging if a therapeutic agent downmodulates their GLUTs from the cell surface (10). This mechanism is also reflected in our 18F-FDG data (Fig. 6B) in that we obtained significantly smaller tumor SUVs (P = 0.0012) in primary tumors of etoposide-treated (0.66 ± 0.05), as compared with untreated, animals (1.17 ± 0.03). We proved the drug to be effective as demonstrated by positive antiactive caspase 3 staining in most tumor cells (Fig. 5C). However, no significant loss of cells due to completion of the apoptotic program could be confirmed by histology in the primary tumors at this time point after etoposide treatment. Therefore, the reduced uptake of 18F-FDG is a direct result of etoposide affecting GLUTs and is in agreement with previous reports (10,12). Although continuous interference with glucose uptake can also kill cells because of a lack of nutrients, it is unclear over what time scale this happens and whether it leads to selection, dormancy, or enhanced spread. In contrast, we show that our NIS-based strategy allows reliable imaging of tumor growth and metastasis also in the presence of etoposide treatment (Figs. 5 and 6).
Importantly, we found in etoposide-treated animals that the pertechnetate SUV ranges in the cancerous tissues were significantly enlarged as compared with noncancerous tissues (Fig. 6A). This is important because the larger variation in SUVs (most likely reflecting the fraction of live tumor cells per volume) is indicative of a heterogeneous treatment response. For instance, we found small numbers of tumor cells in primary tumor sections of etoposide-treated animals that did not stain positively for antiactive caspase 3 (Fig. 5C, bottom, white arrows). The effect could be due to several effects including heterogeneity in the drug availability at the metastatic sites, heterogeneity as a consequence of mechanisms spontaneously conferring resistance to etoposide treatment, heterogeneity due to clonal selection under genotoxic stress, or the more recently discovered effect of immune microenvironment differences on chemotherapy response (43). The genetics-based hypotheses are strengthened by 2 recent studies reporting on differences in gene and micro RNA expression in human breast cancer cell lines that were either sensitive or resistant to etoposide (44,45). Clearly, more in-depth research is necessary to unravel the precise cause for this heterogenic behavior under etoposide treatment.
CONCLUSION
We developed a new strategy for preclinical longitudinal in vivo cancer cell tracking with greater sensitivity and reliability than 18F-FDG PET and applied it to track spontaneous and distant metastasis in the presence or absence of genotoxic stress therapy. Importantly, the model provides sufficient sensitivity and dynamic range to permit the reliable assessment of heterogeneous treatment responses in various microenvironments.
DISCLOSURE
The costs of publication of this article were defrayed in part by the payment of page charges. Therefore, and solely to indicate fact, this article is hereby marked “advertisement” in accordance with 18 USC section 1734. We acknowledge support from the King's College London (KCL)-UCL Comprehensive Cancer Imaging Centre, funded by CRUK and EPSRC in association with the MRC and DoH; from the Department of Health via the National Institute for Health Research (NIHR) Biomedical Research Centre award to Guy's and St. Thomas' NHS Foundation Trust in partnership with KCL and King's College Hospital NHS Foundation Trust; from the Centre of Excellence in Medical Engineering funded by the Wellcome Trust and EPSRC (WT088641/Z/09/Z); and from Dimbleby Cancer Care. The scanners were purchased and maintained by an equipment grant from the Wellcome Trust. The views expressed are those of the authors and not necessarily those of the NHS, the NIHR, or the DoH. No other potential conflict of interest relevant to this article was reported.
Acknowledgments
We thank Dr. Kavitha Sunassee, Jennifer Williams, and Krisanat Chuamsaamarkkee for technical help.
Footnotes
↵* Contributed equally to this work.
Published online Mar. 6, 2014.
- © 2014 by the Society of Nuclear Medicine and Molecular Imaging, Inc.
REFERENCES
- Received for publication June 15, 2013.
- Accepted for publication November 19, 2013.


Jump to section
Related Articles
Cited By...
- Addressing Biological Questions with Preclinical Cancer Imaging
- Imaging of T-cell Responses in the Context of Cancer Immunotherapy
- New horizons in multimodality molecular imaging and novel radiotracers
- 18F-Fluorosulfate for PET Imaging of the Sodium-Iodide Symporter: Synthesis and Biologic Evaluation In Vitro and In Vivo