


Article Figures & Data
Figures
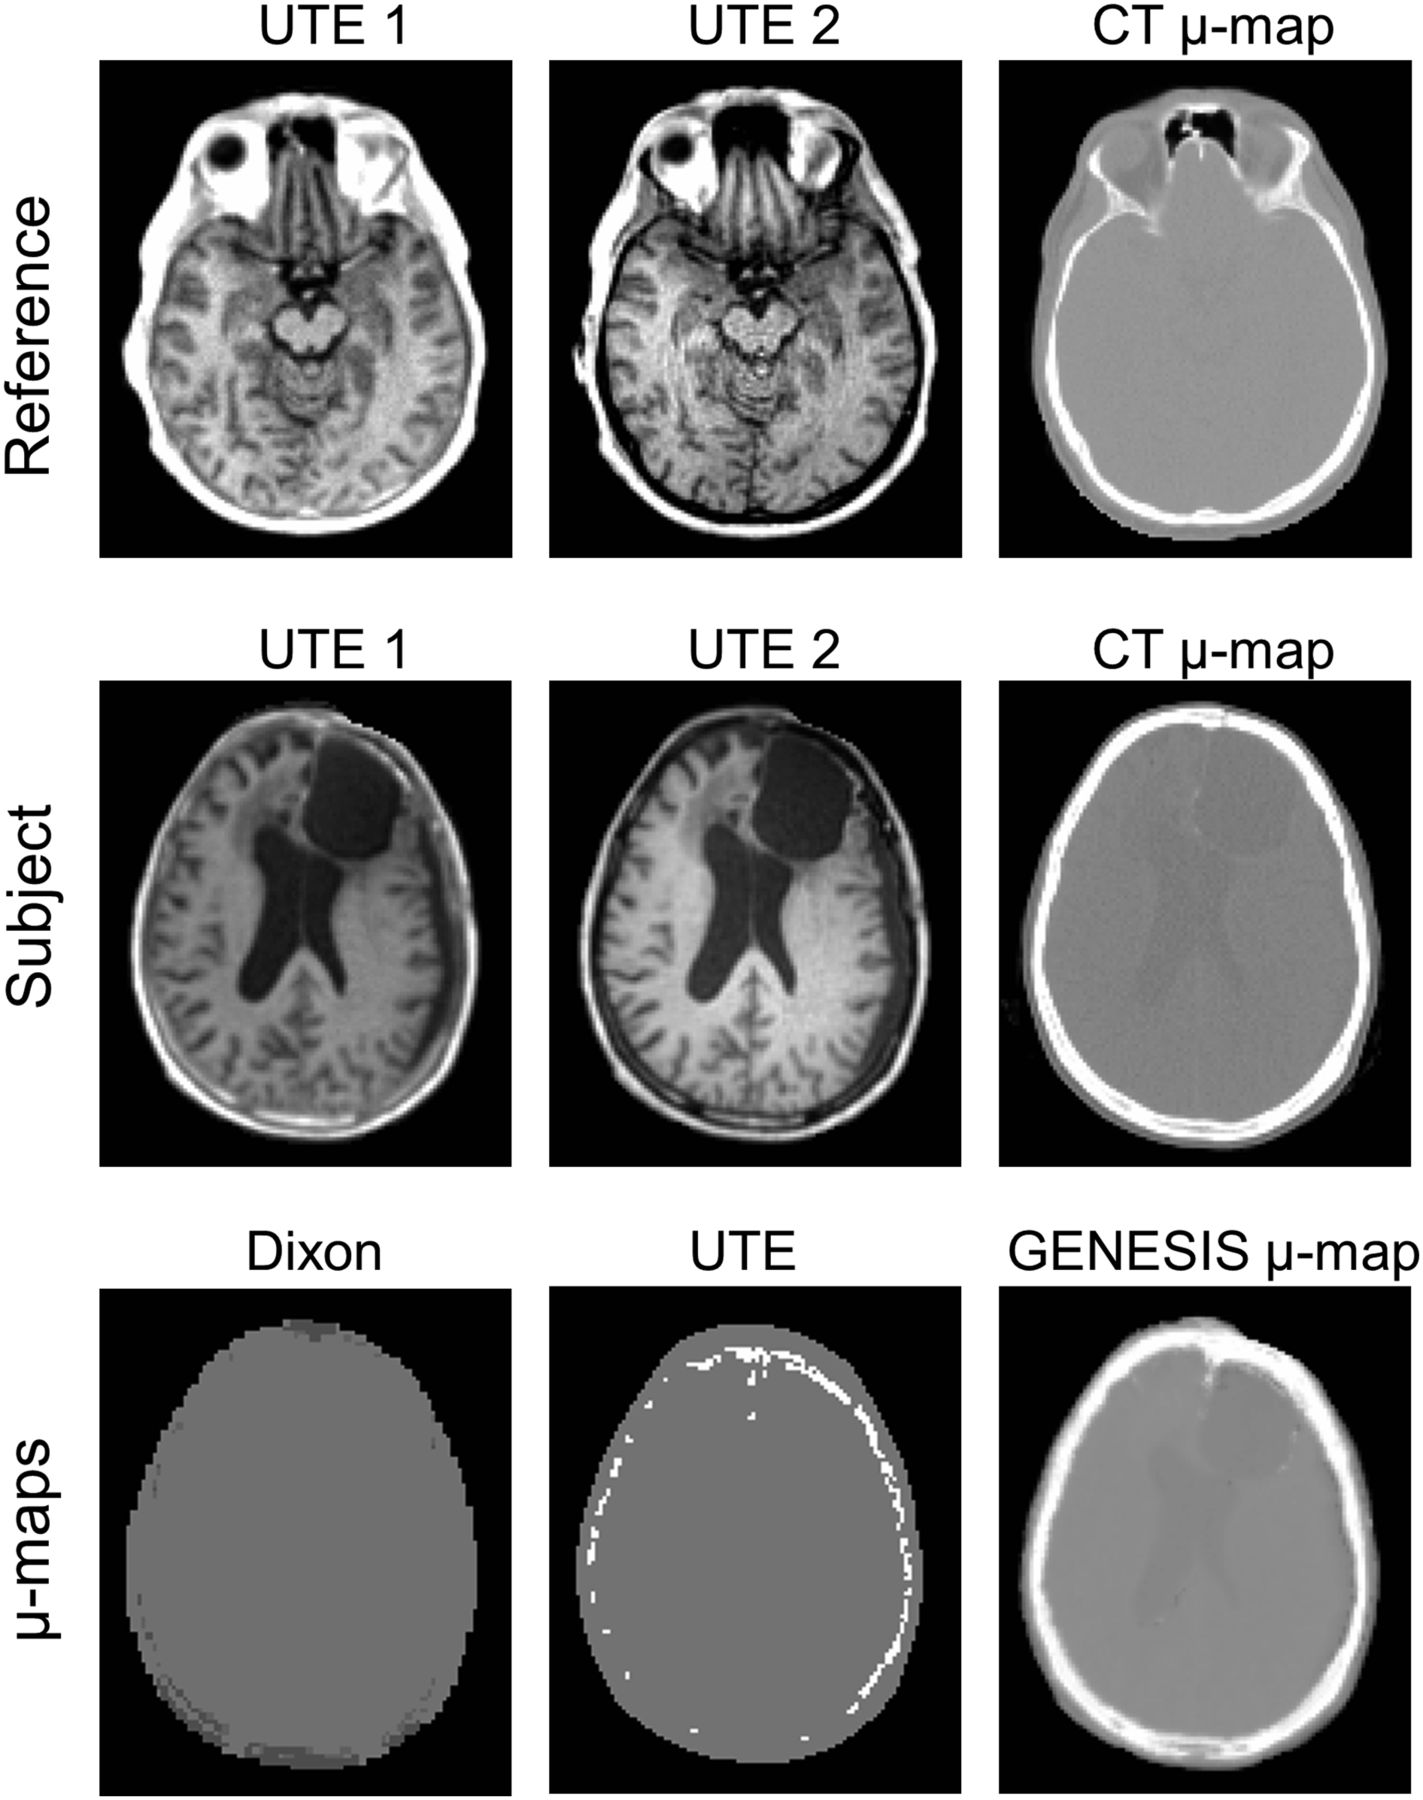
- FIGURE 1.
Top 2 rows show dual-echo UTE images (echo time, 70 μs and 2.46 ms) and corresponding original CT-based μ maps of reference and subject with lesion. Bottom row shows Siemens Dixon, Siemens UTE-based μ map, and our GENESIS result for subject.
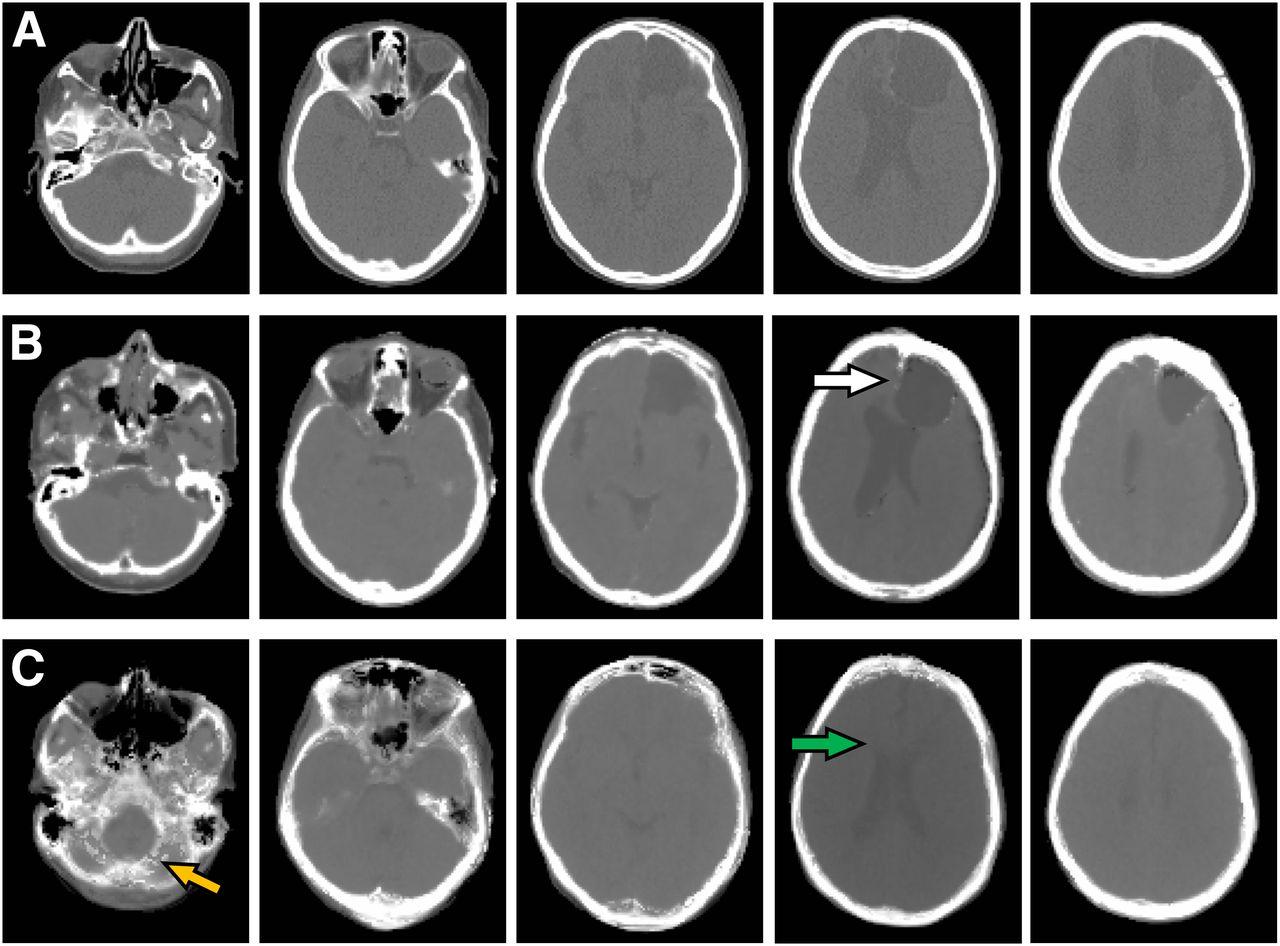
- FIGURE 2.
Corresponding axial sections of μ maps of subject from original CT (A), GENESIS (B), and deformable registration (C) demonstrate that, visually, GENESIS μ map is closer to original CT-based μ map than is that obtained by deformable registration. Cystic lesion in left frontal lobe (white arrow) is well represented by GENESIS but not by deformable registration. Similarly, dilation of right lateral ventricle (green arrow) is not represented in deformable registration. Misregistration in posterior fossa mislabels much of cerebellum as bone (orange arrow).
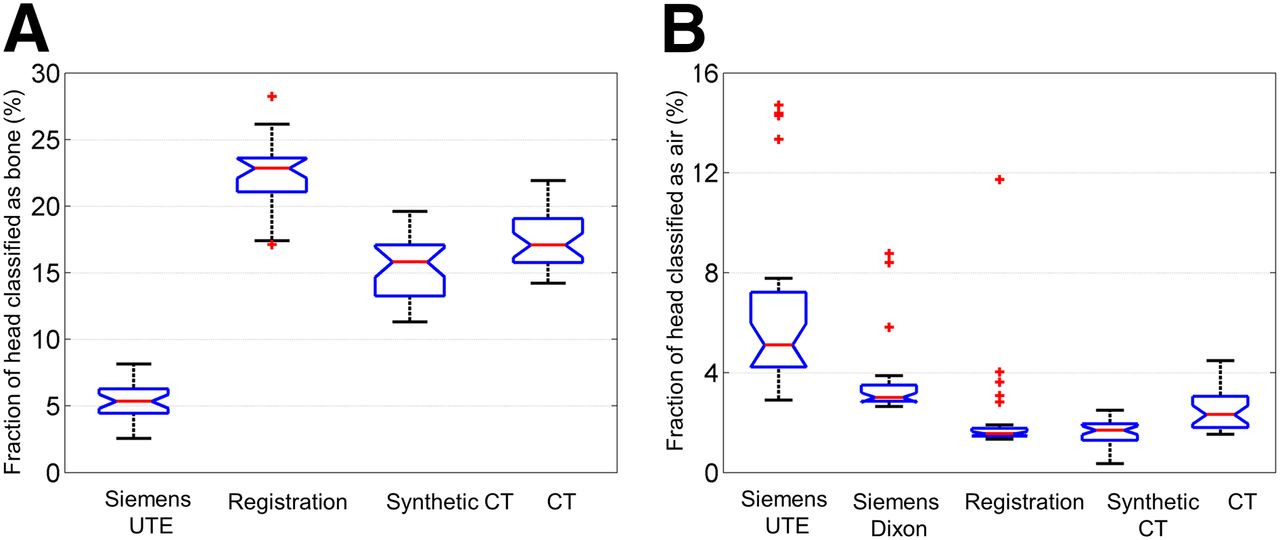
- FIGURE 3.
Comparison of tissue classification results for bone (A) and air (B) across different methods as compared with gold standard original CT. GENESIS most closely corresponds to gold standard. Siemens Dixon method does not allow for bone classification and hence is not represented in A.
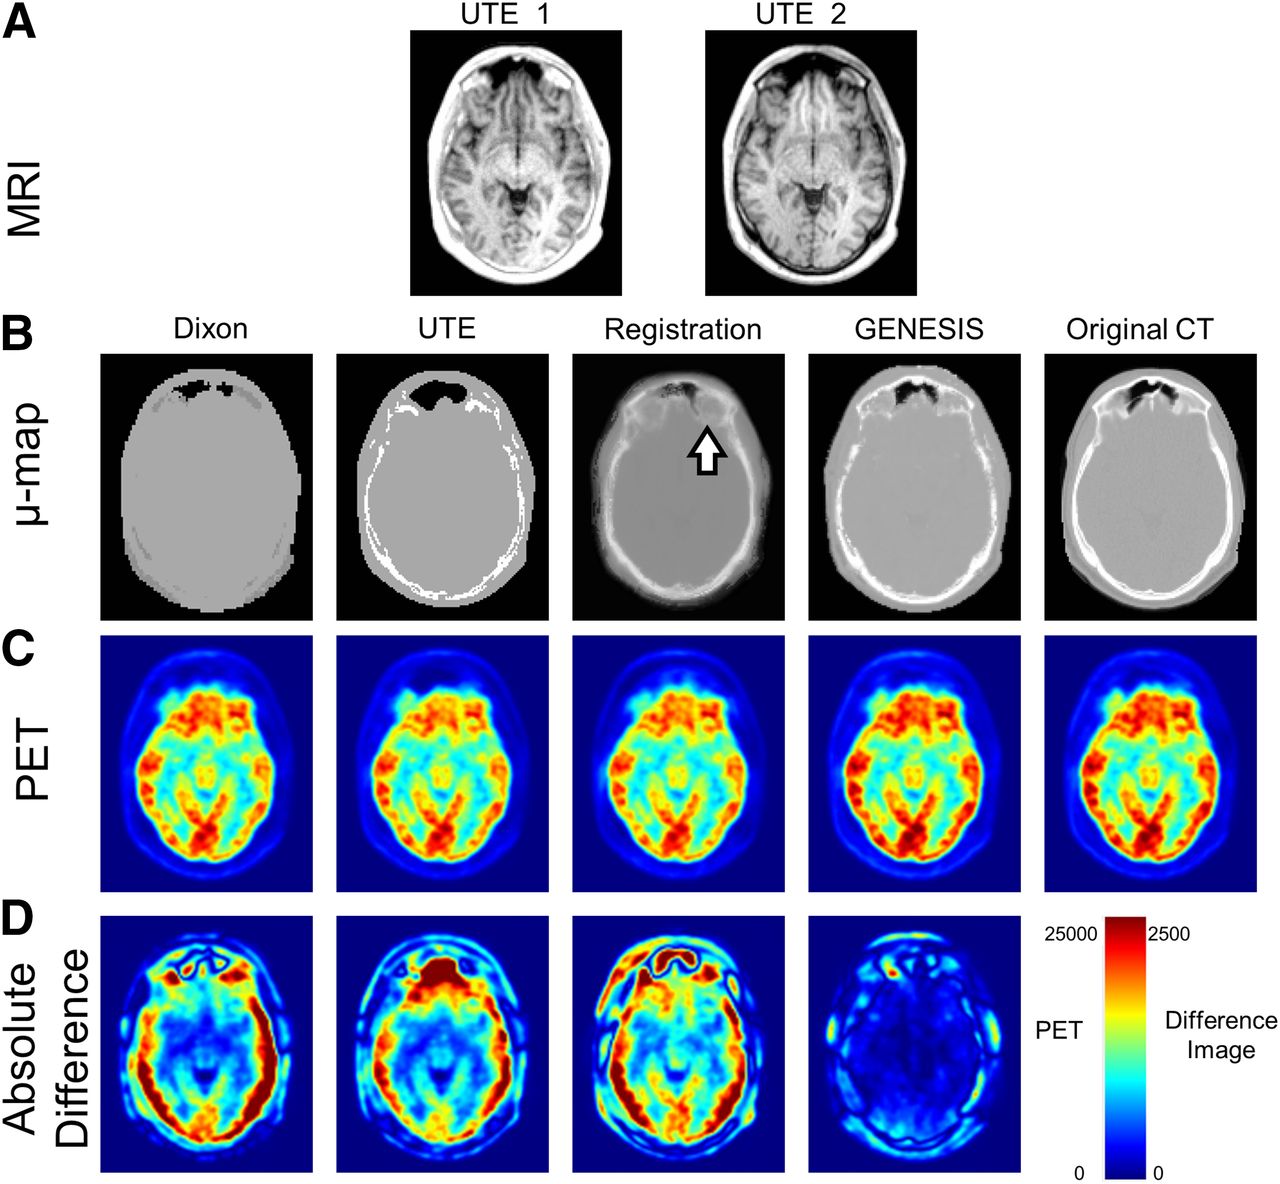
- FIGURE 4.
Comparison of final attenuation correction process for single subject using different methods. Initial MR UTE images (A) were converted into μ maps (B) generated using Siemens Dixon and UTE. Deformable registration and GENESIS are compared with gold standard CT. Blurring of bone is introduced by deformable registration method (white arrow in B). Although attenuation-corrected PET images (C) appear grossly similar, images representing absolute difference between each of 4 methods and original CT-based attenuation-corrected PET (D) demonstrate marked differences. Color bar for difference images represents 10-fold increase in scale relative to that for original images.
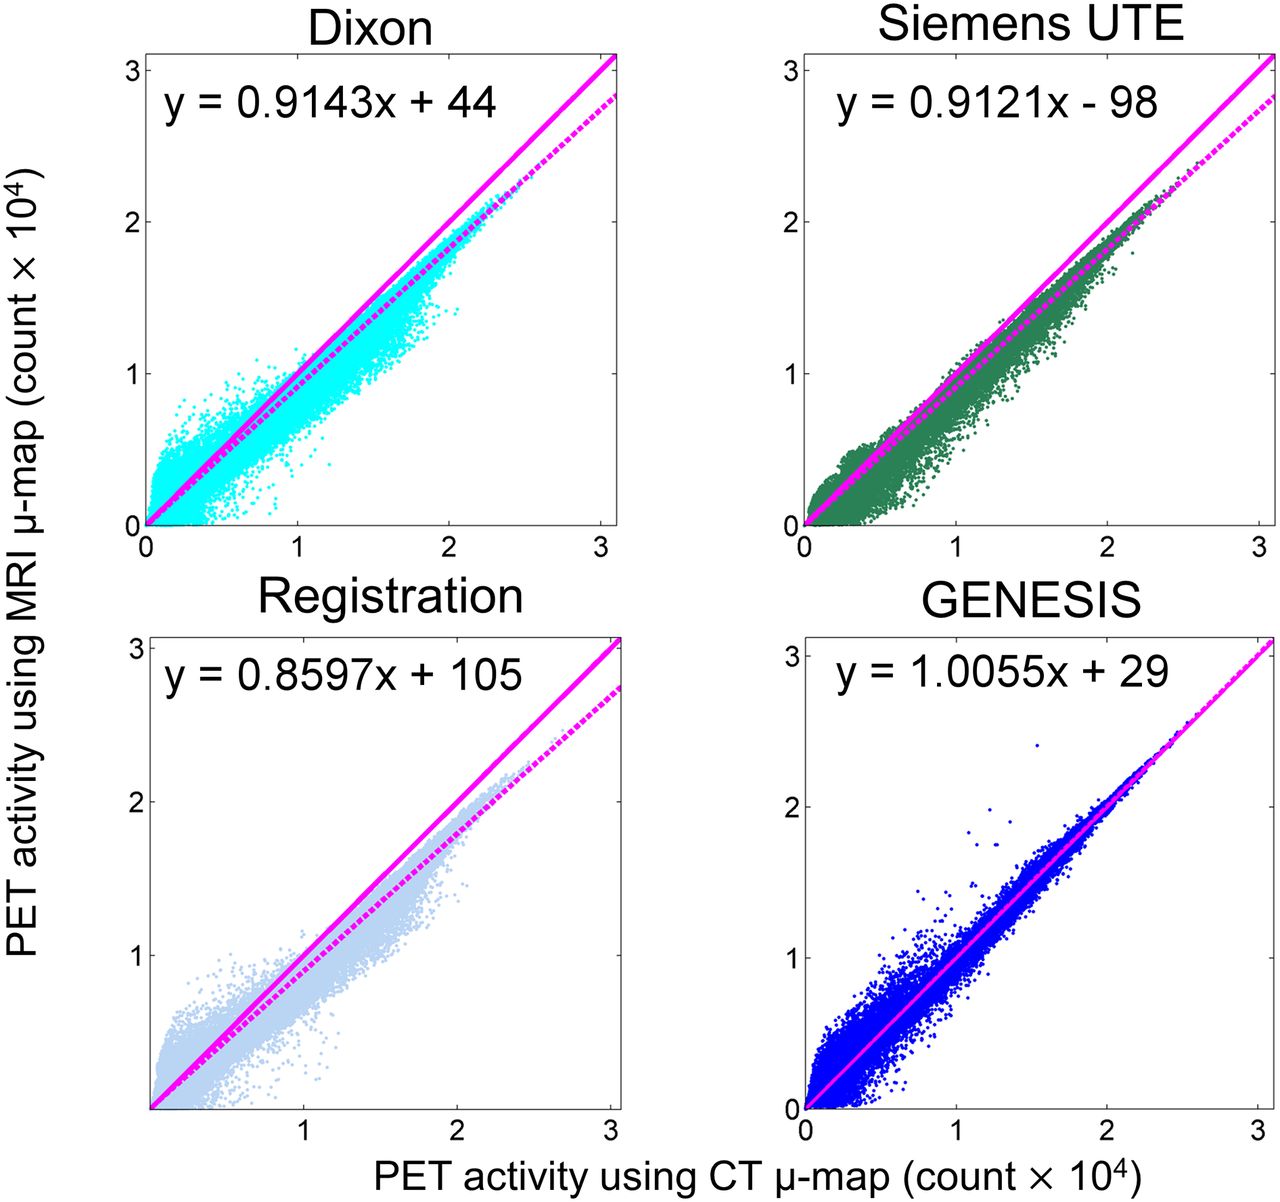
- FIGURE 5.
Scatterplots of CT-based PET intensities vs. MR-based PET intensities (×104) at each voxel of PET images are shown for Siemens Dixon, UTE, registration, and GENESIS. Solid magenta lines indicate unit slope, and dotted magenta lines are robust linear fit of data.
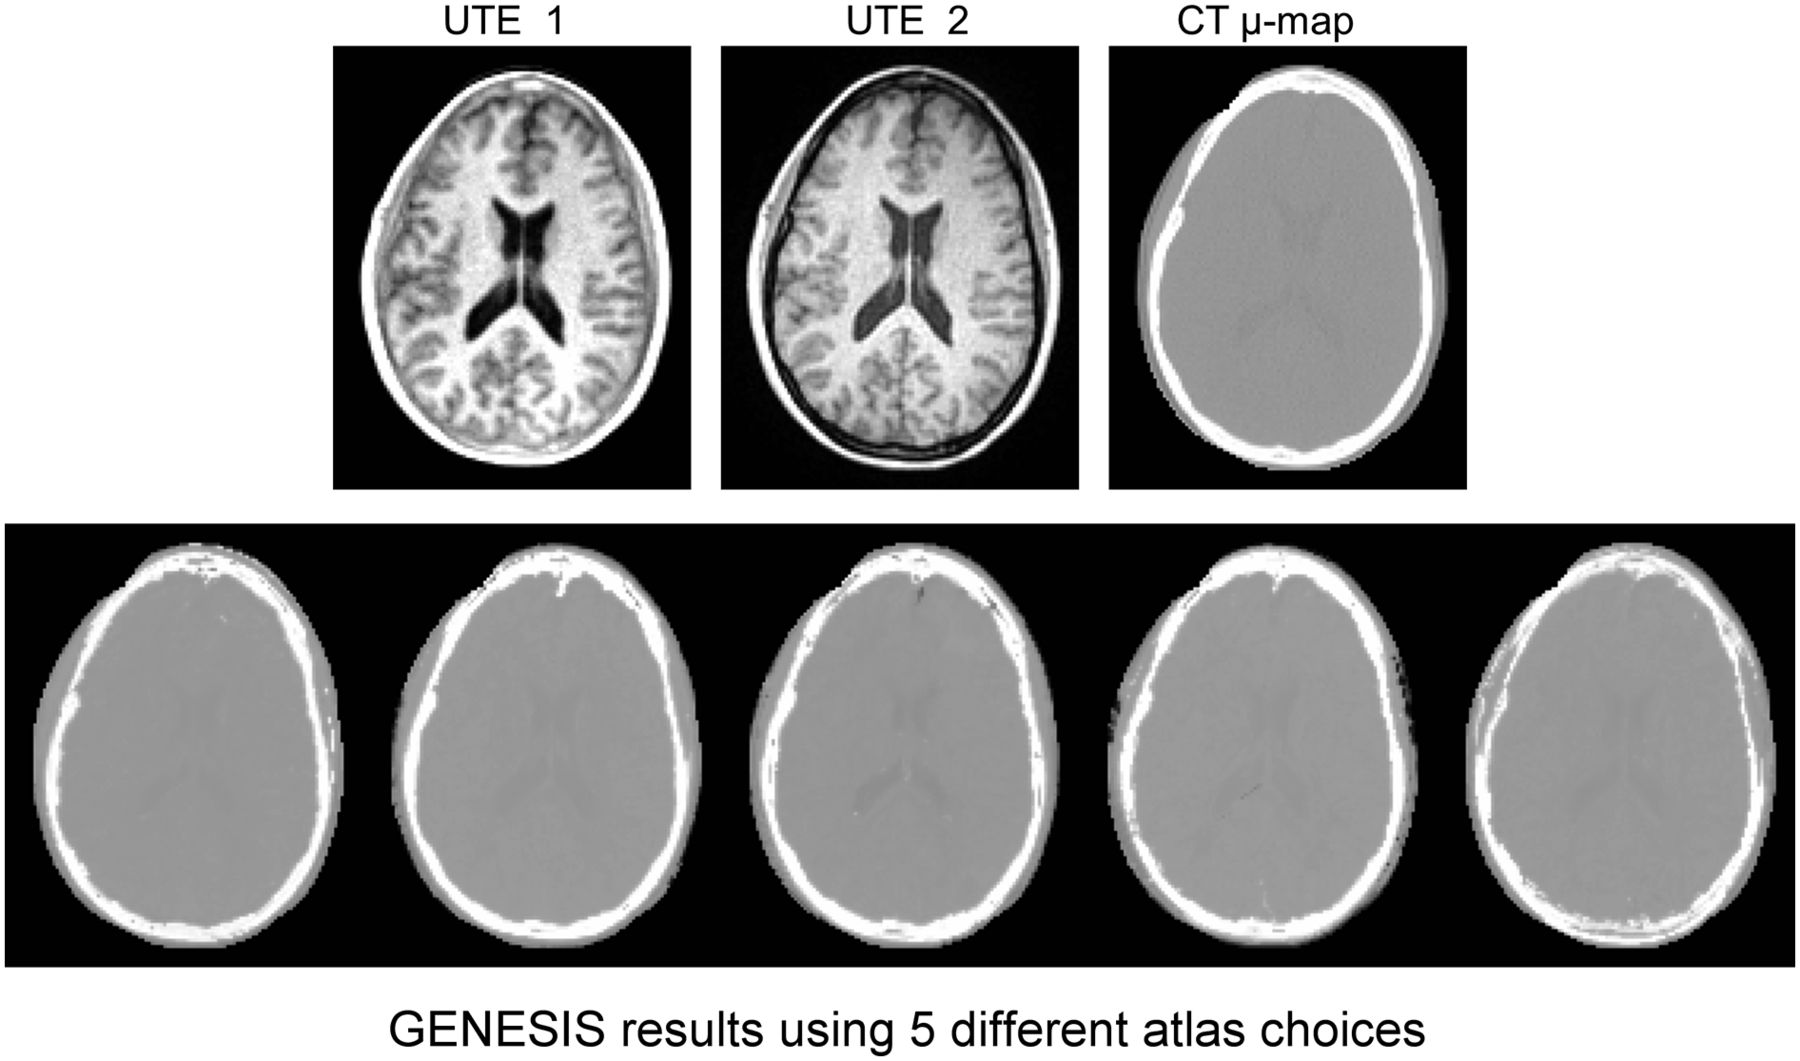
- FIGURE 6.
Comparison of GENESIS results using different reference data. Top row shows UTE and CT μ map of subject 3. Similarity of all 5 images in bottom row, each generated using different atlas, indicates robustness of GENESIS method and its relative independence of choice of reference atlas.


Tables
Subject no. Metric MR-based μ map 1 2 3 4 5 Mean ± SD Correlation (ρ) Dixon 0.89 0.44 0.54 0.74 0.36 0.61 ± 0.21 UTE 0.86 0.55 0.65 0.82 0.44 0.66 ± 0.18 Registration 0.95 0.63 0.67 0.85 0.66 0.75 ± 0.14 GENESIS 0.95 0.70 0.67 0.91 0.70 0.79 ± 0.13* PSNR (dB) Dixon 19.95 17.59 18.24 18.04 18.01 18.37 ± 0.92 UTE 16.62 16.43 17.50 16.73 16.32 17.12 ± 0.96 Registration 23.09 19.37 18.18 21.52 20.86 20.61 ± 1.90 GENESIS 23.36 21.17 20.62 22.38 22.04 21.92 ± 1.07* ↵* Largest correlation and PSNR.
- TABLE 2
Comparison Between 4 Methods with CT-Reconstructed PET Images, with Respect to Correlation, PSNR, Regression Slopes, and R2
Subject no. Metric Image type 1 2 3 4 5 Mean ± SD Correlation Dixon 0.994 0.993 0.992 0.990 0.994 0.993 ± 0.001 UTE 0.994 0.994 0.995 0.991 0.994 0.993 ± 0.001 Registration 0.954 0.982 0.964 0.997 0.875 0.954 ± 0.048 GENESIS 0.996* 0.995* 0.996* 0.998* 0.997* 0.996 ± 0.001* PSNR (dB) Dixon 30.32 32.95 29.45 25.87 29.75 29.67 ± 2.53 UTE 29.63 33.03 30.28 25.15 28.62 29.34 ± 2.86 Registration 24.95 31.94 24.10 35.34 20.82 27.43 ± 5.99 GENESIS 35.34* 37.78* 34.57* 36.59* 35.61* 35.98 ± 1.24* Slope Dixon 0.924 0.913 0.914 0.872 0.904 0.905 ± 0.020 UTE 0.912 0.899 0.913 0.870 0.888 0.896 ± 0.018 Registration 0.894 0.987 0.862 1.011 1.039 0.959 ± 0.077 GENESIS 0.983* 0.992* 1.014* 0.986 0.971* 0.990 ± 0.016* R2 Dixon 0.972 0.973 0.979 0.962 0.967 0.971 ± 0.006 UTE 0.974 0.967 0.982 0.945 0.971 0.968 ± 0.014 Registration 0.889 0.956 0.914 0.987 0.744 0.898 ± 0.094 GENESIS 0.992* 0.989* 0.994* 0.993* 0.985* 0.991 ± 0.004* ↵* Largest correlation, PSNR, R2, and slope.
- TABLE 3
For 1 Subject, Comparison of 5 Synthetic μ Maps, Generated Using 5 Different References, with CT-Based μ Map and PET Reconstructions
Patient no. Image type Metric 1 2 3 4 5 μ map Correlation 0.9073 0.9017 0.9109 0.9017 0.9009 PSNR 22.38 21.87 22.47 21.90 22.26 PET Correlation 0.9979 0.9980 0.9979 0.9980 0.9982 PSNR 36.59 36.98 36.41 36.90 36.86
Supplemental Data
Files in this Data Supplement:


