


Abstract
Hepatic transport of 99mTc-mebrofenin through organic anion transport protein 1a and 1b (Oatp1a/1b) and multidrug resistance protein 2 (Mrp2) was investigated by small-animal SPECT. On the basis of the results, a noninvasive method to visualize and quantify disturbances in hepatic transport is proposed. Methods: Friend virus B wild-type mice (untreated, bile duct–ligated, vehicle- or rifampicin-treated) and strain-matched knockout mice unable to express the uptake transporters Oatp1a/1b (Slco1a/1b−/−/−/−) or the efflux transporter Mrp2 (Abcc2−/−) were intravenously injected with 99mTc-mebrofenin (n = 3 per group). After dynamic small-animal SPECT and short CT acquisitions, time–activity curves of the liver and of the gallbladder and intestines were obtained and correlated with direct blood samples. Results: Normal hepatobiliary clearance of 99mTc-mebrofenin was severely impaired in the bile duct–ligated animal, as evidenced by elevated hepatic tracer levels. In Slco1a/1b−/−/−/− mice, a lower area under the curve (AUC) for the liver (P = 0.014) was obtained and no activity was detected in the gallbladder and intestines. Renal rerouting was observed, along with an increase in the blood AUC (P = 0.01). Abcc2−/− mice had a higher liver AUC (P = 0.009), a delayed emergence time of 99mTc-mebrofenin in the gallbladder (P = 0.009), and a lower AUC for the gallbladder and intestines (P = 0.001). The blood curve was similar to that of wild-type mice. 99mTc-mebrofenin disposition was altered after rifampicin treatments. We observed a dose-dependent delayed time point at which tracer maximized in liver, an increased AUC for liver, and a lower AUC for gallbladder and intestines (P = 0.042, 0.034, and 0.001, respectively, highest dose). Emergence in the gallbladder occurred later (P = 0.009, highest dose), and blood AUC was higher (P = 0.006). Conclusion: The current study visualized and quantified hepatic uptake and biliary efflux of 99mTc-mebrofenin. Our results demonstrated the possibility of discriminating, on a quantitative level, between lack of functional activity of sinusoidal uptake versus that of biliary efflux transporters.
Mebrofenin labeled with 99mTc is a second-generation hepatic iminodiacetic acid derivative commonly used in nuclear medicine to investigate hepatic function and dysfunction by SPECT (1–4). After intravenous injection, this ionic tracer binds to plasma proteins (3). In the sinusoids of the liver, it is taken up by hepatocytes through a carrier-mediated, sodium-independent transport mechanism, the organic anion transport protein 1 (OATP1). Mebrofenin is then transported into bile by the active efflux transporter multidrug resistance protein 2 (MRP2) (5), finally entering the small intestine through the common bile duct.
Hepatobiliary transport processes are crucial for the secretion and elimination of toxic compounds (e.g., drugs, carcinogens, and endobiotics) (6,7). Numerous drugs act as both substrates and inhibitors of hepatic transporters such that unexpected and unwanted interactions are frequently observed (8,9), including toxic concentrations of bile acids or substrate drugs in the blood or liver (10). For example, the inhibition of OATPs or MRP2, both of which are transport proteins of mebrofenin, may lead to hyperbilirubinemia (11,12).
In the present study, the hepatobiliary transport of 99mTc-mebrofenin was investigated in vitro and in vivo. Based on the results, a noninvasive in vivo method is proposed to assess disturbances in the transport of 99mTc-mebrofenin in mice.
Rifampicin mediates the inhibition of OATP1B1 in vitro (13), mouse Oatp1a/1b in vivo (14), and Mrp2 in sandwich-cultured rat hepatocytes (15). However, less is known about the effects of rifampicin on the function of hepatic MRP2 in humans, as these may be hard to detect in circulating blood. Thus, rifampicin provided an ideal test compound for this study. We hypothesized that rifampicin inhibits Oatp1a/1b as well as Mrp2, with inhibition reflected in altered time–activity curves for the blood, the liver, and the gallbladder and intestines (Fig. 1) (16,17). As a reference, and to investigate in vivo the relative contributions of uptake and efflux transporters in 99mTc-mebrofenin handling, dynamic small-animal SPECT imaging was used to characterize the behavior of 99mTc-mebrofenin in knockout mice unable to express the uptake transporters Oatp1a/1b (Slco1a/1b−/−/−/−) (14) or the efflux transporter Mrp2 (Abcc2−/−) (18). It was further hypothesized that elevated concentrations of 99mTc-mebrofenin would be detected in the blood of Slco1a/1b−/−/−/− mice and in the liver of Abcc2−/− mice (Fig. 1).

Study hypothesis for WT (A), Slco1a/1b−/−/−/− (deficient in Oatp1a/1b transporters) (B), Abcc2 −/− (deficient in Mrp2 transporter) (C), and rifampicin-treated (D) mice. In WT mice, rapid uptake in liver and efflux to gallbladder and intestines were expected, in contrast to Slco1a/1b−/−/−/− mice, in which no noteworthy uptake was anticipated. In Abcc2 −/− mice, normal uptake in liver and absence of efflux to gallbladder and intestines were hypothesized, whereas in rifampicin-treated mice, decreased uptake and efflux were assumed.
Critical for the interpretation and translation of the data in such experiments is a comprehensive mechanistic understanding of the hepatic handling of 99mTc-mebrofenin. 99mTc-mebrofenin is an in vitro substrate of OATP1B1, OATP1B3, MRP2, and MRP3 but not of OATP2B1 and natrium taurocholate cotransporting polypeptide (NTCP) (4,13). It is not yet known, as far as we are aware, whether 99mTc-mebrofenin (an anion) is a substrate for organic cation transporter 1 (OCT1), although such a possibility is unlikely. Considering the high-level expression of OCT1 in the sinusoidal membrane, in the present work it was also important to formally exclude OCT1-mediated 99mTc-mebrofenin transport.
MATERIALS AND METHODS
In Vitro Assays
Chinese hamster ovary cells (CHO-K1) were purchased from ATCC and served as controls for the transfected cell lines. CHO-NTCP and CHO-OATP1B1 cells were purchased from Solvo Biotechnologies; CHO-OCT1 cells were a kind gift from the same company. CHO-NTCP, CHO-OATP1B1, and CHO-OCT1 cells were stably transfected with genes encoding human NTCP (SLC10A1), OATP1B1 (SLCO1B1), and OCT1 (SLC22A1), respectively. The cell lines were cultured in a humidified atmosphere at 37°C in the presence of 5% CO2. The culture medium consisted of Dulbecco modified Eagle’s medium (Invitrogen), supplemented with 10% fetal calf serum, 4 mM l-glutamine, and 1 mM sodium pyruvate, without antibiotics.
For transport experiments, all CHO cells were seeded in 24-well plates (6.0 × 10⁵ cells per well) in 1 mL of culture medium. After 18–24 h, the medium was removed and the cells were washed twice with washing buffer (1.25 mL of sterile Hanks balanced salt solution with Ca2+ and Mg2+, 10 mM N-(2-hydroxyethyl)piperazine-N′-(2-ethanesulfonic acid), 1% bovine serum albumin, pH 7.4, 37°C). Incubation buffers (500 μL/well) were obtained by adding the (radiolabeled) compounds to the washing buffer. Final concentrations were 1 μM 3H-estradiol-17β-glucuronide (for OATP1B1), 1 μM 3H-taurocholic acid (for NTCP), 50 μM 14C-tetraethyl ammonium (for OCT1), and 0.066 nM 99mTc-mebrofenin (for all cell lines). The plates were incubated at 37°C and 0% CO2 with shaking. The incubation was stopped by adding 1.5 mL of ice-cold Hanks balanced salt solution with Ca2+ and Mg2+ (1% bovine serum albumin), after which the wells, containing the cells, were washed twice more. Next, the cells were lysed with 200 μL of mammalian protein extraction reagent and the plates were shaken for 10 min at 120 rpm. A 150-μL aliquot of this solution was used for liquid scintillation counting.
Murine Models
Friend virus B wild-type (WT) mice (female; age, 5 wk; weight, 20–25 g) were from Janvier, and Slco1a/1b−/−/−/− (male; age, 5 wk; weight, 25–30 g) and Abcc2−/− mice (female; age, 5 wk; weight, 20–25 g) were from Taconic Farms. The mice were housed and handled according to guidelines approved by the European Ethics Committee and acclimatized for at least 1 wk before the experiments. All animals were kept under environmentally controlled conditions (12-h normal light/dark cycles, 20°C–22°C, and 60% relative humidity) with food and water ad libitum. The study protocol was approved by the Animal Experimental Ethical Committee of Ghent University (ECD10/39).
Radionuclides, Radiopharmaceuticals, and Chemicals
Mebrofenin (N-(3-bromo-2,4,6 trimethylphenylcarbamoylmethyl)-iminodiacetic acid) was obtained as a commercial kit (Bridatec; GE Healthcare) in a preparation containing 40 mg of mebrofenin and 0.3 mg of tin(II)chloride-dihydrate. 99mTcO4− was eluted from a sterile 99mTc-generator (Drytec; GE Healthcare). The Bridatec kit was reconstituted according to the manufacturer’s recommendations with 1,480 MBq of 99mTcO4− in 4 mL of saline. Radiochemical purity was determined according to the method of Billinghurst et al. (19). The formulations used had a radiochemical purity of at least 95%.
Rifampicin and polyethylene glycol 400 were obtained from Sigma Aldrich, and dimethyl sulfoxide (DMSO) was from Acros Organics.
Molecular Imaging
The mice were imaged using a small-animal SPECT camera (U-SPECT-II/CT; MiLabs) equipped with a cylindric collimator containing 75 pinholes of 1-mm diameter (rat whole-body collimator; spatial resolution, 0.8 mm). All acquisitions were obtained in list mode.
After an overnight fast (minimum, 6 h), the mice were anesthetized with isoflurane and O2 to allow placement of intravenous polyethylene tubing (PE10; Becton Dickinson) in a lateral tail vein. One hour before tracer injection, rifampicin-treated mice were pretreated with 5 different rifampicin doses (100, 50, 37.5, 25, or 12.5 mg/kg in 100 μL of DMSO, intraperitoneally), and the control mice were pretreated with vehicle (100 μL of DMSO, intraperitoneally). During tracer injection, a second dose of rifampicin (25, 12.5, 9.37, 6.25, or 3.12 mg/kg) or vehicle was intravenously coadministered.
In one WT animal, ligatures were placed posterior and anterior to the gallbladder to obstruct bile flow completely. Immediately after surgery, the bile duct–ligated mouse was placed supine and all other mice prone on the mouse scanner bed.
The mice were imaged while anesthetized, with their body temperature maintained during imaging using a heated bed. The field of view was chosen on the basis of a 30-s CT acquisition. Subsequently, a 15-min dynamic SPECT acquisition using 60 time frames of 15 s each was initiated 5 s before the injection of 200 μL of 99mTc-mebrofenin (2.7 mg of mebrofenin, 74 MBq). Rifampicin-treated and vehicle-control mice were coinjected, respectively, with rifampicin (25, 12.5, 9.37, 6.25, or 3.12 mg/kg) and vehicle (100 μL of polyethylene glycol 400:saline, 30:70, v:v). Lastly, a CT acquisition (5 min; tube current, 612 μA; tube voltage, 50 kV) was obtained for anatomic correlation.
SPECT acquisitions were iteratively reconstructed using an ordered-subsets expectation maximization algorithm (3 iterations; 16 subsets; 0.75-mm voxel size; decay correction). Only those photons within an energy range of 140 ± 20 keV were included from the acquired list-mode data. Finally, 3 regions of interest were manually drawn over the liver, the gallbladder and intestines, and the urinary bladder using PMOD software (PMOD Technologies), with region-of-interest volumes of between 67 and 1,578 mm3. From these dynamic measurements, time–activity curves were obtained.
To assess the linearity of the small-animal SPECT camera, 10 samples with predetermined amounts of 99mTcO4− ranging from 0.37 to 74 MBq and measured with a CRC-15R dose calibrator (Capintec) were scanned in the same dynamic mode. The resulting calibration curve was used to quantify the amount of radioactivity. The total activity in each organ, expressed in megabecquerels (normalized to an injection of 37 MBq and a mouse weight of 20 g), was expressed as a function of time (in seconds).
Determination of 99mTc-Mebrofenin Blood Curve
After an overnight fast, the mice were injected with 200 μL of 99mTc-mebrofenin (2.7 mg, 74 MBq) through a lateral tail vein. Blood samples (30 μL) were taken by intravenous puncture in the contralateral tail vein at 1, 2, 5, 7, 10, and 15 min after injection. The radioactivity contained in these samples was counted in a calibrated NaI(Tl) scintillation detector (Perkin Elmer).
To determine the blood curve of rifampicin-treated mice, the animals were pretreated with the drug (100, 50, 37.5, 25, or 12.5 mg/kg in 100 μL of DMSO, intraperitoneally) or with vehicle (100 μL of DMSO). Rifampicin (25, 12.5, 9.37, 6.25, or 3.12 mg/kg in 100 μL of polyethylene glycol 400:saline, 30:70, v:v) or vehicle was also coinjected with the tracer. Blood samples were then taken and used to plot the area under the curve (AUC) for blood and the half-time (T1/2) values of the rapid and slow phases.
Statistical and Kinetic Analysis
Statistical analysis was performed using Prism, version 3.00 (GraphPad), and SPSS, version 19, for Windows (Microsoft). The time–activity curves were described by calculating the maximal tracer amount (Cmax) in the liver and in the gallbladder and intestines, the time point at which tracer maximized or plateaued (Tmax) in the liver, and the AUC in the liver and in the gallbladder and intestines. Additionally, as a measure of Mrp2 transport, the tracer emergence time in the gallbladder was determined, defined as the time point when the activity in the gallbladder appeared in the dynamic SPECT data. AUCs were calculated using the trapezoidal method. To obtain rifampicin dose–response curves, liver Tmax and gallbladder/intestine AUC were expressed as a function of the administered doses. Liver Tmax was a measure of 99mTc-mebrofenin uptake, and gallbladder/intestine AUC was a measure of 99mTc-mebrofenin efflux. Biexponential curve fitting was applied in generating the blood curves. T1/2 values were computed using the method of least squares. Differences between 2 groups were tested for significance using the nonparametric Mann–Whitney test for 2 groups. All experiments were performed on 3 samples (unless stated otherwise); a P value of 0.05 was considered significant.
RESULTS
In Vitro Assessment of Potential Role of OCT1
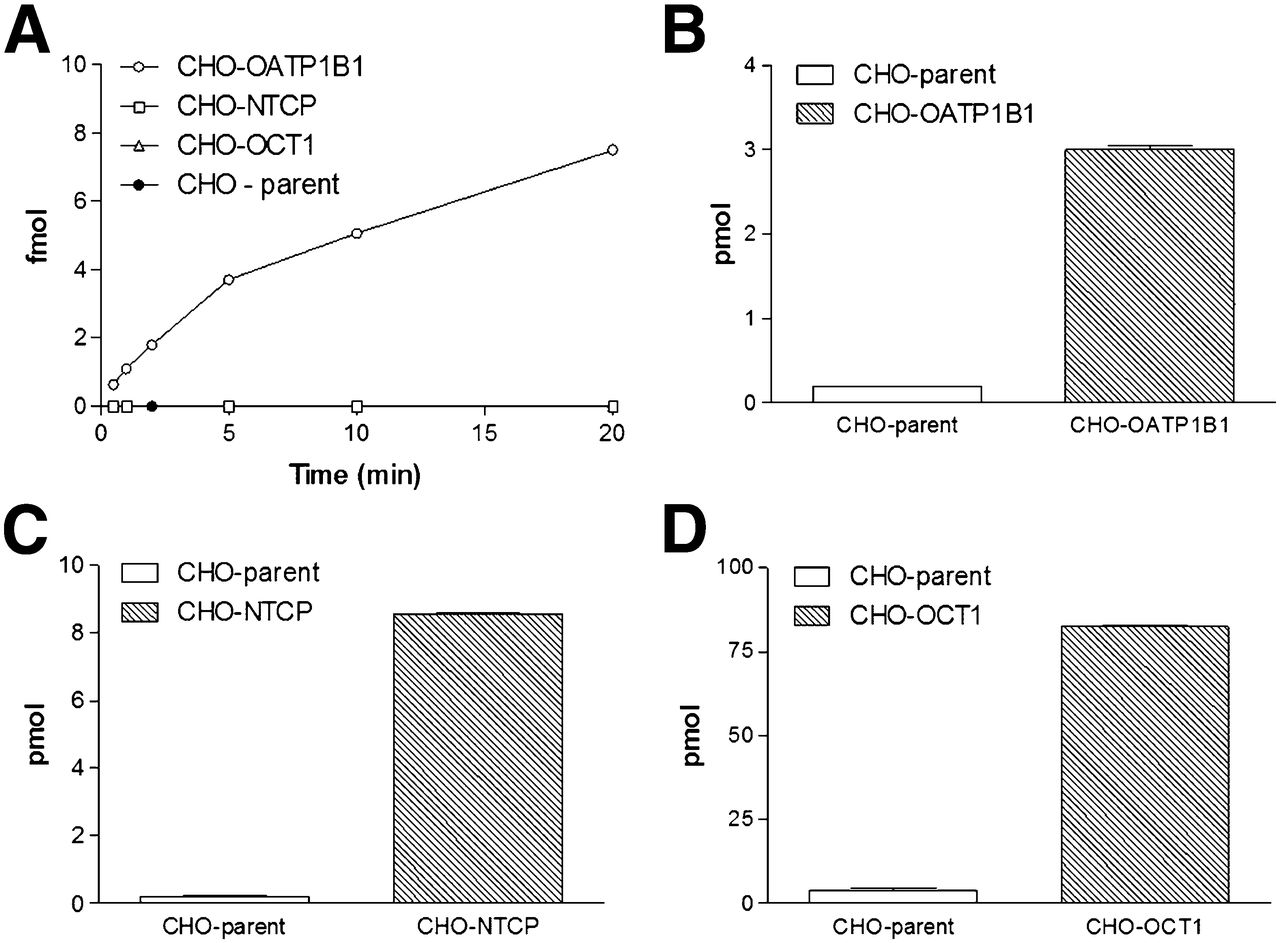
Small-scale in vitro experiments using stably transfected CHO cells and parental controls confirmed the OATP1B1-mediated transport of 99mTc-mebrofenin and a lack of detectable transport by NTCP (4,15). Not unexpectedly, in the transfected cells OCT1-mediated transport could not be demonstrated, whereas 14C-tetraethyl ammonium uptake was 21 ± 6.0-fold higher than in the parental controls (Fig. 2).

(A) 99mTc-mebrofenin uptake: mebrofenin is transported only through OATP1B1. (B–D) Positive controls: 3H-estradiol-17β-glucuronide uptake (B), 3H-taurocholate uptake (C), and 14C-tetra-ethyl-ammonium uptake (D).
Friend Virus B WT Mice
Figure 3A depicts the time–activity curves of 99mTc-mebrofenin in Friend virus B WT mice. The liver Cmax (19.2 ± 2.4 MBq) was reached after 134 ± 41 s (liver Tmax) and was followed by a rapid exponential decrease to the background level within 15 min (900 s), with a T1/2 of 148 ± 27 s. According to the dynamic SPECT data, the mean appearance time of 99mTc-mebrofenin in the gallbladder was 147 ± 26 s (Table 1). At the end of the acquisition, most of 99mTc-mebrofenin was found in the intestines.
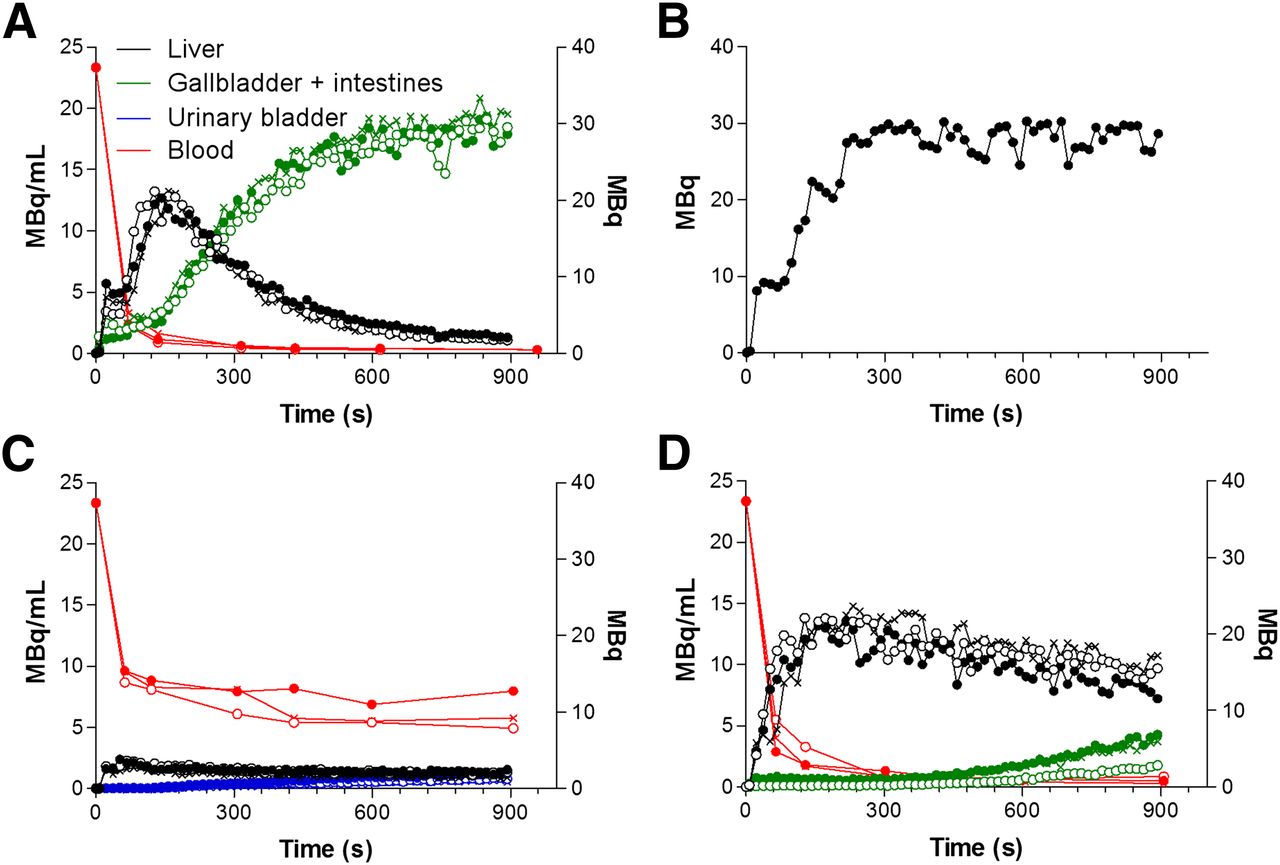
Time–activity and blood curves in 3 WT mice (A), 1 bile duct–ligated mouse (B), 3 Slco1a/1b−/−/−/− (deficient in Oatp1a/1b transporters) mice (C), and 3 Abcc2 −/− (deficient in Mrp2 transporter) knockout mice (D). Time–activity curves for liver, for gallbladder and intestine, and for urinary bladder are expressed in megabecquerels. Blood curves are expressed in mBq/mL. ● = mouse 1; ○ = mouse 2; × = mouse 3.
Metrics of Time–Activity Curves of 99mTc-Mebrofenin in WT, Slco1a/1b−/−/−/−, Abcc2−/−, and Rifampicin-Treated Mice
The venous blood curve was consistent with a 2-compartment model, characterized by an initial rapid decline of the radiopharmaceutical from the blood (fast phase), with a T1/2 of 17 ± 2 s, due to its distribution within the vascular space and the high extraction rate of 99mTc-mebrofenin by the liver. This initial decline was followed by a slower decline (slow phase) with a T1/2 of 332 ± 121 s, reflecting the lower concentration of 99mTc-mebrofenin in the blood (Table 1).
Bile Duct Ligature (BDL): Proof of Principle
Next, we investigated the effect of complete obstructive cholestasis, induced by BDL in a WT animal, on mebrofenin transport. In mice that did not undergo BDL, typical time–activity curves were obtained in the blood, the liver, and the gallbladder and intestines.
The effect of BDL, that is, obstructive cholestasis and thus a higher concentration of 99mTc-mebrofenin in the liver, is clearly seen by comparing Figure 3A with Figure 3B. Although in the time–activity curve of WT mice a peak in the liver was followed by a rapid decrease to background levels, in the time–activity curve of the BDL animal there was a continuous increase of 99mTc-mebrofenin uptake in the liver, with a maximum of 28.39 MBq. The tracer was not subsequently cleared but instead remained in the liver for up to 900 s after injection. Expressed as liver AUC (MBq⋅s), the activity was 3.5-fold higher in the liver of the BDL animal than in nontreated animals (non-BDL and BDL: 6,417 MBq⋅s and 22,202 MBq⋅s, respectively). The gallbladder/intestine AUC was 17,808 MBq⋅s in the nontreated animal and undetectable in the BDL animal. Taken together, the total activity in the liver and in the gallbladder and intestines was nearly identical in the 2 treatment groups (non-BDL, 24,225 MBq⋅s, vs. BDL, 22,202 MBq⋅s).
Role of Oatp1a/1b Transporters in Hepatic Transport of 99mTc-Mebrofenin
Subsequently, the relative role of the uptake transporter family Slc01a/1b on the hepatic handling of 99mTc-mebrofenin was determined. The time–activity curves of the Slc01a/1b−/−/−/− animals are shown in Figure 3C.
Most of 99mTc-mebrofenin activity was located in the blood and urinary bladder, with only a small amount of activity detected in the liver. 99mTc-mebrofenin levels in the gallbladder and intestines did not exceed the limit of quantification. This was in contrast to the WT mice, in which most of the 99mTc-mebrofenin was found in the gallbladder and intestines.
Specifically, the mean time–activity curve for the liver in Slco1a/1b knockout mice did not exceed baseline levels. The liver AUC was 3.4-fold lower in Slco1a/1b knockout mice than in WT animals (P = 0.014) (Table 1). At the final time point, 4.1% of the injected dose was present in the urinary bladder. In the blood, the mean AUC was 5.1-fold larger in the Slco1a/1b knockout mice than in their WT counterparts (P = 0.01) (Fig. 3C; Table 1).
Role of Mrp2 Transporter in Hepatic Transport of 99mTc-Mebrofenin
The distribution of 99mTc-mebrofenin to the livers of Abcc2-deficient mice was similar to that observed in WT mice (Fig. 2D; Table 1). This observation was supported by similar Cmax (P = 0.15) values between the 2 genotypes. Overall, the liver AUC of Abcc2 knockout mice was 2.3-fold higher than that of WT mice (P = 0.009) (Table 1), mainly because of the impaired hepatic clearance (Fig. 2D). In line with the observations from WT animals, the activity in the urinary bladder was too low to be quantified.
As shown in Table 1, activity in the gallbladder was observed after 375 ± 63 s in Abcc2-deficient animals, compared with 147 ± 26 s in their WT counterparts (P = 0.009). The gallbladder/intestine AUC was 4.7-fold lower in the Abcc2-deficient mice than in the WT mice (P = 0.001).
The blood curve (Fig. 2D) and corresponding metrics (Table 1) of the Abcc2−/− mice were comparable to those of the WT mice (P values for the rapid phase, slow phase, clearance, and AUC were 0.65, 0.88, 0.07 and 0.06, respectively).
Effect of Different Rifampicin Doses on Hepatic Transport of 99mTc-Mebrofenin
The data generated thus far allowed us to investigate mechanistically the role of uptake and efflux transporters in the in vivo disposition of 99mTc-mebrofenin. With this framework established, we aimed to determine whether it was possible to discriminate dose-dependently between the inhibition of hepatic uptake transporters and that of efflux transporters. Because rifampicin is both a substrate and an inhibitor of OATPs and MRP2, it was selected as the test agent.
The time–activity curves of the vehicle-control and rifampicin-treated (highest dose, 100 mg/kg intraperitoneally, 25 mg/kg intravenously) mice are shown in Figure 4. The time–activity curves in the control mice were similar to those in the untreated WT mice. The metrics of the different rifampicin doses are shown in Table 1.
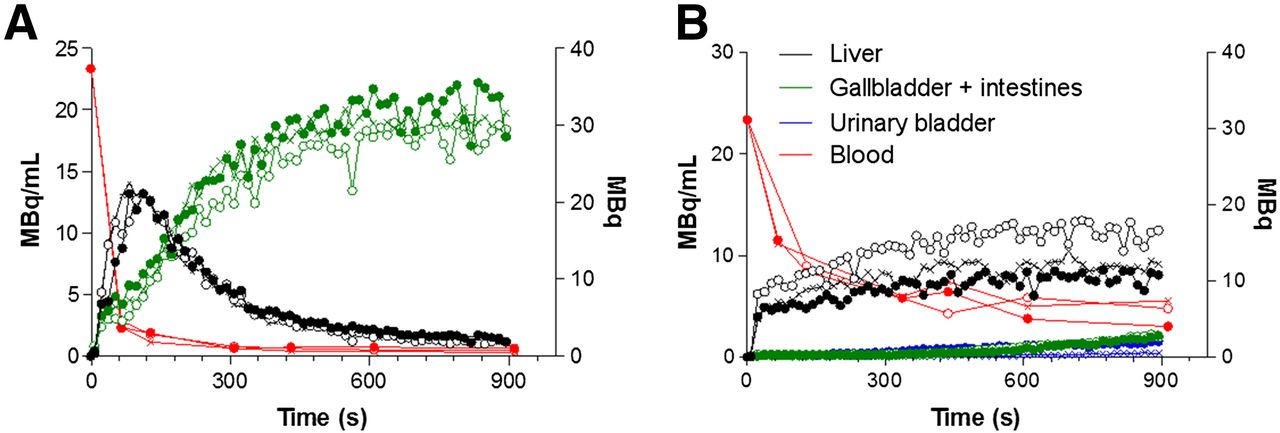
Time–activity and blood curves in 3 vehicle-control mice (A) and in 3 rifampicin-treated mice (B). Time–activity curves for liver, for gallbladder and intestine, and for urinary bladder are expressed in megabecquerels. Blood curves are expressed in MBq/mL. ● = mouse 1; ○ = mouse 2; × = mouse 3.
The liver Tmax was 5.1-fold higher in mice treated with the highest dose of rifampicin than in vehicle-control mice (P = 0.042), whereas the liver AUC was 1.6-fold higher (P = 0.034). Moreover, the mean emergence time of tracer activity in the gallbladder was prolonged 4.0-fold in rifampicin-treated mice (P = 0.025) whereas the gallbladder/intestine AUC decreased by a factor of 10 (P = 0.001). A urinary bladder time–activity curve could be determined in the rifampicin-treated mice but not in the vehicle-control mice.
The mean blood AUC in mice treated with the highest dose of rifampicin was 4.3-fold greater than that in their vehicle-control counterparts (P = 0.006). Additionally, T1/2 values were 2.8-fold higher (P = 0.032 and P = 0.034 for the rapid and slow phases, respectively).
The rifampicin dose–response curves evidenced the effect of the drug on 99mTc-mebrofenin uptake and efflux, with higher doses leading to a delayed liver Tmax and to a lower gallbladder/intestine AUC (Table 1; Supplemental Fig. 1 [supplemental materials are available online only at http://jnm.snmjournals.org]).
DISCUSSION
Drug-induced liver injury is one of the leading causes for the withdrawal of approved drugs from the market (9), highlighting the importance of assessing this effect early on in drug research. One of the underlying causes of drug-induced liver injury is an altered functional activity of hepatic uptake or efflux transporters. In this study, we investigated 99mTc-mebrofenin transport through Oatp and Mrp2. On the basis of the results, we were able to propose a noninvasive method to visualize and quantify altered hepatobiliary transporter activity. Moreover, the proposed method enables differentiation between altered influx and efflux. By using dynamic SPECT measurements to calculate time–activity curves that quantify transport via the liver to the gallbladder and intestines, our method offers a novel approach, as thus far it has not been possible either to visualize or quantify in vivo hepatic drug interactions and the differentiation between uptake and efflux alterations.
Mice express 8 Oatp1a/1b transporters whereas humans express only 3 OATP transporters (OATP1A/1B1, OATP1A/2B1, and OATP1A/1B3). Here, the specificity for mebrofenin was investigated by means of CHO cell lines expressing these human transporters. Our data confirmed the results of Ghibellini et al. (4). Additionally, the current study was able to exclude OCT1 as a mebrofenin transporter.
The primary aim of our study was the visualization of disturbed hepatobiliary transporter function. As proof of principle, a BDL was placed so as to simulate extrahepatic cholestasis. This mechanical inhibition caused the complete obstruction of bile flow and subsequently the accumulation of 99mTc-mebrofenin in the liver, thus demonstrating the ability of the proposed method to visualize and quantify disturbances in hepatobiliary transport.
To examine the possibility of distinguishing between uptake and efflux transporter alterations, Slco1a/1b and Abcc2 knockout mice were investigated. Experiments in the Slco1a/1b knockout mice confirmed the critical role played by transporters of the Oatp1a/1b family in the hepatic uptake of 99mTc mebrofenin, consistent with the findings of van de Steeg et al. (14). The time–activity curves of Slco1a/1b knockout mice did not exceed baseline levels, because of the impaired hepatic uptake of mebrofenin. Consequently, blood concentrations were elevated,
We were also able to show that the biliary efflux transporter Mrp2 is involved in 99mTc-mebrofenin transport. Specifically, in Abcc2 knockout mice the absence of the efflux transporter led to the hepatic accumulation of 99mTc-mebrofenin, reflected in a higher AUCliver. Consequently, less 99mTc-mebrofenin reached the gallbladder and intestines, resulting in a lower gallbladder/intestine AUC and a delayed tracer emergence time. The corresponding blood concentrations were comparable to those of the WT animals, since hepatic uptake was not disturbed.
To assess the effect of pharmacologic inhibition on transporter activity, rifampicin was administered to WT mice, by both the intraperitoneal and the intravenous routes. This double administration led to the impaired uptake and efflux of 99mTc-mebrofenin. Inhibition of mebrofenin uptake occurs at the level of the basolateral (sinusoidal) Oatps, with rifampicin acting as a competitive inhibitor of the transporters (20). Because hepatic uptake was impaired, the liver Tmax of mebrofenin was delayed and blood concentrations of the tracer were elevated. Additionally, urinary elimination of 99mTc-mebrofenin was increased in rifampicin-treated mice. This increase in renal excretion reflected the decreased uptake of 99mTc-mebrofenin through Oatp1a/1b and the increased blood concentrations (higher blood AUC). Rifampicin is both a substrate and an inhibitor of Oatps. Therefore, a certain amount of rifampicin (dependent on the dose) is able to enter hepatocytes, where it inhibits the Mrp2 transporter at the level of the canalicular membrane. Consequently, an accumulation of mebrofenin in the liver (higher liver AUC) can be detected, whereas the decreased amounts of mebrofenin in the intestines are due to a combination of Oatp and Mrp2 inhibition (lower gallbladder/intestine AUC). These observations suggest that the impaired liver uptake and efflux are caused by a combination of rifampicin-mediated Oatp1a/1b and Mrp2 inhibition (15,21). To the best of our knowledge, Mrp2 inhibition has not been previously shown in vivo. Our study demonstrated the feasibility of visualizing and quantifying the effect of Oatp1a/1b and Mrp2 modulation by various drugs in vivo, with rifampicin as a model drug, and confirmed the findings of van de Steeg et al. (14) with methotrexate and tritium-labeled fexofenadine.
Additionally, we were able to show that slight alterations in transporter activity can be detected with the proposed method. From mice administered 5 different rifampicin doses, a dose–response curve of the rifampicin-mediated inhibition of 99mTc-mebrofenin transport was obtained. The data demonstrated a dose-dependent effect on the uptake and efflux of 99mTc-mebrofenin. Higher doses of rifampicin delayed the liver Tmax and caused a smaller gallbladder/intestine AUC, representing decreases in hepatic uptake and decreases in efflux to the gallbladder and intestines, respectively. Although Mrp2 inhibition occurred at low rifampicin concentrations (12.5 mg/kg intraperitoneally, 6.25 mg/kg intravenously), Oatp inhibition was first seen at higher concentrations of the drug (37.5 mg/kg intraperitoneally, 9.37 mg/kg intravenously).
CONCLUSION
This study showed that it is possible to discriminate quantitatively between the lack of functional activity of sinusoidal uptake and that of biliary efflux transporters. The method described herein therefore offers a promising approach to investigate the interaction between new chemical entities and hepatobiliary transporters. The current study visualized and quantified hepatic uptake and biliary efflux of 99mTc-mebrofenin in WT, Slco1a/1b knockout, Abcc2 knockout, and rifampicin-treated mice. The data demonstrated that the transport activities of Oatp1a/1b (hepatic uptake) and Mrp2 (biliary efflux) can be quantified simultaneously in vivo. Moreover, pharmacologic modulation of these activities could be demonstrated in a dose-dependent manner using rifampicin as a model drug.
DISCLOSURE
The costs of publication of this article were defrayed in part by the payment of page charges. Therefore, and solely to indicate this fact, this article is hereby marked “advertisement” in accordance with 18 USC section 1734. IWT Belgium and the GROUP-ID consortium provided financial support. No other potential conflict of interest relevant to this article was reported.
Acknowledgments
We thank Scharon Bruneel for her contributions to the imaging experiments.
Footnotes
↵* Contributed equally to this work.
Published online Feb. 25, 2013.
- © 2013 by the Society of Nuclear Medicine and Molecular Imaging, Inc.
REFERENCES
- Received for publication May 7, 2012.
- Accepted for publication October 18, 2012.


Jump to section
Related Articles
Cited By...
- Assessing Pleiotropic Effects of a Mixed-Mode Perpetrator Drug, Rifampicin, by Multiple Endogenous Biomarkers in Dogs
- Repurposing 99mTc-Mebrofenin as a Probe for Molecular Imaging of Hepatocyte Transporters
- Hepatocyte Concentrations of Imaging Compounds Associated with Transporter Inhibition: Evidence in Perfused Rat Livers
- Ubiquitin Ligase COP1 Controls Hepatic Fat Metabolism by Targeting ATGL for Degradation
- The Role of Organic Anion Transporters in Diagnosing Liver Diseases by Magnetic Resonance Imaging
- Evidence of Drug-Drug Interactions through Uptake and Efflux Transport Systems in Rat Hepatocytes: Implications for Cellular Concentrations of Competing Drugs