


Article Figures & Data
Figures
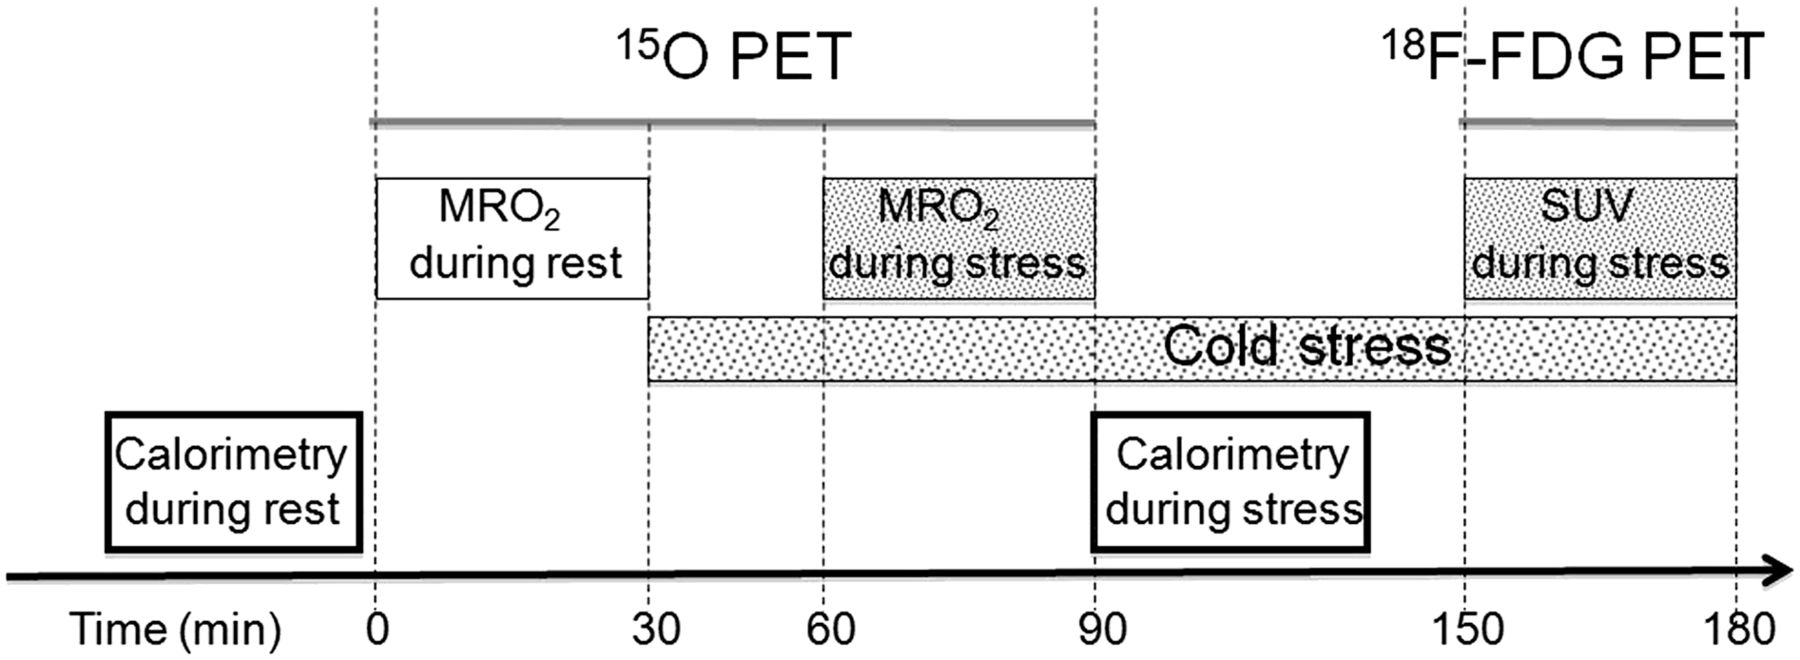
- FIGURE 1.
PET protocol used to quantify MRO2 in BAT at rest and during cold stress. After quantitative assessment of oxidative metabolism, patient underwent 18F-FDG PET/CT to correlate MRO2 with 18F-FDG–derived SUV measures. Indirect calorimetry was performed at rest and during exposure to cold stress.
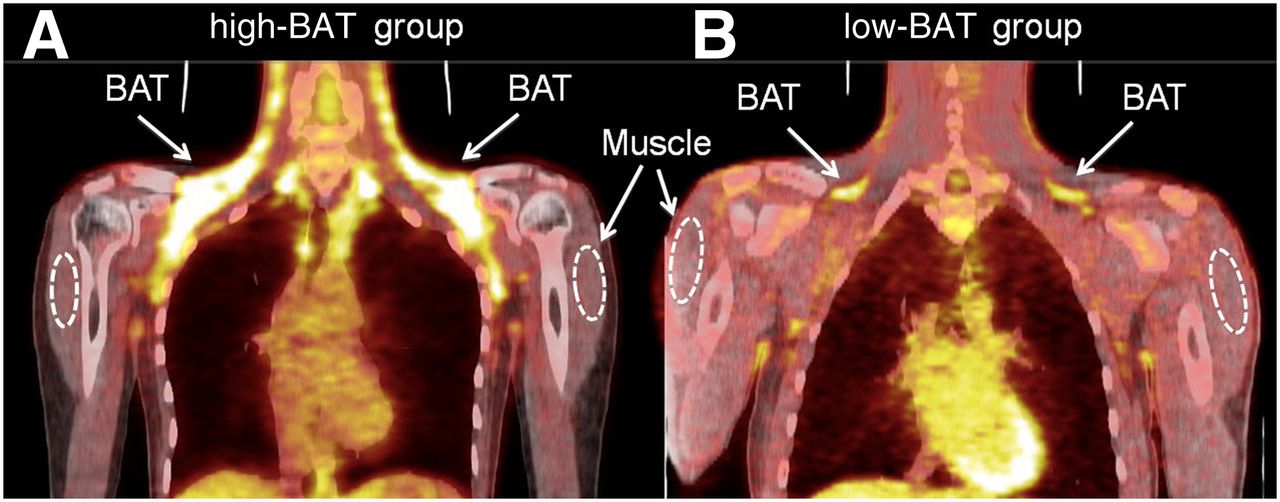
- FIGURE 2.
Representative images showing BAT 18F-FDG uptake in subjects belonging to high-BAT and low-BAT groups. Presence of cold-activated BAT was derived on basis of combined conditions of HU range (−250 to −50) and SUV > 2. ROIs were defined at location of shoulder muscle (broken line) and WAT (not shown). (A) Nine of 25 subjects showed spatially extensive cold-activated BAT (high-BAT group, mass > 10 g). (B). The remaining 16 subjects showed either no cold-activated BAT or only small depots (low-BAT group, mass < 10 g).
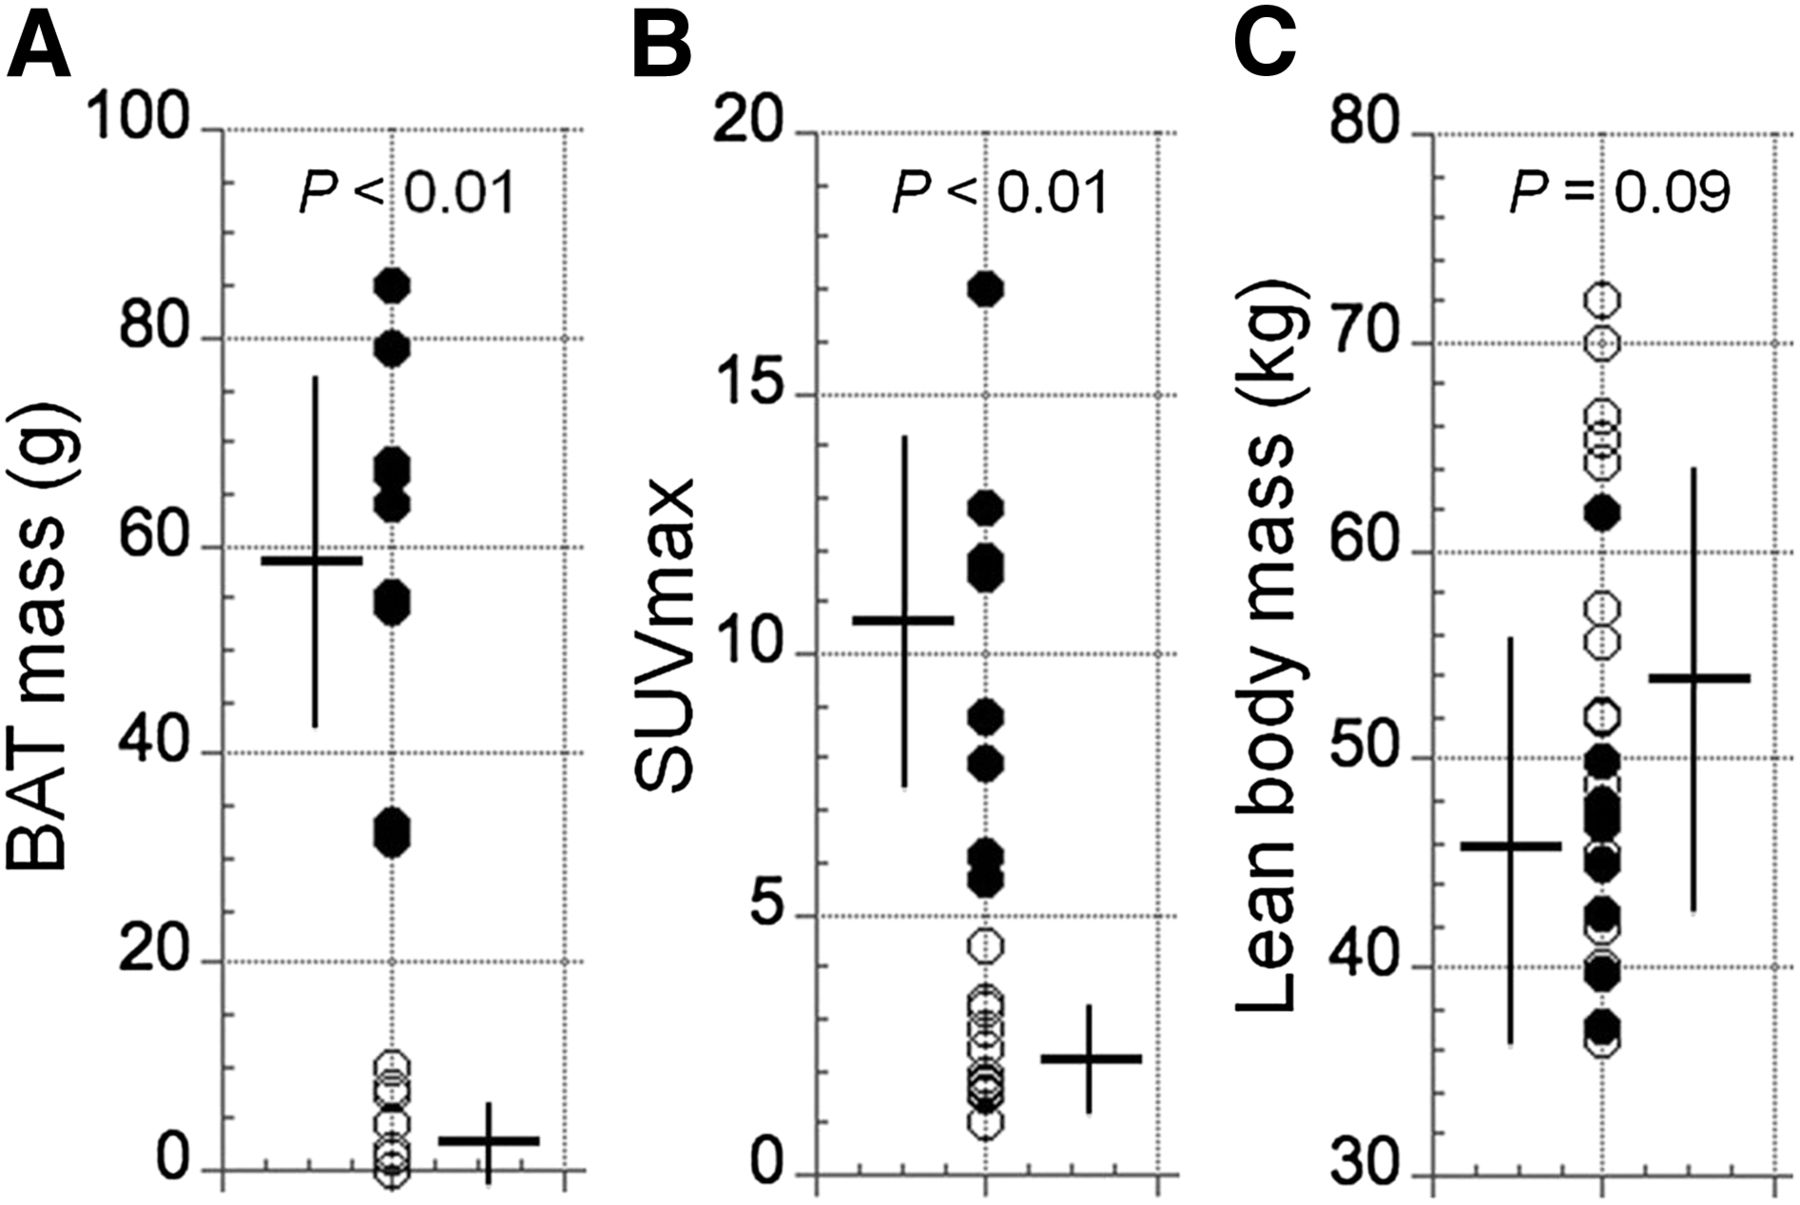
- FIGURE 3.
Distribution of amount of BAT mass, maximal SUV, and lean body mass in high-BAT group (●, n = 9, 8 women and 1 man) and in low-BAT group (○, n = 16, 7 women and 9 men). Error bars represent SD of measurements. (A) Amount of BAT mass was highly variable, displaying bimodal distribution. Accordingly, subjects were stratified into high-BAT and low-BAT groups. (B) Maximal SUV in BAT was significantly higher in high-BAT group than in low-BAT group (P < 0.01). (C) Because of higher male-to-female ratio in low-BAT group, lean body mass showed tendency toward higher values in low-BAT group.
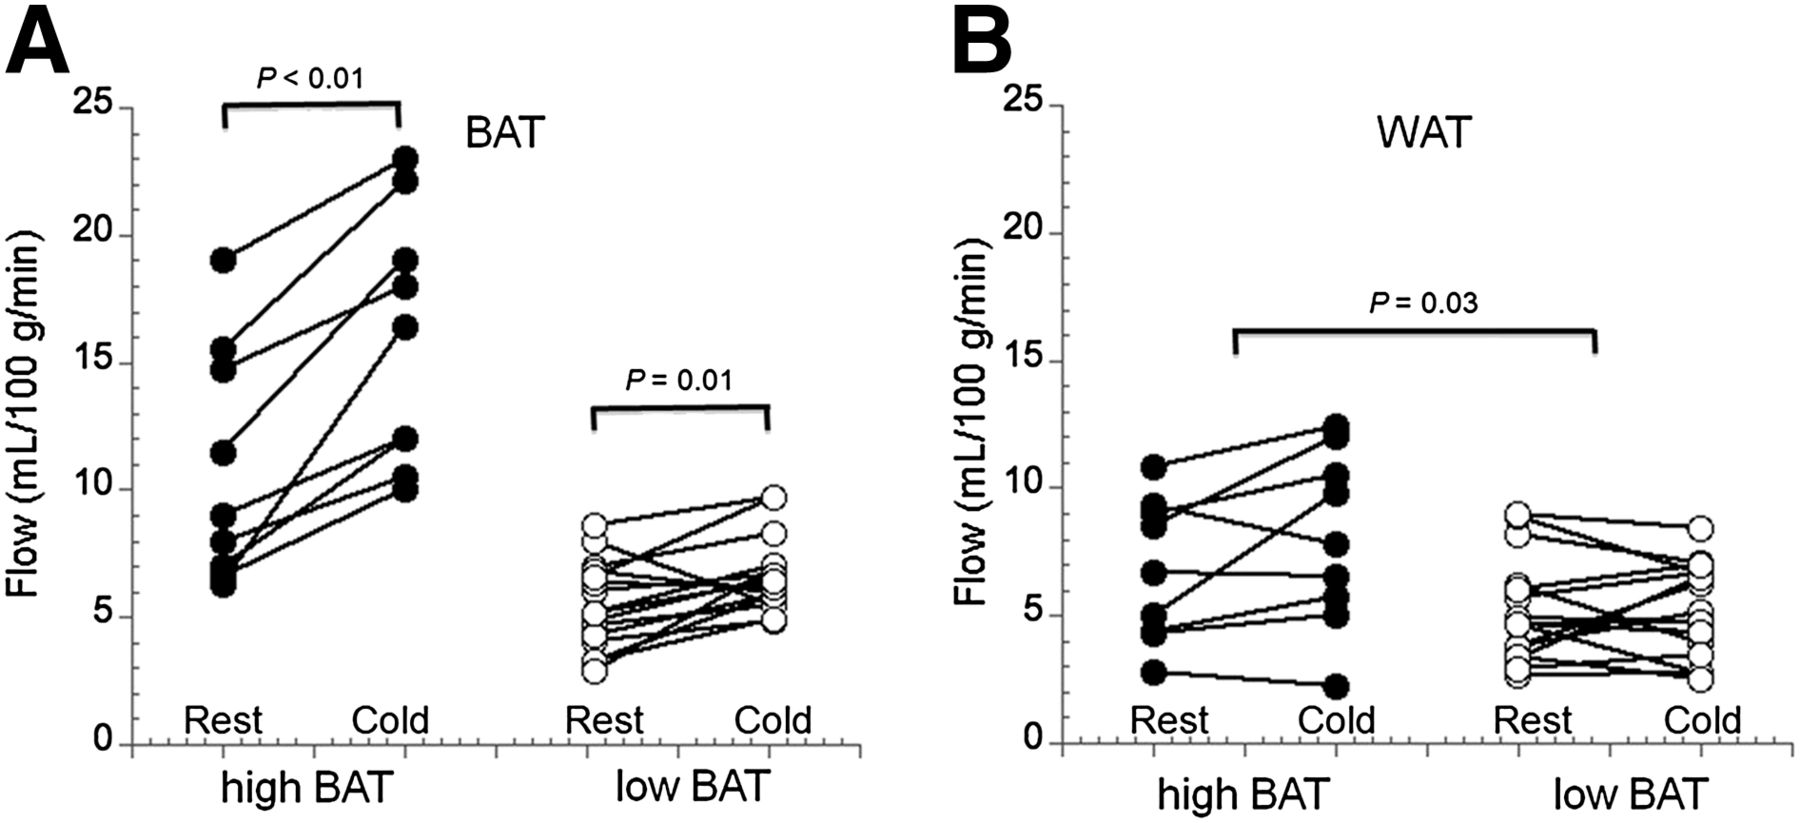
- FIGURE 4.
Absolute blood flow during rest and cold stress in BAT and WAT in high-BAT and low-BAT groups. (A) Blood flow in activated BAT (high-BAT) is about 50% higher than in nonactivated BAT (low-BAT). Increase in blood flow was significantly higher in high-BAT group than in low-BAT group, although both increases were significant between rest and cold stress. (B) Blood flow in WAT was significantly higher in high-BAT group at both rest and cold stress than in low-BAT group. However, no significant differences were observed between rest and cold stress in either group.
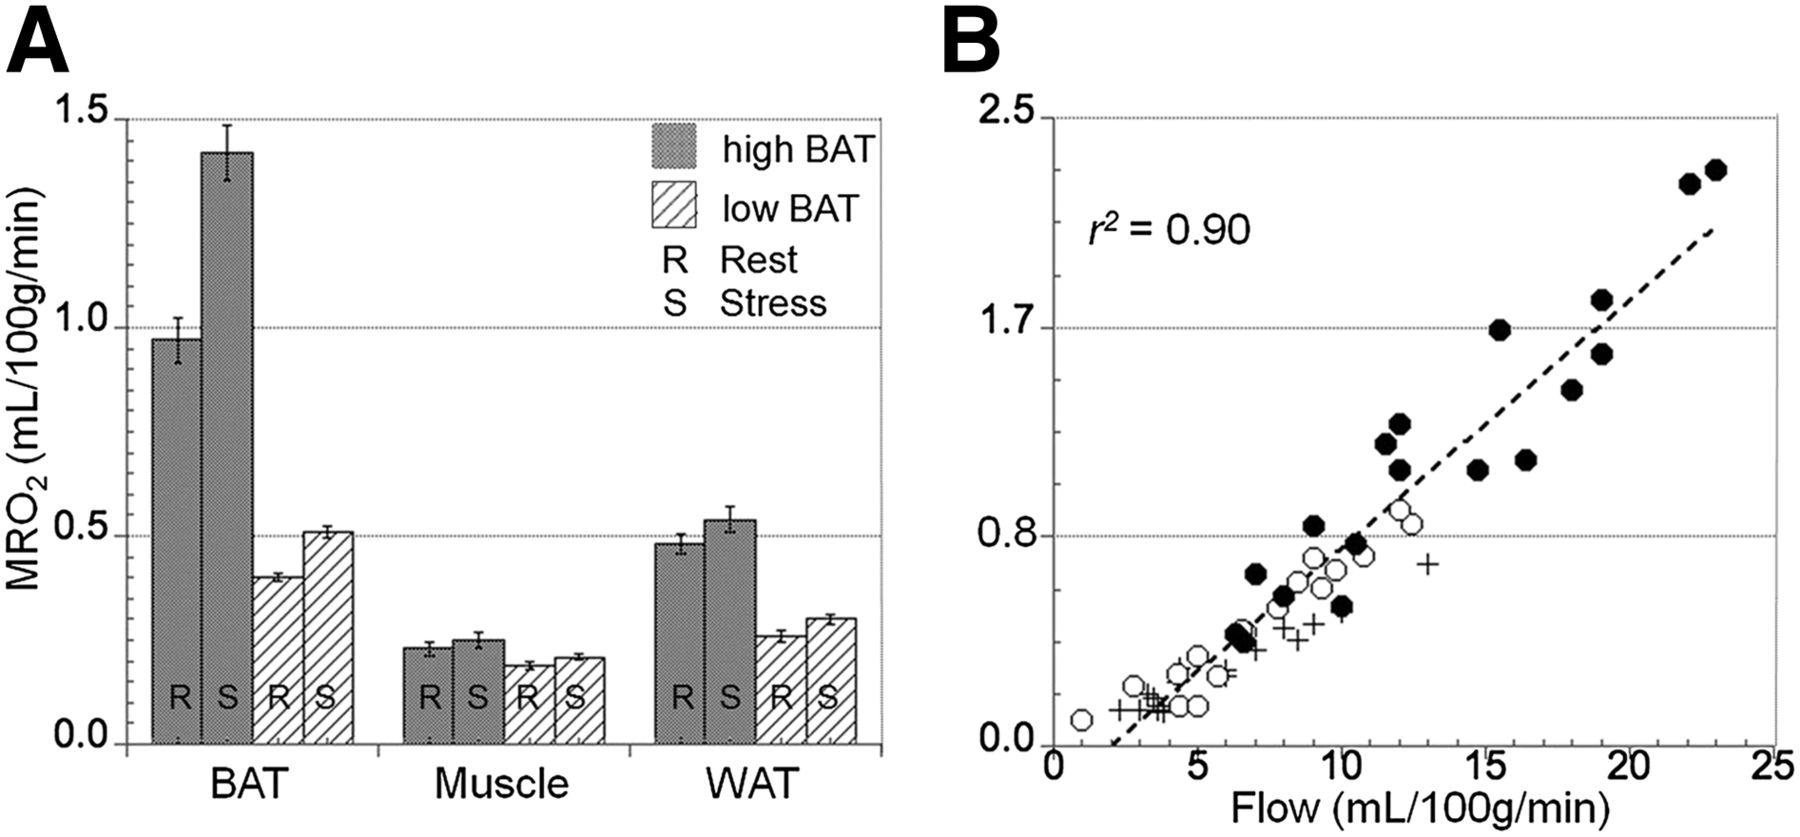
- FIGURE 5.
MRO2 in BAT, muscle, and WAT observed in high-BAT and low-BAT groups. Error bars represent SEM. (A) In high-BAT group, MRO2 in BAT at rest was about twice as high as that in low-BAT group. After cold exposure, MRO2 increased by about 50% in high-BAT group but remained at same level in low-BAT group. In contrast, MRO2 in WAT was higher in low-BAT group both at rest and at cold exposure. Finally, MRO2 in muscle was similar for both groups at rest and after cold exposure. (B) Highly significant correlation (P = 0.01) was observed between MRO2 in BAT (●), WAT (○), and muscle (×) tissue, indicating that tissue perfusion is main determinant of oxidative metabolism in all 3 types of tissue.
- FIGURE 6.
(A) Relationship between blood flow in BAT (both at rest and during stress) and BAT DEE (●), as well as estimates of upper limit for BAT DEE (○), calculated using almost complete oxygen extraction (OEF = 0.95) and generous estimate of activated BAT mass (SUV threshold of 1.5). Maximal contribution of activated BAT to DEE is in range of 15–25 kcal/d. We determined significant correlation (P = 0.03), indicating that tissue perfusion is an important determinant of DEE in activated BAT. (B) Correlation between maximal SUV in BAT and DEE in those subjects who had SUV > 2.0 (indicative of activated BAT). We found significant correlation between glucose uptake and DEE (P = 0.02).
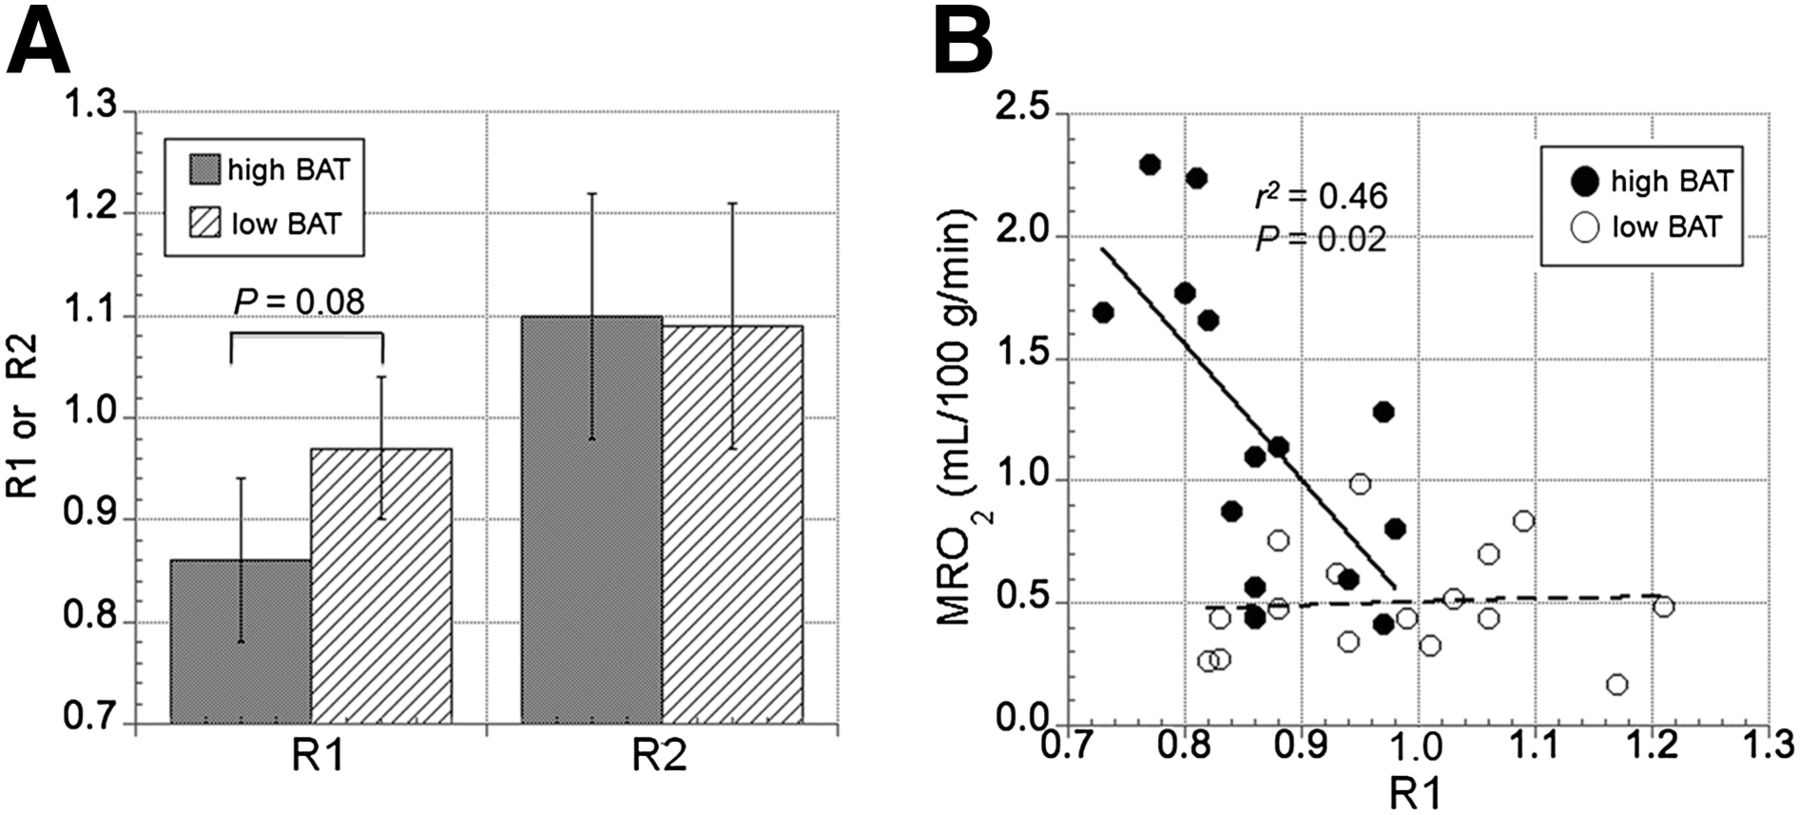
- FIGURE 7.
NIRS-derived measures (R1 and R2) in BAT and WAT. (A) Comparison between R1 and R2 in high-BAT (gray bars) and low-BAT (hatched bars) groups. Consistent with higher BAT oxygen depletion in high-BAT group, R1 ratio in this group tended to be significantly lower than in low-BAT group (P = 0.08). R2 ratios were similar in both groups, indicating that oxygen demand in abdominal subcutaneous WAT is comparable in the 2 groups. (B) Relationship between BAT MRO2 and R1 in both high-BAT (●) and low-BAT (○) groups. Significant correlation between R1 and MRO2 was observed in high-BAT group, indicating higher oxygen depletion in venous blood (reflected in low R1 values) at high MRO2 in BAT. In contrast, no significant relationship between R1 and MRO2 was found in low-BAT group.


Tables
All subjects Women only Parameter High BAT (n = 9) Low BAT (n = 16) P High BAT (n = 8) Low BAT (n = 7) P Age (y) 29.6 ± 5.5 31.4 ± 9.7 NS 28.8 ± 5.2 29.9 ± 7.6 NS LBM (kg) 46.5 ± 7.1 54.1 ± 11.0 0.04 45.0 ± 3.3 43.9 ± 5.3 NS BMI (kg/m2) 22.1 ± 3.1 24.7 ± 3.9 NS 21.3 ± 2.4 22.7 ± 4.5 NS BSA (m2) 1.73 ± 0.17 1.89 ± 0.25 NS 1.70 ± 0.14 1.69 ± 0.14 NS BAT mass (g) 59.1 ± 17.5 2.2 ± 3.6 0.01* 56.6 ± 17.0 1.7 ± 4.3 0.01* Maximal SUV 10.7 ± 3.9 2.1 ± 0.9 0.01 10.7 ± 3.9 1.8 ± 0.6 0.01 RQ 0.83 ± 0.06 0.91 ± 0.10 0.08 0.84 ± 0.06 0.88 ± 0.04 NS ΔRQ (%) 0.2 ± 8.8 −3.53 ± 9.2 NS −0.9 ± 8.7 −0.03 ± 11.5 NS DEE (kcal/d) 1,452 ± 242 1,676 ± 480 NS 1,458 ± 258 1,256 ± 209 NS ΔDEE (%) 17.4 ± 15.0 0.4 ± 15.6 0.04 18.0 ± 16.1 13.6 ± 11.3 NS ↵* Nonparametric Mann–Whitney U test.
NS = not significant at the 0.05 level; LBM = lean body mass; BMI = body mass index; BSA = body surface area; RQ = respiratory quotient.
Supplemental Data
Files in this Data Supplement:


Jump to section
Related Articles
Cited By...
- Shivering, but not adipose tissue thermogenesis, increases as a function of mean skin temperature in cold-exposed men and women
- Opportunities and challenges in the therapeutic activation of human energy expenditure and thermogenesis to manage obesity
- Energy metabolism in cachexia
- Cannabinoid Type 1 Receptors Are Upregulated During Acute Activation of Brown Adipose Tissue
- Recent advances in the detection of brown adipose tissue in adult humans: a review
- Accurate quantification of brown adipose tissue mass by xenon-enhanced computed tomography
- Sympathetic Innervation of Cold-Activated Brown and White Fat in Lean Young Adults
- Tea catechin and caffeine activate brown adipose tissue and increase cold-induced thermogenic capacity in humans
- Brown Adipose Tissue, Not Just a Heater
- MECHANISMS IN ENDOCRINOLOGY: Brown adipose tissue in humans: regulation and metabolic significance
- Short-term Cold Acclimation Recruits Brown Adipose Tissue in Obese Humans
- Breaking BAT: can browning create a better white?
- Plasma irisin in runners and nonrunners: no favorable metabolic associations in humans
- Detection of brown adipose tissue and thermogenic activity in mice by hyperpolarized xenon MRI
- Brown Adipose Tissue and the Cold War Against Obesity
- Adipogenesis: new insights into brown adipose tissue differentiation