


Abstract
Through PET imaging, our laboratory has studied the dynamic biodistribution of 11C-verapamil, a P-gp substrate, in the nonhuman primate Macaca nemestrina. To gain detailed insight into the kinetics of verapamil transport across the blood–brain barrier (BBB) and the blood–placental barrier (BPB), we analyzed these dynamic biodistribution data by compartmental modeling. Methods: Thirteen pregnant macaques (gestational age, 71–159 d; term, ∼172 d) underwent PET imaging with 11C-verapamil before and during infusion (6, 12, or 24 mg/kg/h) of cyclosporine A (CsA, a P-glycoprotein [P-gp] inhibitor). Dynamic 11C-verapamil brain or fetal liver (reporter of placental P-gp function) activity was assessed by a 1- or 2-tissue-compartment model. Results: The 1-tissue-compartment model best explained the observed brain and fetal liver distribution of 11C-radioactivity. When P-gp was completely inhibited, the brain and fetal liver distribution clearance (K1) approximated tissue blood flow (Q); that is, extraction ratio (K1/Q) was approximately 1, indicating that in the absence of P-gp function, the distribution of 11C-verapamil radioactivity into these compartments is limited by blood flow. The potency of CsA to inhibit P-gp was tissue-independent (maternal BBB half-maximal inhibitory concentration [IC50], 5.67 ± 1.07 μM, vs. BPB IC50, 7.63 ± 3.16 μM). Conclusion: We propose that on deliberate or inadvertent P-gp inhibition, the upper boundary of increase in human brain (or fetal) distribution of lipophilic drugs such as verapamil will be limited by tissue blood flow. This finding provides a means to predict the magnitude of P-gp–based drug interactions at the BBB and BPB when only the baseline distribution of the drug (i.e., in the absence of P-gp inhibition) across these barriers is available through PET. Our data suggest that P-gp–based drug interactions at the human BBB and BPB can be clinically significant, particularly for those P-gp substrate drugs for which P-gp plays a significant role in excluding the drug from these privileged compartments.
The multidrug-resistance protein P-glycoprotein (P-gp) is considered, on the basis of rodent studies, to be the most important efflux transporter at the blood–brain barrier (BBB) because of its high level of expression at the luminal membrane in brain capillary endothelial cells and its ability to exclude a wide variety of drugs and endogenous substances from the central nervous system (1). Drug removal protects the central nervous system from potential neurotoxic effects but also prevents effective pharmacotherapy of neurologic diseases. These rodent studies have also shown that P-gp is highly expressed at the blood–placental barrier (BPB), where it limits drug delivery to the fetus (e.g., HIV protease inhibitors) (2). Alternatively, the barrier may protect the fetus from toxicity from maternal cancer chemotherapy (3).
Although these rodent studies have demonstrated significant P-gp activity at the BBB and BPB, it is not clear whether the same magnitude of activity is present at the human BBB and BPB. We and others have begun to address this question through measurement of P-gp activity at the human BBB, in the presence and absence of P-gp inhibitors, using various P-gp PET ligands (e.g., 11C-verapamil) and inhibitors (e.g., cyclosporine A [CsA]; tariquidar) (4–7). However, for ethical reasons, it is not possible to conduct such studies to determine the magnitude of P-gp activity at the human BPB. Moreover, complete inhibition of P-gp at the human BBB (and possibly BPB) with the prototypic P-gp inhibitor, CsA, is not possible because of the potential toxicity of this inhibitor when administered at doses necessary to produce such an effect (8). Therefore, we conducted 11C-verapamil dynamic biodistribution studies in a representative animal model, the nonhuman primate Macaca nemestrina, in which it is possible to administer doses of CsA that can completely inhibit P-gp. We published the nonparametric analysis of the results of these whole-body PET studies and showed an increased distribution (as measured by the ratio of the areas under the concentration–time curve [AUCs] for tissue and plasma) of 11C-radioactivity across the BBB and the BPB, with minimal or no changes in distribution of 11C-radioactivity into other organs such as the maternal liver, spleen, and kidneys (9,10). To gain detailed insight into the transport kinetics of 11C-verapamil radioactivity into macaque tissues with and without P-gp modulation, we analyzed these macaque data using compartmental modeling.
Our human PET study examining inhibition of P-gp at the BBB using 11C-verapamil as a model P-gp substrate and CsA as a model P-gp inhibitor showed that inhibition of P-gp increased the plasma (or blood)-to-brain distribution clearance (K1) of 11C-verapamil radioactivity rather than the efflux rate constant k2 (6). Moreover, by examining regional P-gp activity at the BBB with 11C-verapamil and CsA, we showed that in the absence of functional P-gp activity (e.g., pituitary), the K1 of lipophilic P-gp ligands (such as verapamil) into the brain is limited by delivery (i.e., by regional cerebral blood flow) (Q) (7). Hence, we proposed that the extraction ratio (ER = K1/Q) is a better index of P-gp activity than is K1. In the presence of P-gp, the brain ER of lipophilic ligands such as 11C-verapamil can be low, and therefore the blood-flow dependence of K1 into the tissue may not be apparent. However, the ER of these tracers can increase substantially once P-gp activity is inhibited, and consequently, the delivery of P-gp substrates can become perfusion-dependent (11). Our ability to completely inhibit P-gp by CsA in the macaque provided us an opportunity to test the hypothesis that, as is the case in humans, inhibition of P-gp at both the BBB and BPB in the macaque is reported by 11C-verapamil K1 (and ER), not k2, and that the upper boundary of K1 of a lipophilic P-gp ligand (e.g., 11C-verapamil) is limited by tissue blood flow. Several groups have shown that inhibition of P-gp may be tissue-dependent (12). On the basis of these data, we also asked whether CsA inhibition of P-gp at the BBB and the BPB in the macaque is tissue-dependent.
Therefore, the goals of our investigation were 3-fold: first, to confirm, through compartmental modeling, that inhibition of P-gp at both the BBB and BPB in the macaque is reported by 11C-verapamil K1 and ER and not k2; second, to address whether the magnitude of K1 of a lipophilic drug (e.g., verapamil), in the absence of P-gp function, is limited by tissue blood flow; and third, to determine whether the in vivo potency (half-maximal [50%] inhibitory concentration, or IC50) of P-gp inhibition by CsA at both the BBB and BPB is tissue-dependent.
MATERIALS AND METHODS
PET Imaging
All experimental procedures were approved by the University of Washington Animal Care Committee. The study design (Fig. 1) has been previously published (9,10) and is briefly summarized in the supplemental data available online at http://jnm.snmjournals.org. Blood and plasma radioactivity from 15O-water, 11C-verapamil, and 11C-CO substudies was measured by a γ-counter (Cobra Counter; Packard Corp.). Plasma 11C-verapamil and metabolite concentrations were determined by solid-phase extraction/HPLC analysis as previously described (13).
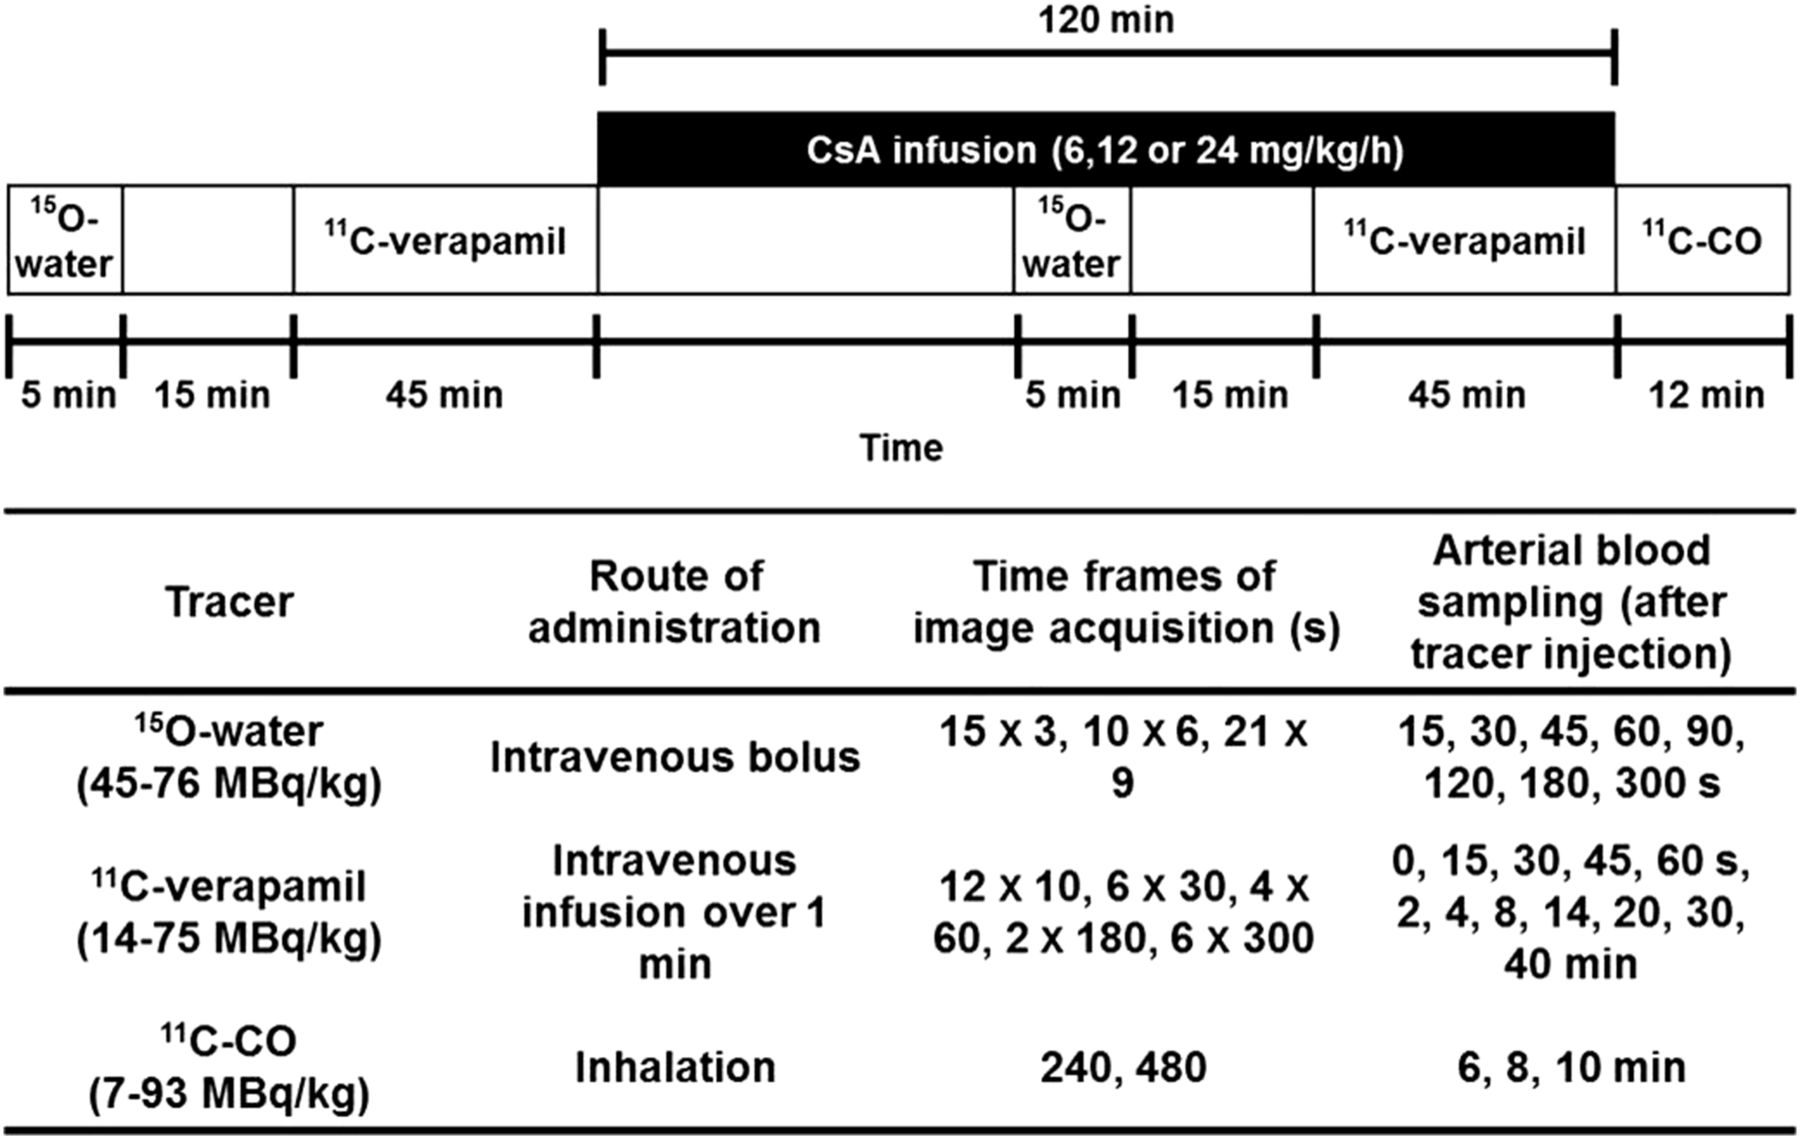
Schematic of PET protocol.
Model Input Function
Briefly, metabolite assays of plasma after 11C-verapamil administration resulted in 3 fractions: unchanged verapamil, D617/D717 (formed by dealkylation, henceforth referred to as D617), and other metabolites (formed by N-demethylation, referred to as polar metabolites) (13). An exponential function was fitted to these metabolite analysis data to derive the fraction of verapamil, D617, and polar metabolites in arterial plasma (Supplemental Fig. 1A), as described previously (6). These analyses were used to provide a metabolite-corrected input function (CVER, unchanged verapamil; CVD, combined activity of verapamil and D617) used for compartmental modeling (Supplemental Fig. 1B). In animals (macaques 4, 5, and 15) for which plasma verapamil and metabolite profiles were not determined, a population (mean) metabolite fraction curve, generated from the animals for which these curves were available, was used. In pilot studies, the blood-to-plasma ratio of 11C-verapamil radioactivity was found to be 1.0. Hence, input functions based on plasma concentration measurements were considered to be equivalent to those based on blood concentration measurements.
Verapamil Compartmental Modeling
Either a 1-tissue-compartment (1C) or 2-tissue-compartment (2C) model was fitted to the 11C-verapamil data using PMOD, version 3.0 (PMOD Technologies Ltd.) (6). The estimated model parameters included delay, K1, and k2 in the 1C model and K1, k2, k3, and k4 in the 2C model. The correction for vascular space activity in brain tissue regions of interest and fetal liver regions of interest was done by fixing fraction blood volume, Vb, to values measured directly from the tissue blood volume analysis from a 11C-CO PET study similar to that described previously (6). The average Vb was 0.044 mL/g for maternal brain and 0.10 mL/g for fetal liver.
The time delay between the plasma input function and the tissue activity curve was estimated as part of model optimization. Model parameters were estimated by minimizing the weighted residual sum of the square error between the model solution and the PET measurements, where the residuals were weighted by the best possible weighting scheme, that is, inverse of constant variance of the tissue activity (i.e., uniform weighting; SD was equal to 5% of average tissue activity) over time (14). The goodness of fit of the models to the data was evaluated using the Akaike information criterion (AIC) and the Schwarz criterion, along with visual inspection of the model fits and residual plots.
Tissue and plasma AUC of total 11C-radioactivity was previously reported (9). The ratio of the vascular volume–corrected tissue AUC and plasma AUC was calculated and used as an additional index of P-gp activity.
Tissue Blood Flow Estimation
Cerebral and placental blood flow rates were estimated using a 1C model as previously described (6). Unlike humans, macaques have a bidiscoidal placenta composed of primary and secondary disks. Because of the limited resolution of the MR images obtained in the current study, it was not possible to identify both primary and secondary disks on these images. Therefore, placental blood flow was estimated after a manual adjustment of 15O-water radioactivity in the placenta by a factor of 2, based on the fact that primary and secondary disks are of similar size and perfusion level (15).
Estimation of Potency of CsA to Inhibit P-gp
With nonlinear regression (WinNonlin, version 5.2; Pharsight Corp.), the sigmoidal Emax model was fitted to the percentage change in ER as a function of increasing inhibitor concentration to estimate the Emax, the IC50, and the Hill coefficient (γ).
Statistical Analysis
Data are expressed as mean ± SD. Statistical analysis was performed using Prism, version 5.0 (GraphPad Software). Either repeated-measures ANOVA, followed by the Bonferroni test for multiple comparisons, or the paired t test was used for statistical comparison between different kinetic models whenever appropriate. CsA-induced changes in kinetic parameters were evaluated using the paired t test. The significance level was set at a P level of less than 0.05.
RESULTS
Animals
The demographics of the animals are summarized in Table 1 and were previously summarized as well (9,10). In this dataset, we included a previously unreported animal (macaque 4) that received a lower CsA infusion rate (6 mg/kg/h). The average CsA blood concentration achieved in this animal was 2.9 μM. In the animals administered 12 and 24 mg/kg/h, the average CsA blood concentrations achieved were 7.0 ± 2.0 μM (range, 4.7–10.0 μM) and 21.6 ± 3.3 μM (range, 17.9–25.8 μM), respectively. Of the 13 pregnant macaques, data from 1 animal (macaque 10) were excluded from subsequent kinetic analysis because the arterial blood tracer concentrations were unusually low but the tissue concentrations were as expected, resulting in 11C-verapamil K1 estimates that were physiologically unrealistic. For another animal (macaque 12), only maternal brain image data were used because image artifacts due to retained radioactivity in the maternal bladder did not allow quantification of radioactivity in the fetal liver. Therefore, maternal brain uptake was evaluated in 12 animals and fetal liver radioactivity uptake was evaluated in 11 animals.
Demographics of Pregnant Nonhuman Primates at Time of PET Study
Distribution of 11C-Verapamil into Maternal Brain
We evaluated the performance of the 1C and 2C models with respect to their ability to fit the 11C-verapamil radioactivity distribution into the brain before and during inhibition of macaque BBB P-gp with CsA (Fig. 2A shows the profiles for macaque 7), in order to arrive at the most appropriate model to estimate the distribution of 11C-verapamil radioactivity across the macaque BBB as opposed to the human BBB.
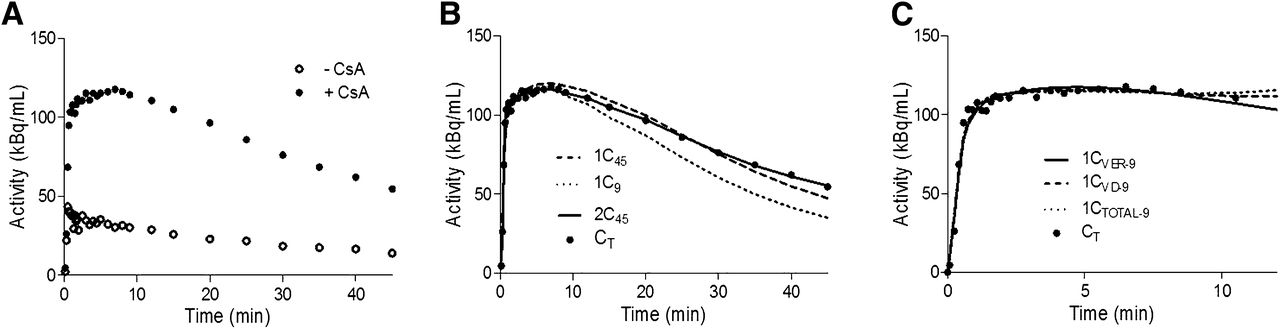
Brain time–activity curves for 11C-verapamil before and during CsA treatment. (A) Representative curves illustrate difference in brain uptake of 11C-radioactivity before and during administration of CsA in nonhuman primates (macaque 7 as example). (B) 1C or 2C model was fitted to 45 min (1C45 and 2C45) or initial 9 min (1C9) of during-CsA brain time–activity curve (CT). CVER was used as arterial input function. (C) 1C model was fitted to initial 9 min of during-CsA brain time–activity curve (CT). CVER, CVD, or CTOTAL for initial 9 min (1CVER-9, 1CVD-9, and 1CTOTAL-9, respectively) was used as arterial input function.
To determine the influence of tracer metabolism on the estimation of kinetic parameters, several arterial input functions including or excluding metabolites were evaluated, as described in the “Materials and Methods.” Based on the comparison of AIC values and visual inspection of the model fit, the 2C model using CVER as the input function with the lowest AIC values was considered to be most appropriate for describing 0- to 45-min brain dynamic data in macaques (supplemental data). Although the 2C model has the advantage of separating initial transport rates (K1, k2) from the rate constants associated with tissue binding (k3, k4), the latter were estimated with poor confidence (coefficient of variation of the estimates, 30%–200%). Therefore, we investigated the 1C model. Similar to our previous kinetic analysis with human 11C-verapamil brain dynamic data (6), we found that a 1C model showed a poor model fit for the during-CsA brain time–activity curve from 0 to 45 min (Fig. 2B, the 45-min 1C model fit with CVER as the input function is shown). However, the 1C model using only the first 9 min of the data yielded good model fits (Fig. 2B). The coefficient of variation of the parameter estimates for the 9-min 1C model was 1%–5% for K1 and 4%–18% for k2. Lastly, estimates of K1 were highly correlated between the 9-min 1C and 45-min 2C models (r = 0.96, n = 12, P < 0.0001).
Since the 1C model appeared to be adequate to assess K1 using only the first 9 min of the brain uptake curve, we also evaluated the goodness of fit when different input functions were used for this model (Fig. 2D). Arterial input functions including or excluding metabolites had a negligible impact on model fits for pre-CsA tissue time–activity curves (Table 2: P = 0.149 for CVER vs. CVD, P = 0.131 for CTOTAL [total plasma activity] vs. CVER, n = 12). However, during P-gp inhibition by CsA, models using CVD or CTOTAL as the input function performed slightly (but significantly) better than CVER (Table 2), as assessed by goodness of fit (P = 0.002 for CVER vs. CVD, P = 0.02 for CTOTAL vs. CVER). Neither K1 values (before and during CsA) nor the percentage change in K1 differed significantly when different input functions were used (P > 0.22 in all comparisons).
Parameter Estimates and AIC Values When 1C Model was Fitted to 11C-Verapamil Dynamic Biodistribution Data
On the basis of the results of model characterization, in macaques as in humans the 1C model applied to the first 9 min of brain dynamic data using CVER as the input function was the simplest and most parsimonious model to estimate K1 and k2 for the distribution of 11C-verapamil radioactivity across the BBB. As expected, P-gp inhibition during CsA treatment (CsA concentration, 14.3 ± 6.4 μM; range, 7.8–21.0 μM) increased the K1 of 11C-verapamil radioactivity into the brain by 372% ± 193% (range, 170%–645%; n = 6, data from 2 animals were excluded from this comparison), and K1 approached regional CBF (Q) at maximal inhibition (Table 3). At a lower CsA blood concentration (4.7 ± 1.4 μM; range, 2.9–6.2 μM), the observed increase in K1 was smaller (120% ± 110%; range, 28%–270%; Table 3). Estimates of cerebral blood flow were 0.92 ± 0.30 and 0.90 ± 0.24 mL/min/g with and without CsA treatment, respectively, in animals with higher CsA concentrations (n = 6, Table 3). The ER (i.e., K1/Q) increased from 0.23 ± 0.05 (n = 6) and approached unity (1.0 ± 0.19, n = 6) in animals with higher CsA blood concentrations (Table 3). The percentage change in the ER of 11C-verapamil radioactivity into the brain was linearly correlated with the percentage change in flow-normalized AUC ratio (i.e., AUC ratio/Q) (r = 0.80, P = 0.002, Fig. 3A), whereas the correlation between k2 and AUC ratio was much weaker (r = 0.14, P = 0.29, Fig. 3B). In addition, the change in k2 (−7% ± 33%) was much less than the approximately 300% observed in AUC ratio and was not statistically significant (P > 0.05, before CsA vs. during CsA).
11C-Verapamil Radioactivity K1, Q, and ER Estimates Grouped by CsA Blood Concentration
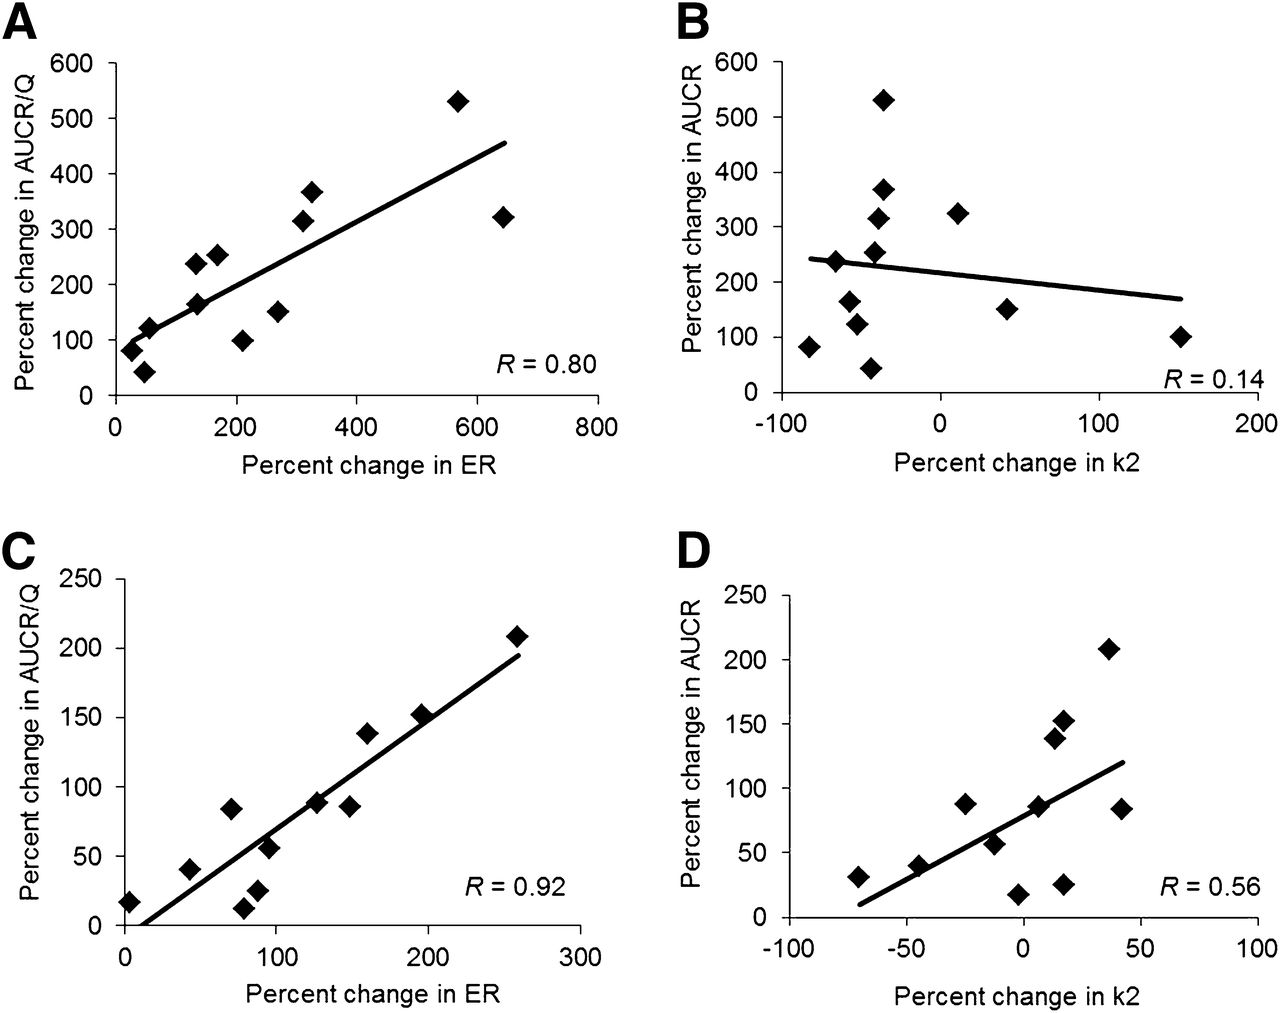
(A) Percentage change in brain ER of 11C-verapamil radioactivity was linearly correlated with percentage change in flow-normalized brain AUC ratio (AUCR/Q) (r = 0.80, P = 0.002), whereas (B) correlation between brain k2 and AUC ratio was much weaker (r = 0.14, P = 0.29). (C) Similarly, percentage change in fetal liver ER of 11C-verapamil radioactivity was highly correlated with percentage change in fetal liver AUCR/Q (r = 0.92, P < 0.0001), whereas (D) correlation between fetal liver k2 and AUC ratio was weaker (r = 0.56, P = 0.25).
Distribution of 11C-Verapamil into Fetal Liver
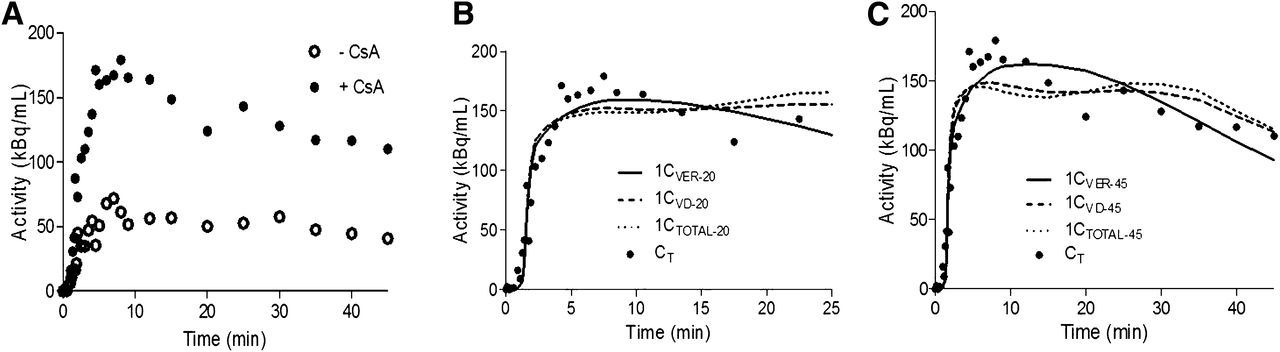
In contrast to maternal brain, for fetal liver we did not consider shorter tissue scans of up to 9 min because they failed to estimate the efflux rate constant k2 with acceptable precision (coefficient of variation, >200%). Representative fetal liver time–activity curves for 11C-verapamil before and during CsA treatment are shown in Figure 4A. An example of the fit of the 1C model up to 20 min and 45 min of during-CsA dynamic data is shown in Figures 4B and 4C and in the supplemental data.

Fetal liver time–activity curves for 11C-verapamil before and during CsA treatment. (A) Representative curves illustrate difference in fetal liver uptake of 11C-radioactivity before and during administration of CsA in nonhuman primates (macaque 13 is shown as example). (B) 1C model was fitted to during-CsA time–activity curve (CT) up to 20 min. CVER, CVD, or CTOTAL up to 20 min (1CVER-20, 1CVD-20, or 1CTOTAL-20) was used as model input function. (C) 1C model was fitted to during-CsA time–activity curve (CT) up to 45 min. CVER, CVD, or CTOTAL up to 45 min (1CVER-45, 1CVD-45, or 1CTOTAL-45) was used as model input function.
Despite the difference in the extent of verapamil metabolism at 20 min (∼70%) versus 45 min (∼85%), the model using CVER as the input function consistently yielded lower AIC values than did the model using CVD and CTOTAL in describing both pre-CsA and during-CsA dynamic fetal liver curves (Table 2), and the difference was supported by visual inspection of the model fit (Figs. 4B and 4C). Similar to the brain model, the input function did not affect K1 estimations. Although a truncated fetal liver dataset from 0 to 20 min seemed to be adequate to estimate K1, the estimates for k2 were associated with a much larger variability (coefficient of variation, 20%–80%) than were estimates derived from the full-duration data (coefficient of variation, <20%). Therefore, a 1C model was fitted to the fetal liver data up to 45 min using CVER as the input function to estimate K1 and k2 for each animal. P-gp inhibition during CsA treatment (CsA blood concentration, 14.3 ± 6.4 μM; range, 7.8–21.0 μM) increased the fetal liver K1 of 11C-verapamil radioactivity by 174% ± 75% (range, 79%–259%; n = 4, data from 3 animals were excluded from this comparison) (Table 3). Placental blood flow estimates were 0.84 ± 0.20 and 0.68 ± 0.21 mL/min/g with and without CsA treatment, respectively, in animals with higher CsA concentrations (n = 4, Table 3). The ER increased from 0.20 ± 0.10 to 0.68 ± 0.36 in animals with higher CsA blood concentrations (n = 4, data from 3 animals were excluded from this comparison) (Table 3). Similar to maternal brain, the change in k2 (−2% ± 32%) was much less than the approximately 120% difference in fetal liver uptake of radioactivity expressed as AUC ratio and was not significantly different (P = 0.32) before CsA versus during CsA. Five of 11 animals had a negative percentage change in k2. The percentage change in the ER of 11C-verapamil radioactivity by the fetal liver was highly correlated with the percentage change in AUC ratio/Q (r = 0.92, P < 0.0001, Fig. 3C), whereas the correlation between k2 and AUC ratio was weaker (r = 0.56, P = 0.25, Fig. 3D).
Potency of CsA to Inhibit P-gp at Maternal BBB and BPB
ER was used as a measure of P-gp activity at the BBB and BPB. We observed a bimodal relation in maternal brain and placental P-gp inhibition by CsA. After an initial increase in the ER as the blood CsA concentration increased, a further increase in CsA blood concentrations (>20 μM) resulted in a decrease in the ER (Figs. 5A and 5B). The animals showing this behavior at the higher CsA blood concentrations (>20 μM) were excluded when the potency of CsA to inhibit P-gp (IC50) was estimated using the sigmoidal Emax model. Similar CsA IC50 values were obtained in different tissues (BBB IC50, 5.67 ± 1.07 μM, vs. BPB IC50, 7.63 ± 3.16 μM). The Emax and Hill coefficient (γ) for P-gp inhibition at the BBB (Emax, 386% ± 79%; γ = 4.01 ± 2.09) and BPB (Emax, 387% ± 119%; γ = 1.73 ± 0.74) were not significantly different (P > 0.05; Figs. 5A and 5B).
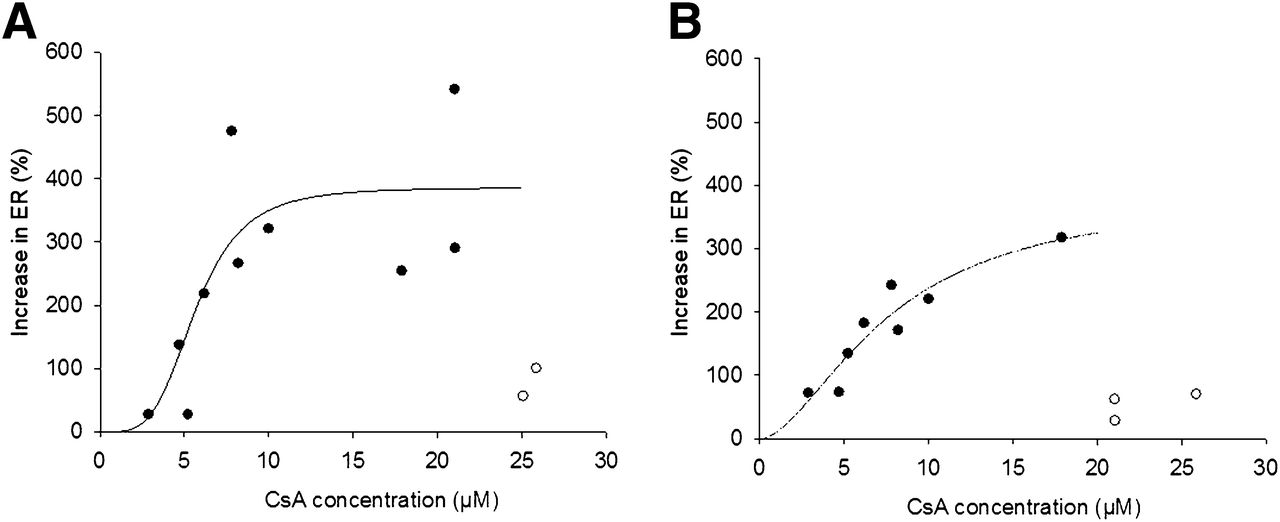
Inhibition of P-gp (as measured by ER) at BBB (A) and BPB (B) increased as CsA blood concentration increased up to ∼20 μM. Future increases in CsA blood concentration resulted in decrease in ER. Therefore, when estimating potency of CsA to inhibit P-gp (IC50) using sigmoidal Emax model, we excluded some data points. Potency (IC50) for P-gp inhibition at BBB and BPB was similar (BBB IC50, 5.67 ± 1.07 μM, vs. BPB IC50, 7.63 ± 3.16 μM), as was Emax for P-gp inhibition (BBB Emax, 386% ± 79%, vs. BPB Emax, 387% ± 119%). Estimated Hill coefficient for P-gp inhibition at BBB and BPB was 4.01 ± 2.09 and 1.73 ± 0.74, respectively. • = observed data points; ○ = data points excluded from this analysis; solid line = predicted values.
DISCUSSION
We report here, for what is to our knowledge the first time, a detailed kinetic analysis of the distribution of verapamil, a P-gp substrate, into the maternal brain and fetal compartment of the nonhuman primate M. nemestrina. We and others have previously shown that inhibition of P-gp at the BBB results in increased K1 across the human BBB, with little or no change in the efflux rate constant k2 (6,16). Here, we asked whether this was true for inhibition of P-gp at the macaque BBB and BPB.
As we have reported before, most radioactivity in the fetal compartment was concentrated in the fetal liver, with a trace amount in the extrahepatic fetal tissues (9). Hence, the fetal liver served as a readily identifiable reporter of placental transfer of 11C-radioactivity and therefore placental P-gp activity. In contrast, the shape and location of the placenta makes the reliable identification and quantification of tissue radioactivity in it difficult. Given the high blood content of the placenta (∼50% of the placenta is maternal or fetal blood), reliable estimation of P-gp activity by measuring changes in placental radioactivity was not possible. This limitation may also affect the accurate determination of placental blood flow. Nonetheless, our estimates of placental blood flow were comparable to placental perfusion rates obtained by contrast-enhanced ultrasound in pregnant macaques (15).
As in humans, verapamil is metabolized in macaques and the rate of metabolism is faster but unaffected by gestational age or CsA administration (9,10). To determine the influence of tracer metabolism on kinetic parameter estimation, we compared 3 different input functions including CTOTAL, CVER, and CVD for modeling analysis. The rationale for this comparison was that D617 is a P-gp substrate (17), that its transport might therefore be kinetically indistinguishable from the transport of verapamil, and that at the end of 40 min a large fraction of the circulating total radioactivity (∼35%) is composed of polar metabolites (likely not P-gp substrates) that can diffuse across the BBB (or BPB) as they do in rodents (18). Significant plasma concentrations of both D617 and polar metabolites were present late after tracer administration and therefore had a minimal influence on K1 estimated using the 9-min 1C or 45-min 2C models, because K1 is most influenced by initial tissue concentrations. In contrast, these metabolites could affect estimates of k2 and tissue binding (k3 and k4), as was confirmed by our observations (Table 2). To our surprise, including D617 in the input function did not markedly improve the goodness of fit (i.e., AIC and Schwarz criterion) of either the 9-min 1C model or the 45-min 2C model (or the 45-min 1C for fetal liver) to the pre-CsA and during-CsA brain or fetal time–activity curves. We speculate that in macaques, D617 (or a different metabolite that elutes in the same fractions as D617) does not enter the brain in a significant quantity in the presence or absence of P-gp activity. Interestingly, Verbeek et al. have shown that in rodents, 11C-D617 has lower affinity to P-gp than does verapamil (19). Taken together, the 1C model with CVER as the input function was identified to be the most appropriate model to explain the observed maternal brain and fetal distribution of 11C-radioactivity data up to 9 min and 45 min, respectively. In the presence of CsA, consistent with the change in AUC ratio, K1 of 11C-verapamil radioactivity into the maternal brain and the fetal liver was significantly increased whereas k2 was not. On the basis of these kinetic analyses we conclude that, as is the case at the human BBB, inhibition of P-gp at the BBB and the BPB in the macaque is reported by an increase in 11C-verapamil K1 and not k2.
The ER provides a measure of the ability of each tissue or organ to extract the tracer and serves as an overall measure of the permeability of the BBB and BPB. The excellent correspondence of the change in verapamil ER after P-gp inhibition to the flow-normalized AUC ratio of maternal brain and fetal liver supports the above argument. As per our hypothesis, when P-gp was completely inhibited by CsA, the ER of 11C-radioactivity by both the brain and the placenta approximated unity (i.e., K1 approximated blood flow).
The concept that for lipophilic drugs the upper boundary of K1 is perfusion is important to allow estimation of the dynamic range in brain exposure after maximal P-gp inhibition at the human BBB. Estimating this dynamic range is important to allow prediction of the magnitude of drug interaction likely to occur at the BBB when P-gp is deliberately or inadvertently inhibited. This estimation can be done only when the upper boundary for the brain distribution of the drug is known. However, currently this upper boundary is not possible to obtain, as approved drugs (e.g., CsA) that are P-gp inhibitors cannot be safely administered to completely inhibit P-gp at the human BBB. More selective and potent second- and third-generation inhibitors of P-gp have been developed (e.g., tariquidar) but are not approved as drugs. Since the lower boundary of brain penetration is dictated by the net permeability of the compound, and the upper boundary is dictated by tissue perfusion, probes associated with a higher baseline brain distribution (in the absence of P-gp inhibition) would be expected to be associated with a smaller increase in brain distribution when P-gp is maximally inhibited, compared with drugs with a lower baseline brain distribution. For example, the PET ligands verapamil and N-desmethyl-loperamide (dLOP) are both lipophilic compounds (20,21). However, the differential permeability of these P-gp probes is evident in the 4- to 6-fold difference in mean baseline K1 values (0.035–0.06 mL/min/g for verapamil vs. 0.015 mL/min/g for dLOP in humans; 0.26 mL/min/g for verapamil vs. 0.04 mL/min/g for dLOP in macaques) (5,7,11,22). The higher baseline ER in the macaques than in humans is consistent with the observation that P-gp expression in the macaques is lower (macaque vs. human, 4.71 ± 1.30 vs. 6.06 ± 1.69 fmol/μg of protein) (23,24) and that regional CBF in the pregnant macaques is higher (macaque vs. human, 0.5–1.2 mL/min/g [from this study] vs. 0.3–0.5 mL/min/g (7,11)). Therefore, we predict that dLOP is excluded from the brain by P-gp to a greater extent than is verapamil and that as a result the increase in brain exposure of dLOP on complete P-gp inhibition would be greater than that of verapamil. Data in the literature support this speculation. After P-gp inhibition by tariquidar (6 mg/kg), the increase (though not necessarily the maximal increase) in the brain distribution of 11C-verapamil (reported by K1) was 2.5-fold, whereas it was 4-fold for 11C-dLOP (5,11).
Our previous analysis of these pregnant macaque data using AUC ratio as an index of P-gp activity concluded that P-gp activity in maternal brain and in the placenta increases with gestational age (10). In the present study using ER as an index of P-gp activity, although there was a similar trend of greater change in brain and placental ER as gestational age increased, none of these between-group differences were statistically significant (for the brain, P = 0.178; for the fetal liver, P = 0.548). This difference is likely due to the fact that the ER takes into account the variation in tissue blood flow, whereas the AUC ratio does not. The concentration-dependent inhibition of P-gp (i.e., increase in 11C-verapamil ER) by CsA in the brain and the placenta was bimodal. In the lower range of CsA blood concentrations, as expected, the brain and placental ER increased with increase in CsA concentration. However, in the higher range of CsA blood concentrations (>20 μM), there was a decrease in ER. This bimodality in CsA inhibition in both tissues suggests that, at the higher CsA blood concentrations, mechanisms other than inhibition of P-gp (e.g., inhibition of influx transporters) are responsible for 11C-verapamil distribution into these tissues. At the BBB, our assumption of the P-gp specificity of verapamil and CsA is not unreasonable given the known functional efflux transporters expressed at this location. In vitro cellular uptake experiments have shown that verapamil is not a substrate for organic anion transporting polypeptide brain isoforms 1A2 and 2B1 (Yurong Lai, Pfizer; written communication; November 2009). However, we cannot rule out the possibility that in the placenta, verapamil and CsA might interact through other transporters present there (25).
There is increasing evidence that P-gp inhibition appears to be tissue- and species-specific. For example, peripheral P-gp activities in rodents or humans, such as those in testes and lymphocytes, have different sensitivities to P-gp inhibitors than does P-gp at the BBB (12,26). Although the mechanisms underlying this differential sensitivity are not yet fully understood, the higher expression of P-gp at the BBB compared with other tissues (27) is thought to lower the competitive inhibitor concentration at the site of inhibition relative to that in the plasma. As a result, higher plasma concentrations are required to inhibit P-gp at the BBB, resulting in higher IC50 values. However, in the current study, a more specific measure of P-gp inhibition, namely ER, suggested no distinctive difference in the potency of CsA inhibition (IC50) of P-gp expressed at the BBB and BPB. When corrected for protein binding, the in vivo unbound IC50 at the macaque BBB or BPB was in reasonable agreement with the in vitro IC50 (8). In addition, the potency of CsA to inhibit macaque P-gp (IC50, 5.67 ± 1.07 μM) at the BBB is similar to that at the rat BBB (7.2 ± 0.5 μM), suggesting no marked species differences in the ability of CsA to inhibit BBB P-gp in rats and humans. This finding supports our contention that the rat serves as an excellent model to predict P-gp–based interactions provided the differences in cerebral blood flow are taken into consideration. On complete inhibition of P-gp, a much more profound increase in brain exposure (∼12.9-fold) of verapamil at the rodent BBB (8,18) is likely due to the greater cerebral blood flow in rodents. In small animals, 14C-iodoantipyrine autoradiography was used to estimate CBF to be 0.5–2.4 mL/min/g across different brain regions (28,29). The CBF measured by PET in nonpregnant macaques ranged from 0.3 to 0.6 mL/min/g (22). The fact that the mean value of CBF in rodents is almost twice as high as that in macaques could explain a 2.5-fold greater effect in the rat on brain distribution of verapamil as a result of complete P-gp inhibition. Therefore, rodent P-gp knockout models can overestimate the maximum potential for P-gp–mediated drug interactions at the human BBB.
CONCLUSION
Our results support the hypothesis that, in the absence of functional P-gp, tissue blood flow limits the K1 of 11C-verapamil across the macaque BBB and BPB. Our results also highlight the importance of using flow-normalized K1 or ER as a measure of P-gp activity at the BBB and BPB. The measure can provide a means to predict the magnitude of P-gp–based drug interactions at the BBB and BPB when only the baseline (i.e., in the absence of P-gp inhibition) distribution across these barriers is available through PET. In addition, the in vivo potency (IC50) of P-gp inhibition by CsA at both the BBB and the BPB is not tissue-dependent. Given that the nonhuman primate is probably the most relevant model for predicting likely tissue exposure levels in humans, it is reasonable to speculate that P-gp–based drug interactions at the human BBB and BPB can be clinically significant, particularly for those P-gp substrate drugs in which P-gp plays a significant role in excluding the drug from these privileged compartments. Deliberate circumvention of P-gp (by selective nontoxic inhibitors) at the BBB and BPB could increase drug delivery to the central nervous system and the fetus, such as in the treatment of brain tumors and fetal arrhythmia.
DISCLOSURE
The costs of publication of this article were defrayed in part by the payment of page charges. Therefore, and solely to indicate this fact, this article is hereby marked “advertisement” in accordance with 18 USC section 1734. This study was supported by National Institute of Health grants U10HD047892 (OPRU network), P50HD044404, GM032165, and RR00166. No potential conflict of interest relevant to this article was reported.
Footnotes
Published online Jan. 28, 2013.
- © 2013 by the Society of Nuclear Medicine and Molecular Imaging, Inc.
REFERENCES
- Received for publication July 24, 2012.
- Accepted for publication October 10, 2012.


Jump to section
Related Articles
Cited By...
- Transport Properties of Statins by Organic Anion Transporting Polypeptide 1A2 and Regulation by Transforming Growth Factor-{beta} Signaling in Human Endothelial Cells
- Emerging Models of Drug Metabolism, Transporters, and Toxicity
- Unravelling the complex drug-drug interactions of the cardiovascular drugs, verapamil and digoxin, with P-glycoprotein
- Role of (Drug) Transporters in Imaging in Health and Disease
- Activity of P-Glycoprotein, a {beta}-Amyloid Transporter at the Blood-Brain Barrier, Is Compromised in Patients with Mild Alzheimer Disease
- Inhibition of the Multidrug Resistance P-Glycoprotein: Time for a Change of Strategy?