


Abstract
166Ho-poly(l-lactic acid) microspheres allow for quantitative imaging with MR imaging or SPECT for microsphere biodistribution assessment after radioembolization. The purpose of this study was to evaluate SPECT- and MR imaging–based dosimetry in the first patients treated with 166Ho radioembolization. Methods: Fifteen patients with unresectable, chemorefractory liver metastases of any origin were enrolled in this phase 1 study and were treated with 166Ho radioembolization according to a dose escalation protocol (20–80 Gy). The contours of all liver segments and all discernible tumors were manually delineated on T2-weighted posttreatment MR images and registered to the posttreatment SPECT images (n = 9) or SPECT/CT images (n = 6) and MR imaging–based R2* maps (n = 14). Dosimetry was based on SPECT (n = 15) and MR imaging (n = 9) for all volumes of interest, tumor-to-nontumor (T/N) activity concentration ratios were calculated, and correlation and agreement of MR imaging– and SPECT-based measurements were evaluated. Results: The median overall T/N ratio was 1.4 based on SPECT (range, 0.9–2.8) and 1.4 based on MR imaging (range, 1.1–3.1). In 6 of 15 patients (40%), all tumors had received an activity concentration equal to or higher than the normal liver (T/N ratio ≥ 1). Analysis of SPECT and MR imaging measurements for dose to liver segments yielded a high correlation (R2 = 0.91) and a moderate agreement (mean bias, 3.7 Gy; 95% limits of agreement, −11.2 to 18.7). Conclusion: With the use of 166Ho-microspheres, in vivo dosimetry is feasible on the basis of both SPECT and MR imaging, which enables personalized treatment by selective targeting of inadequately treated tumors.
Radioembolization is an interventional oncologic treatment during which radioactive microspheres are administered in the arterial vessels supplying the liver and its tumors. The rationale behind this intraarterial liver treatment is that liver tumors are predominantly supplied by arterial blood, in contrast to the nontumorous liver, which relies mainly on the portal vein for its blood supply. Injection of a substance into the hepatic artery will therefore selectively target the tumorous tissue (1). Currently, the commercially available microspheres that are used for radioembolization are labeled with 90Y. To be able to quantitatively evaluate the optimal and selective distribution of microspheres to the liver tumors, posttreatment imaging is indispensable. For that reason, optimization of posttreatment imaging of 90Y-microspheres with bremsstrahlung SPECT and PET has recently gained interest (2–5).
166Ho-poly(l-lactic acid) microspheres have been developed at our institute as an alternative to 90Y-microspheres specifically to be able to visualize the in vivo biodistribution of microspheres after radioembolization. 166Ho-microspheres can be imaged with both SPECT and MR imaging, using the emission of γ-photon radiation and the paramagnetic properties of holmium, respectively (6–10). Exploiting these qualities, multimodal dosimetry becomes feasible, with a range of possibilities.
We performed a phase 1 clinical trial to assess the safety and toxicity of 166Ho radioembolization in patients for, to our knowledge, the first time (11) and to investigate the feasibility of quantitative imaging of the biodistribution of microspheres within the liver based on SPECT and MR imaging. We now present the dosimetry results of this trial.
MATERIALS AND METHODS
Microspheres
Holmium-poly(l-lactic acid) microspheres with a mean diameter of 30 μm (range, 20–50 µm) were produced at the University Medical Center Utrecht in compliance with good manufacturing practice regulations, as described previously (12,13). The holmium, which was homogeneously incorporated into these microspheres (18.7% w/w ratio), was applied as a radioactive isotope for tumor destruction using its β radiation (Eβmax = 1.77 MeV and Eβmax = 1.85 MeV; radiation yield per disintegration, 0.487 and 0.500, respectively; half-life, 26.8 h), as a radioactive isotope for SPECT imaging using its γ radiation (Eγ = 80.6 keV; radiation yield per disintegration, 0.067), and as a contrast agent for MR imaging. For each treatment, approximately 600 mg of nonradioactive holmium microspheres were packed into high-density polyethylene vials (Posthumus Plastics). The holmium microspheres were then activated by neutron irradiation in the nuclear reactor of the Reactor Institute Delft (Delft University of Technology) during the night before a treatment session. After irradiation, the vials were shipped back to the University Medical Center, where, before treatment, the total amount of activity was measured (using a dose calibrator: VDC-404, Veenstra Instrumenten) and the quality of microspheres was checked (particle integrity assessment and particle size measurement).
Patients
Patients with unresectable, chemorefractory liver metastases of any origin were included in this phase 1 dose-escalation study on 166Ho radioembolization. The design (14) and clinical results (patient characteristics, toxicity, and adverse events) (11) of the study were described previously. In short, patients needed to be at least 18 y old and to have an estimated life expectancy of at least 3 mo, a World Health Organization performance status of 0–2, at least one lesion measuring at least 10 mm on CT, and a negative pregnancy test (for women). Exclusion criteria were impaired hematologic function (leukocytes < 4.0 109/L, platelet count < 150 109/L), impaired renal function (serum creatinine > 185 μmol/L), impaired cardiac function (relevant morphology on electrocardiography or New York Heart Association classification of heart disease ≥ 2), impaired hepatic function (alanine aminotransferase, aspartate aminotransferase, or alkaline phosphatase > 5 times the upper limit of normal, or serum bilirubin > 1.5 times the upper limit of normal). Patients were also excluded if they had received chemotherapy or abdominal surgery within 4 wk before inclusion, had an incompletely healed surgical incision, or had contraindications to MR imaging. All patients provided written informed consent before enrollment. The study was approved by the institutional review board and was registered as number NCT01031784 with Clinicaltrials.gov.
Study Design and Treatment
Patients were treated in 4 consecutive cohorts of 3–6 patients (depending on the occurrence of any dose-limiting toxicity). Each cohort was scheduled for treatment with escalating desired whole-liver absorbed doses of 166Ho radioembolization (20, 40, 60, and 80 Gy). The required amount of activity was calculated according to the following formula (9): where
where  is the administered activity, LW is the liver weight calculated by delineation on contrast-enhanced CT images (assuming a tissue density of 1.06 g/cm3) (15), and Dliver is the desired whole-liver absorbed dose.
Lesion vascularity, guided by arterial enhancement patterns as described in Spiral and Multislice Computed Tomography of the Body (16), was evaluated on baseline 3-phase CT imaging by one of the investigators. Patients underwent standard work-up angiography during which the hepatic arterial vasculature was investigated and several nontarget vessels, arising from the hepatic artery and leading to organs other than the liver, were coil-embolized. Subsequently, 150 MBq of 99mTc-macroaggregated albumin (MAA) (0.8 mg, TechneScan LyoMaa; Mallinckrodt Medical B.V.) were administered through a microcatheter in the hepatic artery and the distribution was checked with planar scintigraphy and SPECT or SPECT/CT. If there was no extrahepatic distribution of activity, except for a lung shunt fraction of maximally 20%, the patients were scheduled for treatment generally 1–2 wk after the work-up angiography. On the day of treatment, a microcatheter was angiographically placed as close as possible to the position of the 99mTc-MAA injection. Subsequently, a scout dose (60 mg, approximately 250 MBq) and a therapy dose of 166Ho-microspheres (540 mg, varying activities; Table 1) were injected, with MR imaging, scintigraphy, and SPECT or SPECT/CT in between. The scout dose was used to increase the safety of the procedure.
Demographics, Treatment, and Imaging Details
SPECT Imaging
SPECT images of the 166Ho-microsphere distribution were acquired 3–6 d after administration of 166Ho-microspheres, using a Forte SPECT system (Philips) (n = 9) or a Symbia T16 SPECT/CT system (Siemens Healthcare) (n = 6). The Forte dual-head γ-camera was equipped with 153Gd scanning line sources for transmission CT for attenuation correction. Medium-energy collimators were used on both systems. Energy windows were set to 80.6 keV (15% window width) for the 166Ho photopeak and 118 keV (12%) for correction for down-scattered high-energy photons. One hundred twenty projections of 30 s each were acquired in a 180° (Forte) or 360° (Symbia T16) orbit around the liver. Data were reconstructed to a 128 × 128 × 128 matrix with an isotropic voxel size of 4.7 mm (Forte) or 4.8 mm (Symbia T16), using an ordered-subsets expectation maximization algorithm including resolution recovery and a hybrid method for scatter and attenuation correction (6).
MR Imaging
MR imaging was performed shortly before and 1 wk after 166Ho radioembolization, using a 1.5-T whole-body system (Achieva; Philips Healthcare) equipped with a 16-element torso coil. For quantitative measurements of the 166Ho-microsphere biodistribution, a multislice multi–gradient echo sequence was used, sampling the MR imaging signal of the free induction decay. Sixteen gradient echoes with a time spacing of 1.15 ms (first echo time, 1.33 ms) were acquired during breath hold with an in-plane voxel size of 2.0 × 2.0 mm and a slice thickness of 6.0 mm. Other imaging parameters included a 288 × 384 mm field of view, 45 slices, a 440-ms repetition time, and a 50° flip angle. Sensitivity encoding with a factor of 2.5 was used for acquisition acceleration, resulting in an imaging time of 3 × 19 s during a breath-hold. For anatomic information and delineation of liver segments and tumors, T2-weighted turbo spin echo images were acquired with a field of view and voxel size identical to the previous sequence. Imaging parameters included an 830-ms repetition time, an 80-ms echo time, a sensitivity encoding factor of 2, and an imaging time of 2 × 19 s during a breath-hold.
Delineation of Volumes of Interest (VOIs)
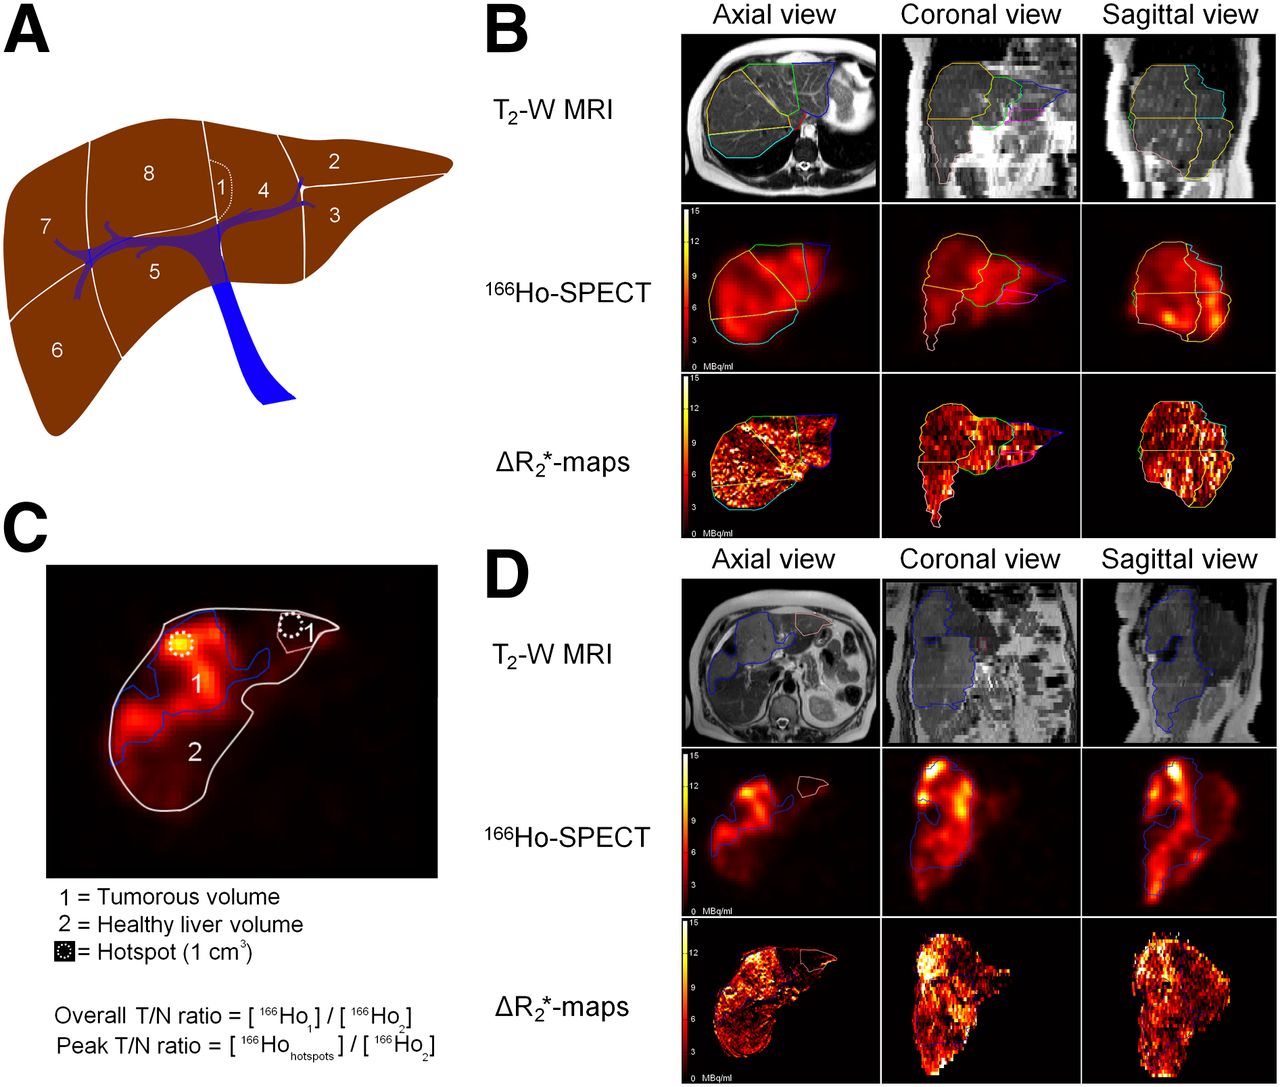
To perform dosimetry on specific liver regions and to be able to validate MR imaging–based dosimetry with SPECT-based dosimetry as a reference standard, each patient’s liver was carefully segmented into several VOIs using the in-house–developed radiotherapy-planning software package Volumetool, which has been validated and published elsewhere (17). The T2-weighted MR images of each patient’s liver were used to manually segment the liver into approximately the 8 (functionally independent) liver segments according to Bismuth’s adaptation of the Couinaud classification (1) and to segment the contours of all discernible tumors at baseline and after treatment (Fig. 1). Subsequently, the segmented contour of the liver was manually registered to the contour of the liver on posttreatment SPECT images (n = 9) or SPECT/CT images (n = 6) and baseline and posttreatment MR imaging–derived R2* maps.

Delineations for distribution assessment. (A) Schematic overview of VOIs that were created for each liver segment (1–8) according to Bismuth’s adaptation of Couinaud classification. (B) Top row: delineation of liver segments on T2-weighted MR images. Middle row: VOIs registered to 166Ho-SPECT activity maps. Bottom row: ΔR2*-based activity maps for same set of VOIs. Delineation between rows may appear different because of rotation in multiple planes for registration across modalities. (C) Schematic overview of tumor VOIs that were created and calculation of T/N ratios and fine distribution assessment. (D) Delineation of tumors. Orientation is same as for B. Hot spots for calculation of peak T/N ratio are not depicted.
Quantitative Analysis and Dosimetry
MR imaging–based absorbed dose maps were generated using previously described and validated methods (8,19). In short, R2* values were estimated voxelwise from the multi–gradient echo data using a monoexponential fitting algorithm weighting all signal amplitudes equally. To determine the microsphere-induced change in R2* (ΔR2*) after therapy, a baseline R2* value was subtracted from the posttherapy R2* values. This baseline value was, in contrast to the previously described method (19), determined for each VOI separately by the mean R2* value of that VOI before therapy. Voxelwise concentrations of 166Ho-microspheres were determined from the ΔR2* maps by the relationship [166Ho-microspheres] = ΔR2*/r2*, with r2* = 103 s−1mL−1mg for 166Ho-microspheres with holmium content of 18.9% by weight (19). The total amount of 166Ho-microspheres (mg) in each voxel was determined by using the voxel volume. This amount of 166Ho-microspheres was then converted into units of activity (MBq) by multiplication by the specific activity of the microspheres. Patients with surgical clips were excluded from analysis of MR imaging dosimetry because it has been demonstrated that MR imaging dosimetry is not reliable in these patients (19).
SPECT-reconstructed counts were converted into units of activity using a calibration factor obtained from a phantom experiment with a uniformly filled cylinder with 166Ho-chloride solution. Absorbed dose maps were calculated by convolution of the SPECT and MR imaging activity images with a 166Ho 3-dimensional dose-point kernel with the appropriate voxel size (8), in accordance with MIRD pamphlet no. 17 (20). The SPECT and MR imaging dose-point kernels were calculated using the Monte Carlo engine MCNPX 2.5.0 (21).
Volume; mean, maximum, minimum, and peak activity; mean, maximum, minimum, and peak radiation absorbed doses; and cumulative dose–volume histograms were calculated for all VOIs using MATLAB (MathWorks). The definition of peak value was derived from the PERCIST criteria as the mean activity concentration in the 1-cm3 volume (within a VOI) with the highest activity concentration (22). Mean tumor-to-nontumor (T/N) activity concentration ratios, defined as the mean activity concentration in the tumor divided by the mean activity concentration in the nontumorous liver, and peak T/N activity concentration ratios, defined as the peak activity concentration in the tumor divided by the mean activity concentration in the nontumorous liver, were calculated per tumor and per patient. CT of the abdomen was performed at 6 and 12 wk after treatment for tumor response assessment according to RECIST 1.1 (23). The change in longest diameter of all index lesions (up to 5 lesions per patient) was plotted against the mean and maximum dose on those lesions for assessment of a dose–response relationship.
SPECT Activity Recovery
To correct for activity spill-in and spill-out effects in SPECT-based dosimetry, activity recovery coefficients for the Forte system and the Symbia system were determined using a cylindric water phantom with 5 hot spheres in a cold background (volume = 2.0, 4.1, 8.0, 24.1, and 106.2 mL; [A] = 700 kBq mL−1). The activity recovery coefficients were calculated as the fraction of the true activity in the sphere that was recovered in the spheric VOI on the SPECT image. Activity recovery curves (ARCs) were created by fitting the activity recovery coefficients with a dual exponential function of the shape activity recovery coefficients: a1 + a2*exp(a3*volume) + a4*exp(a5*volume). For each tumor VOI, the corrected T/N ratio was subsequently calculated from the uncorrected (measured) T/N ratio using the following formula:
Statistical Analysis
Activities were expressed as megabecquerels, absorbed doses as grays, and quantitative values as mean ± SD or median plus range. T/N ratios were stratified for primary tumor type, liver tumor involvement, and tumor vascularity. Linear regression analysis was performed to investigate correlation, and Bland–Altman analysis was used to express agreement between measurements of 2 modalities (24). High agreement was arbitrarily defined as both 95% limits of agreement < 10 Gy and > −10 Gy; low agreement as one or more 95% limits of agreement ≥ 20 Gy or ≤ −20 Gy. All other results were defined as moderate agreement.
RESULTS
Treatment
Fifteen patients (mean age, 55 y; range, 38–87 y) with unresectable liver metastases originating from uveal melanoma (n = 6), colorectal cancer (n = 6), cholangiocarcinoma (n = 2), and breast carcinoma (n = 1) were treated with 166Ho radioembolization. The first cohort (20 Gy) consisted of 6 patients. The other cohorts (40, 60, and 80 Gy) consisted of 3 patients each. Patient demographics and treatment details are listed in Table 1.
Dose to Normal Liver and Tumor
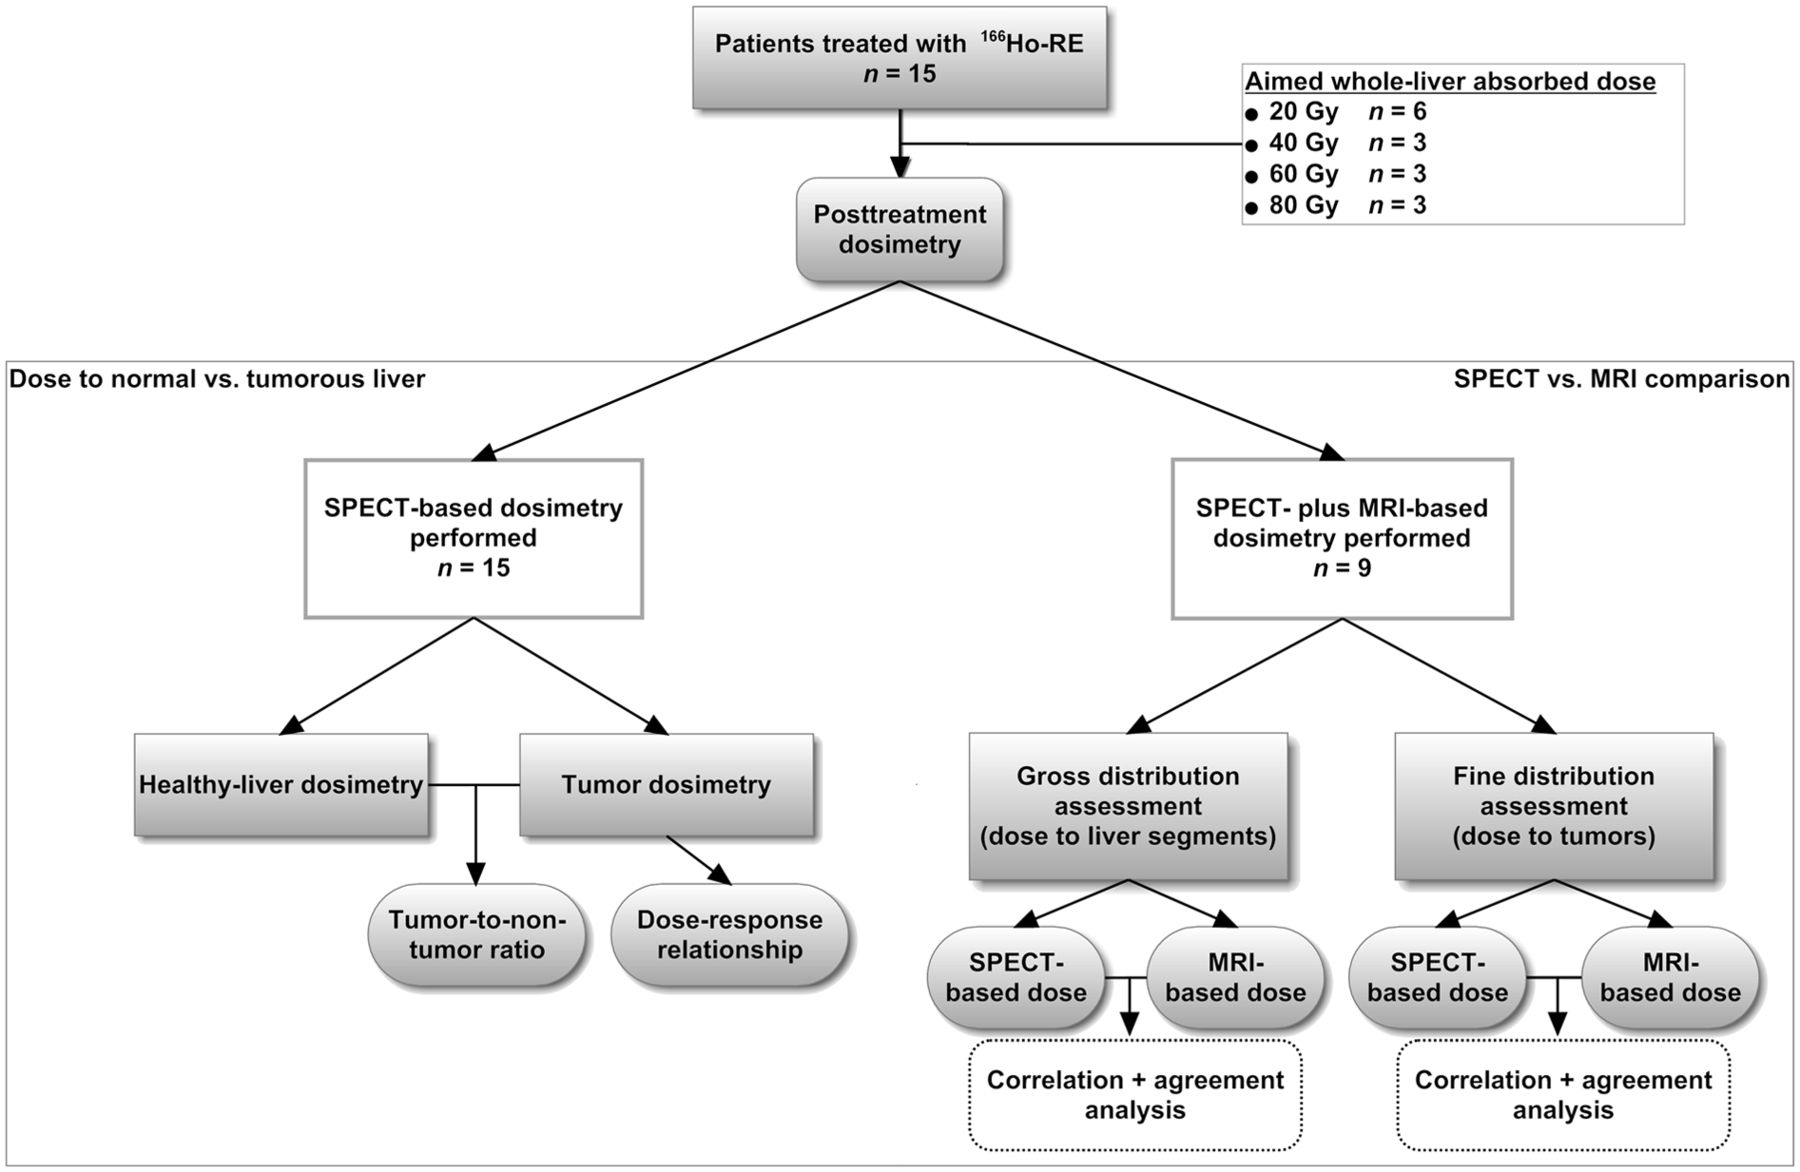
Figure 2 displays a flowchart of the analyses performed in this study. Posttreatment SPECT imaging was performed on all 15 patients. Tumor dosimetry based on SPECT showed that, on average, the tumorous liver tissue in these patients received a dose of 16.6 Gy (20-Gy cohort), 44.4 Gy (40-Gy cohort), 44.7 Gy (60-Gy cohort), and 59.2 Gy (80-Gy cohort), whereas the nontumorous liver tissue received an average dose of 9.6 Gy (20-Gy cohort), 20.4 Gy (40-Gy cohort), 33.5 Gy (60-Gy cohort), and 43.9 Gy (80-Gy cohort) (Fig. 3).

Flowchart of study design and dosimetric analyses performed in this study. These analyses were aimed to determine dose to normal and tumorous liver and to compare dosimetric results based on SPECT and MR imaging.

Cumulative dose volume histograms per dose cohort (20, 40, 60, and 80 Gy). Lines represent cumulative dose per volume fraction on nontumorous (NT) liver tissue (continuous lines) and on tumorous (T) tissue (dotted lines) in each study patient. P01 through P15 are patient numbers.
The biodistribution of 166Ho-microspheres was heterogeneous (Fig. 4), with the dose to the tumor region varying between and within patients. In 31 of the 107 delineated tumors (29%), the activity concentrations were less than the activity concentrations in the normal liver (i.e., T/N ratio < 1.0). In only 6 of the 15 patients (40%) did all tumors have a T/N ratio of 1.0 or greater. The median fraction of the net injected amount of activity lodging in the tumorous tissue as calculated on the basis of SPECT was 14.8% (range, 1.4%–60.7%). This fraction was linearly related to the fraction of the liver involved by tumor (R2 = 0.89).

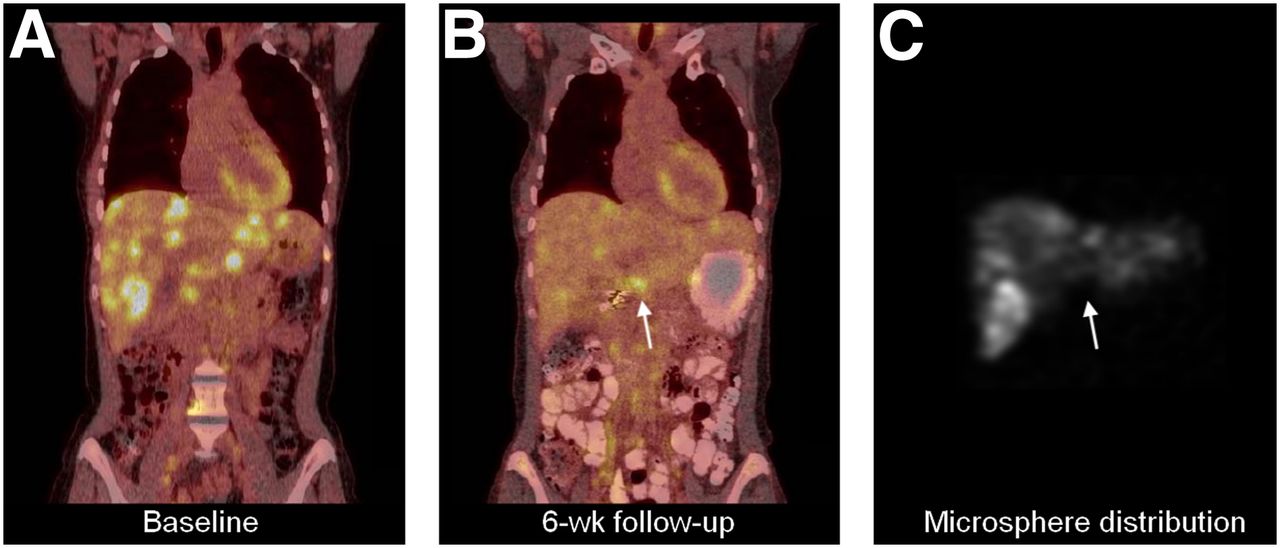
Example of clinical implication of inadequate microsphere distribution. (A and B) 18F-FDG PET at baseline (A) and at 6 wk after treatment (B) shows substantial reduction of 18F-FDG uptake in all but one liver lesion (arrow). (C) SPECT after 166Ho-radioembolisation showed that only a small amount of 166Ho-microspheres had arrived at this lesion. Calculated mean absorbed dose to this lesion was 4.8 Gy, vs. 19.6 Gy to normal liver and 27.7 Gy to entire tumorous volume.
The median overall T/N ratio for the 15 included patients was 1.4 (range, 0.9–2.8). The median peak T/N ratio was 2.0 (range, 0.9–10.3). Overall T/N ratios were highest for metastases from uveal melanoma (2.2), followed by colorectal cancer (1.5), breast carcinoma (1.4), and cholangiocarcinoma (1.2). Patients with at least 25% liver tumor involvement had higher median overall and peak T/N ratios (1.8 overall, 3.6 peak) than patients with less than 25% liver tumor involvement (1.3 overall, 1.5 peak). Patients with hypervascular tumors as scored on 3-phase CT imaging had higher median overall T/N ratios (2.6 overall, 3.3 peak) than patients with nonhypervascular tumors (1.3 overall, 1.5 peak) (Tables 2 and 3). From the phantom setup, activity recovery curves for both SPECT systems were assessed and fitted to a dual-exponential function (supplemental material, available at http://jnm.snmjournals.org). Corrected for incomplete activity recovery, the median overall T/N ratio was 1.6 (range, 1.1–3.6).
Liver Volumes and Dose Data Based on SPECT
T/N Ratios Based on SPECT
Based on SPECT dosimetry, there was a weak correlation (R2 = 0.09 at the 6-wk follow-up and R2 = 0.04 at the 12-wk follow-up) between the change in longest diameter and mean dose on each index lesion. There was a stronger dose–response relationship for the maximum dose (R2 = 0.34 at 6 wk and R2 = 0.19 at 12 wk) (supplemental material).
Comparison of MR Imaging– and SPECT-Based Dosimetry
Five patients with surgical clips in the liver region were excluded from MR imaging dosimetric analysis, and one patient did not undergo MR imaging because of claustrophobia. In the remaining 9 patients who were eligible for both SPECT- and MR imaging–based dosimetry, gross (dose to each liver segment, n = 72) and fine (dose to each tumor, n = 86) distribution assessments were compared. The gross comparison yielded a high correlation (R2 = 0.91) and moderate agreement between the absorbed dose in each segment as estimated on the basis of MR imaging and SPECT (mean bias, 3.7 Gy; 95% limits of agreement, −11.2 to 18.7) (Fig. 5). The fine comparison yielded a good correlation (R2 = 0.72) and low agreement (mean bias, 8.4 Gy; 95% limits of agreement, −22.2 to 38.9 Gy) between the absorbed dose in each tumor as estimated on the basis of MR imaging and SPECT. The higher resolution of MR imaging allowed for more detailed evaluation of microsphere biodistribution (Fig. 6). In the 9 MR imaging–evaluated patients, the peak T/N ratios were notably higher for MR imaging (median peak T/N ratio, 2.8) than for SPECT (median peak T/N ratio, 1.8). These results are presented in Tables 4 and 5.
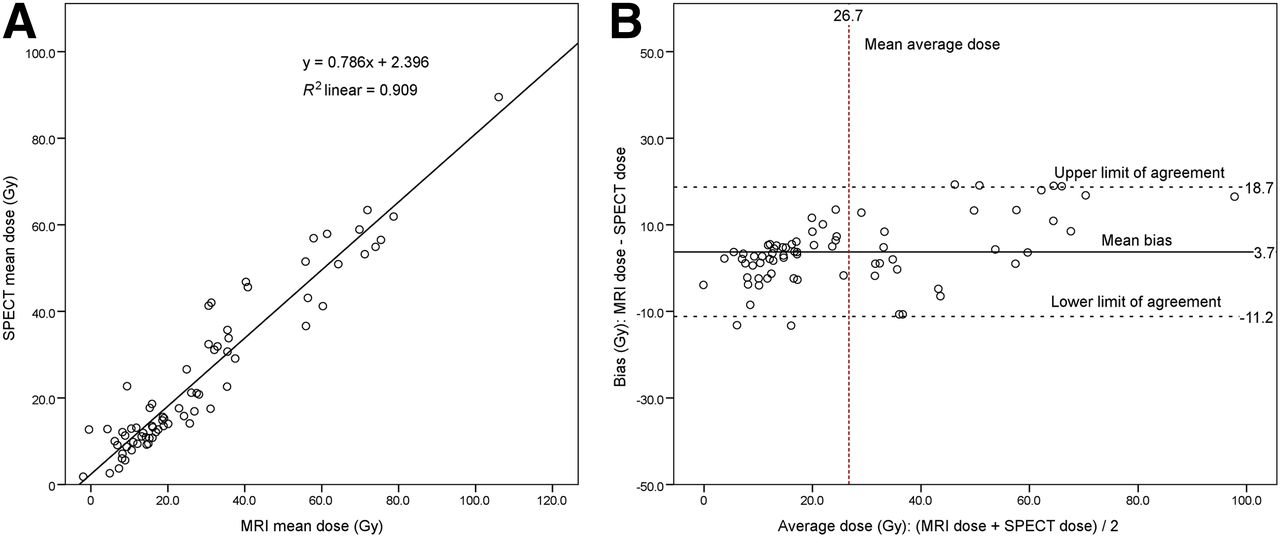
Gross distribution assessment with MR imaging and SPECT for 72 liver segments in 9 patients. (A) Linear regression analysis (correlation). (B) Bland–Altman plot visualizing agreement between the 2 measurements.
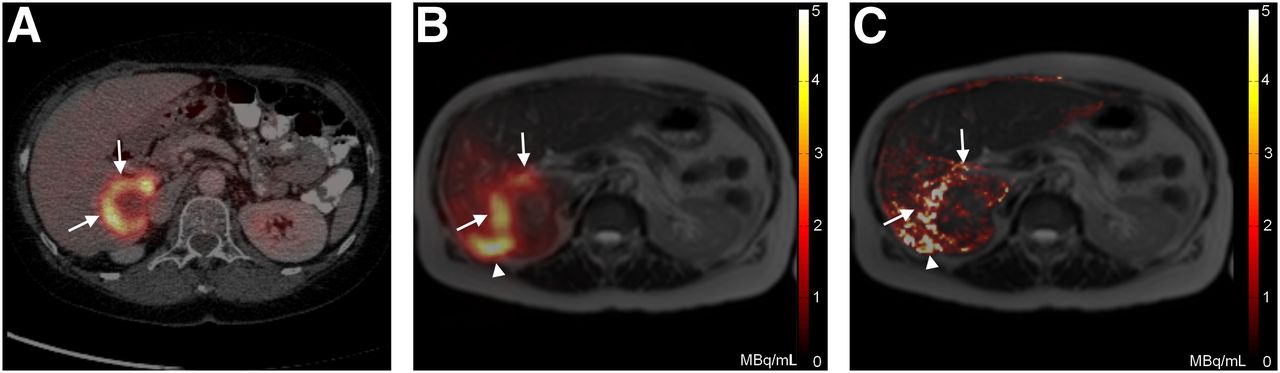
Intrahepatic biodistribution on SPECT and MR imaging. (A) Baseline 18F-FDG PET fused with CT depicting peripherally 18F-FDG–enhancing colorectal liver metastasis (arrows). (B) SPECT fused with MR imaging of liver shows 166Ho-microsphere deposition primarily in 18F-FDG–avid region of same tumor and in region not 18F-FDG–avid (arrowhead). (C) MR imaging–based ΔR2* map shows more detailed map of microsphere distribution because of the higher resolution of MR.
Liver Volumes and Dose Data Based on SPECT and MR Imaging
T/N Ratios Based on SPECT and MR Imaging
DISCUSSION
This paper describes the results of SPECT- and MR imaging–based dosimetry in the first patients treated with 166Ho radioembolization. We were able to visualize and quantify the distribution of microspheres within the liver and reliably perform dosimetry based on SPECT and MR imaging. The ability to perform dosimetry can benefit the patient because radioembolization can be performed in a more controlled fashion, with knowledge of the amount of microspheres arriving in the tumor and in the normal liver and the ability to adjust the treatment plan accordingly.
The theoretic advantage of intraarterial liver therapies is based on the assumption that the hepatic artery selectively feeds tumors and not the normal liver and that high T/N ratios would consequently result. In this study, we were able to determine the amount of microspheres that arrived in the tumor and the amount of microspheres that arrived in the normal liver (T/N ratio) for patients treated with 166Ho radioembolization. T/N ratios achieved in radioembolization have previously been investigated in several series and ranged widely from 0.4 to 15.4 in patients with metastases (25–29). However, these T/N ratios were often estimated using pretreatment 99mTc-MAA distributions (25,26,28,29), or tumors were not delineated on the basis of anatomy but were assumed to lie exactly where a 99mTc-MAA hot spot was visible (28). In other cases, T/N ratios were calculated on the basis of only a selection of tumors, only the hot spots within a tumor, or comparison with an arbitrarily chosen normal-liver region in the rest of the liver (25). The median overall T/N ratio found in our study population was only 1.4, and the range was 0.9–2.8. However, when a peak T/N ratio for the hottest tumor per patient was calculated, these figures were considerably higher (median peak T/N ratio, 5.1; range, 1.3–12.1). Thus, peak T/N ratios can be misleading since one may interpret the activity concentration in the entire volume of tumor to be as high as 5.1 times the activity concentration in the entire nontumorous liver, whereas this activity concentration was actually only 1.4 times as high. On the other hand, when taking the entire tumor volume into account for calculation of overall T/N ratios, a tumor receiving little activity in its nonviable core but a tumoricidal dose to its viable parts may still display an overall T/N ratio of less than 1. Peak T/N ratios are not affected this way. Another factor that may be of influence in T/N ratio assessment is the occurrence of activity spill-in or spill-out. We know from the phantom setups that the accuracy of the calculated SPECT-based activity concentration in a VOI is hindered by spill-in or spill-out of activity. This effect may lead to over- or underestimation of the true activity in a VOI, the degree of which depends on the size of the VOI and the activity concentration ratio between the VOI and its surroundings. Corrected for these effects, the median overall T/N ratio in this population was slightly higher (1.6).
In this study, patients with uveal melanoma metastases had the highest T/N ratios, as is in line with the generally more pronounced arterial vascularity of these tumors (30). T/N ratios may be influenced by microsphere-specific characteristics such as the size and amount of microspheres injected. We do not, however, believe that the specific properties of 166Ho-poly(l-lactic acid)-microspheres caused the T/N ratios to be lower than the reported T/N ratios for 90Y-microspheres. Catheter position during administration is in our opinion a more important factor. In this study, microspheres were administered from the proper, common, right or left hepatic artery. Administration from a more selective catheter position might lead to higher T/N ratios.
SPECT- and MR imaging–based dosimetry on liver segments showed a high correlation and moderate agreement, which supports the validity of both modalities for gross intrahepatic dosimetry. The correlation for tumor dosimetry was also high, and equivalent T/N ratios (median, 1.4) were obtained with both modalities. However, the low agreement for tumor dosimetry, according to our predefined criteria, indicates a significant uncertainty in the bias between MR imaging– and SPECT-based doses on a specific tumor. These criteria may be too strict for tumor dosimetry since the uncertainty on this smaller level is intrinsically higher. The low agreement on this level may be caused in part by registration errors, since there were many small lesions, but also by differences between the modalities. Both SPECT and MR imaging have their specific advantages, such as, for SPECT, a superior sensitivity and accuracy (10) and, for MR imaging, high soft-tissue contrast, high resolution, and anatomic reference potentially eliminating the need for registration. These 2 independent modalities may complement each other when combined. MR imaging does not, for instance, rely on radioactivity but on differences in susceptibility. This property enables assessment of the biodistribution of decayed microspheres long after therapy or the distribution of a nonradioactive scout dose but makes intrahepatic dosimetry also sensitive to susceptibility artifacts. Furthermore, SPECT remains crucial for assessment of any extrahepatic distribution because MR imaging–based dose assessment is hampered by susceptibility artifacts around air-containing organs such as the lungs and intestines. MR imaging dosimetry may be locally more accurate than SPECT dosimetry because of the high resolution of MR imaging, which provides a high level of detail and is less susceptible to partial-volume effects. This is probably the reason that higher peak T/N ratios were found for MR imaging.
A great amount of imaging was involved in this study for dosimetric purposes: 3 MR imaging sessions, 3 scintigraphy sessions, and SPECT or SPECT/CT. This amount of imaging is not desirable for clinical practice since these examinations are costly and a burden for the patient. Therefore, future research will need to facilitate the decision on whether to continue with 99mTc-MAA or with 166Ho-microspheres to predict biodistribution and whether to use SPECT or MR imaging for dosimetry. At this point, SPECT is the most obvious modality to use for dosimetry since SPECT-based dosimetry is sensitive and specific and MR imaging–based dose assessment is limited by artifacts and may be contraindicated in some patients (such as those with claustrophobia, metal devices, or shrapnel). However, MR imaging–based dosimetry continues to improve and might prove valuable for future purposes such as real-time dosimetry during MR imaging–guided radioembolization (31).
This study was limited by the small number of patients and the variation in primary tumor types. The heterogeneity of the study population is, however, a true reflection of the population of patients that is referred to our institute for radioembolization. Furthermore, tumors were delineated manually, and distinguishing tumor and normal liver tissue on MR imaging leaves room for subjective interpretation. Using functional imaging such as 18F-FDG PET for tumor delineation may be more appropriate since it can separate nonviable tumor tissue from viable tumor tissue. Determining whether liver segments were precisely delineated according to Bismuth’s adaptation of the Couinaud classification was not essential for this study’s analyses. We sought to divide the liver into several subregions to assess SPECT- and MR imaging–based dosimetry, and we chose Bismuth’s adaptation of the Couinaud classification because it is well known by clinicians, is based on anatomic landmarks, and divides the liver into approximately 100- to 500-mL portions, which are large enough to compare the gross intrahepatic biodistribution assessment based on SPECT and MR imaging. The calculated absorbed doses on SPECT and MR imaging were consistently lower than the desired liver absorbed doses of 20–80 Gy because of residual activity in the administration system, lung shunting, and activity in the liver hilus, which was excluded on segmentation.
Now that in vivo posttreatment dosimetry of 166Ho-microspheres and early recognition of inadequately treated tumors is feasible with both SPECT and MR imaging, a personalized approach in which inadequately treated tumors receive additional, selective treatment is advised. These next-generation microspheres for radioembolization are therapeutic and imaging agents in one and provide the opportunity to see what one is treating. Suboptimal treatment can be detected by MR imaging and SPECT, and a retreatment plan can be elaborated to ensure the full efficacy of the treatment. To date, dose–response relationships reported for radioembolization are often based on the distribution of 99mTc-MAA particles and not on the actual microsphere distribution (3,32), with exceptions such as the study by Strigari et al. (33). In the current study, we found a weak to moderate dose–response relationship when looking at decrease in tumor diameter. We think that decrease in tumor diameter as used for response assessment is too indirect a measure of response for individual tumors. Using an indicator of functional tumor response such as the apparent diffusion coefficient on diffusion-weighted MR imaging or an 18F-FDG PET marker might show a closer dose–response relationship (22,34). Investigating if a higher tumor dose leads to better functional tumor response and prolonged patient survival will be the focus of future studies on 166Ho radioembolization. The value of a scout dose of a small amount of 166Ho-microspheres to predict the posttreatment absorbed dose distribution in the liver will have to be studied and compared with the conventional 99mTc-MAA scout dose. If predictive, a scout dose of 166Ho-microspheres might allow pretreatment dosimetry and identification of patients who will not benefit from treatment because of an unfavorable biodistribution or patients who need extra precautions because of a high normal-liver absorbed dose. In addition, the favorable MR imaging characteristics of 166Ho-microspheres may allow for administration under real-time MR imaging guidance with direct visualization of the distribution of microspheres (i.e., per-treatment dosimetry) (31).
CONCLUSION
The purpose of this study was to evaluate SPECT- and MR imaging–based dosimetry in the first patients treated with 166Ho radioembolization. Dose to the tumorous and nontumorous liver was quantitatively determined, and median T/N ratios were found to be only 1.4 (overall) and 2.0 (peak). Many tumors had received a lower concentration of activity than the nontumorous liver. Using 166Ho-microspheres, in vivo dosimetry based on SPECT and MR imaging correlated well for dose to liver segments and dose to tumors. These results may enable personalized treatment by selective targeting of inadequately treated tumors.
DISCLOSURE
The costs of publication of this article were defrayed in part by the payment of page charges. Therefore, and solely to indicate this fact, this article is hereby marked “advertisement” in accordance with 18 USC section 1734. This study was supported by the Dutch Cancer Society (KWF Kankerbestrijding, grant UU2009-4346), the Technology Foundation STW (grants 06069, 06448, and 11936), and in part by the Alexandre Suerman MD/PhD grant of the University Medical Center Utrecht. Three of the authors were the inventors of 166Ho-poly(l-lactic acid)-microspheres, of which the patents are assigned to University Medical Center Utrecht Holding BV (US 6,373,068 B1 and US 2005/0201940 A1). No other potential conflict of interest relevant to this article was reported.
Acknowledgments
We thank Tjitske Bosma for coordinating the study, Remmert de Roos for preparing the microspheres, and Mehmet Sarilar, Menno Blaauw, Dirk de Vries, Rik Linssen, and Bert Wolterbeek for irradiating the microspheres at the Reactor Institute Delft, Delft University of Technology (Delft, The Netherlands).
Footnotes
Published online Oct. 17, 2013.
- © 2013 by the Society of Nuclear Medicine and Molecular Imaging, Inc.
REFERENCES
- Received for publication January 16, 2013.
- Accepted for publication July 9, 2013.


