


Abstract
Resistance to current drug therapy is an important issue in the treatment of epilepsy. Inadequate access of central nervous system drugs to their targets in the brain may be caused by overexpression or overactivity of multidrug transporters, such as P-glycoprotein (P-gp), at the blood–brain barrier. Laniquidar, an inhibitor of P-gp, has been labeled with 11C for use in PET studies of P-gp expression in humans. Given potential interspecies differences in biodistribution, the purpose of this study was to ensure safe use of 11C-laniquidar by determining the dosimetry of 11C-laniquidar using whole-body PET studies. Methods: Six healthy volunteers were subjected to a series of 10 whole-body PET scans within approximately 70 min. Five blood samples were taken during the series. Results: High uptake of 11C-laniquidar was seen in liver, spleen, kidneys, and lung, whereas brain uptake was low. The effective dose for 11C-laniquidar was 4.76 ± 0.13 and 3.69 ± 0.01 μSv·MBq−1 for women and men, respectively. Conclusion: Biodistribution and measured effective dose indicate that 11C-laniquidar is a safe tracer for PET imaging, with a total dose of about 2 mSv for a brain PET/CT protocol.
Resistance to drug therapy affects approximately 30% of all patients with epilepsy (1) and may be due, at least in part, to decreased passage of antiepileptic drugs across the blood–brain barrier. Uptake and efflux drug transporters play a major functional role in regulating drug entry into the brain. Two large and important drug transporter families are the organic anion–transporting polypeptide (OATP) family and the adenosine triphosphate–binding cassette transporter superfamily (2,3). Several members of both families are expressed at the human blood–brain barrier, including OATP1A2, OATP1C1, and OATP3A1 (members of the OATP family) and P-glycoprotein (P-gp), breast cancer resistance protein, and multidrug resistance protein 4 (members of the adenosine triphosphate–binding transporter superfamily) (2,3). In this paper, the focus is on the most widely studied efflux transporter, P-gp. It has been proposed that changes in P-gp expression or function at the blood–brain barrier play an important role in pharmacoresistance in epilepsy (4). The multidrug transporter P-gp and other efflux transporters actively transport substrates, including many central nervous system drugs, against a concentration gradient from brain to blood and cerebrospinal fluid. Hence, overexpression or increased activity of the transporter system may result in reduced tissue concentrations of central nervous system drugs in the brain, thereby greatly limiting their therapeutic efficacy. There are two case reports suggesting that inhibiting P-gp in medically refractory epilepsy patients decreases seizure frequency, at least temporarily (5,6). P-gp functionality can be assessed in vivo by means of (R)-11C-verapamil and 11C-N-desmethyl-loperamide PET scans (7,8). However, at present overexpression of P-gp in refractory patients can be confirmed only by examining postmortem brain tissue or surgically removed brain tissue. Therefore, the availability of noninvasive imaging techniques that would allow assessment of the distribution of P-gp in the brain is of vital importance. Laniquidar is an inhibitor of P-gp (9) and therefore should bind proportionally to P-gp density. Recently, this compound was labeled with 11C and its biodistribution in rats was evaluated (10). Previously, however, metabolic profiles for the P-gp substrate tracer (R)-11C-verapamil were shown to differ substantially between species (11,12), as may also be the case for 11C-laniquidar. Therefore, the purpose of the present study was to determine the radiation dosimetry of 11C-laniquidar based on biodistribution studies in humans.
MATERIALS AND METHODS
Subjects
Six healthy subjects with no evidence of renal or hepatic dysfunction (4 men and 2 women) were included. They had a mean age (±SD) of 43 ± 18 y and a mean body weight of 86 ± 23 kg. Before inclusion, each participant signed a protocol-specific informed consent form. The study was approved by the Medical Ethics Review Committee of the VU University Medical Center.
Synthesis of 11C-Laniquidar
11C-laniquidar was synthesized according to good-manufacturing-practice standards as described previously (10), with some modifications to enable human use. Briefly, 2.1 ± 0.6 GBq of 11C-laniquidar were obtained via alkylation of O-desmethyl laniquidar (R102207) with 11C-methyl triflate and, after purification by high-performance liquid chromatography, reformulated in a sterile aqueous solution of 0.9% NaCl, 2.5% polysorbate 80, and 8.5% ethanol. Radiochemical purity was higher than 98%, and no chemical impurities were observed as assessed by radio/ultraviolet high-performance liquid chromatography. The identity of the product was confirmed by comparing its retention time with that of authentic laniquidar. The mean specific activity at the time of injection was 70 ± 24 GBq·μmol−1.
Scan Protocol
Each subject received 2 venous cannulas. One cannula was used for tracer administration and the other for blood sampling (the use of two separate cannulas excludes the possibility of contamination of blood samples with radioactivity traces left from the intravenous administration). Subsequently, the subjects were positioned on the bed of a Gemini TF 64 PET/CT scanner (Philips). The mean and SD of the administered mass of 11C-laniquidar were 3.5 ± 1.4 μg (range, 2.2–5.9 μg). The mean administered activity was 347 ± 63 MBq (range, 222–396 MBq). After a 35-mAs low-dose whole-body (WB) CT scan, a series of 10 WB sweeps was started (30 s per bed position, typically 11 bed positions), covering the interval between 0 and about 70 min after tracer injection. Five blood samples per subject were taken manually, one after each odd-numbered WB scan.
Data Analysis
Radioactivity in 0.5-mL blood samples was measured with a γ counter (Perkin Elmer). All WB PET scans were reconstructed using the standard WB time-of-flight reconstruction algorithm, including normalization of the data as well as scatter, attenuation, decay, and dead-time corrections (13). In particular, decay correction was performed within each scan (to account for the time difference between the various bed positions) but not for each scan with respect to the time of injection (since residence time calculations should be performed on non–decay-corrected source organ time–activity data). Regions of interest were defined for organs that showed positive image contrast on a PET image: myocardium, liver, kidneys, spleen, and lungs. With the exception of the lungs, these regions were delineated on an early PET scan. Organs that did not have a positive contrast in the PET scan were regarded as a part of the remainder of the body in the subsequent calculation of the radiation-absorbed dose. In addition, the brain was delineated on the CT scan, because brain imaging is the intended use of the tracer. Both CT regions were automatically segmented on the basis of a Hounsfield unit threshold. The lung region of interest was manually edited if the location on the respiration-averaged PET scan differed from that on the CT scan. All regions of interest were copied onto all PET scans to generate mean time–activity concentration curves per organ. At the end of the PET studies, activity remained in various organs. To account for this residual activity, each individual time–activity curve was extrapolated to infinity by assuming only physical decay from the end of the last WB scan onward. In this extrapolation, biologic clearance is ignored, resulting in a worst-case estimate of residual activity and thus an upper limit of the estimated radiation dose. The red marrow activity concentration was assumed to be one third of the whole-blood activity concentration (14). The area under each time–activity curve was integrated, and the residence time for each organ was obtained through multiplication of this area by the scaled organ mass from reference man or woman and division by the injected dose. To calculate the residence time for the remainder of the body, residence times of all source organs were summed and subtracted from the fixed theoretic value in the absence of excretion. The software package OLINDA was used to calculate the effective dose in μSv·MBq−1 according to International Commission on Radiological Protection publication 60 (15) tissue weighting factors (16).
RESULTS
There were no adverse or clinically detectable pharmacologic effects in any of the 6 subjects. No significant changes in vital signs were observed. No patient motion between CT and PET scans was observed. A typical coronal WB slice of 11C-laniquidar uptake as a function of time is shown in Figure 1. Urinary bladder and testes did not show significant tracer accumulation and therefore were not included in dose calculations. Figure 2 shows time–activity curves for individual organs and for blood sampling averaged over all subjects. Organ, red marrow, and effective doses are given in Table 1. Data for individual subjects are presented to illustrate interindividual variability. An average effective dose of 4.76 ± 0.13 and 3.69 ± 0.01 μSv·MBq−1 was obtained for women and men, respectively.

Coronal views showing biodistribution of 11C-laniquidar as function of time (numbers in panels indicate start time of scan after injection [min]) for subject F-1. No decay correction was performed between images; that is, images illustrate sum of biologic clearance and physical decay. For upper row, image scale runs between SUV of 0 (white) and 16 (black). For lower row, these numbers are 0 and 4, respectively.
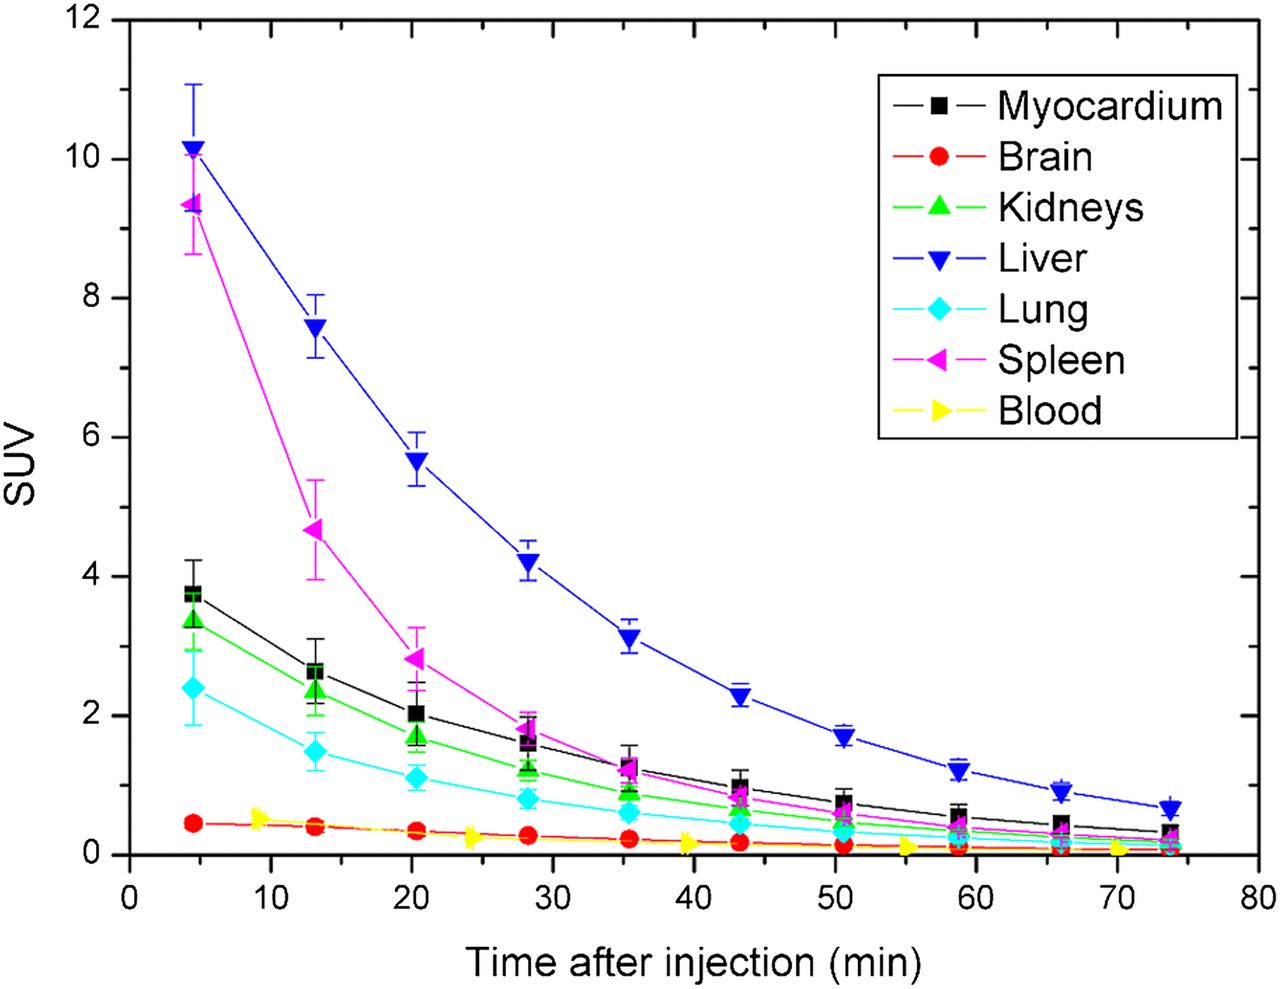
Time–activity curves of individual organs and whole blood averaged over all patients.
Absorbed Organ Doses and Effective Dose for Individual Subjects (μSv·MBq−1)
DISCUSSION
The measurement protocol allowed for good visualization of tracer kinetics in the body. There was no indication of patient motion either between the CT and the PET scans or during the PET scans. The biodistribution of 11C-laniquidar showed highest uptake in liver, followed by spleen, kidneys, and lung. In rats, highest uptake was seen in lung, followed by liver, spleen, and kidney (10). It is not known why lung uptake seems to be species-dependent. All time–activity curves were descending, allowing for a reasonable estimate of the residence time for the interval after the scanning period. The absence of contrast in the lumbar vertebrae at the end of the scanning period suggests no active uptake in the bone marrow, allowing for an estimate of the bone marrow residence time from the blood samples. Organ and effective doses reproduced well despite the small number of female (n = 4) and male (n = 2) subjects. The measured average effective dose of 4.40 ± 0.56 μSv·MBq−1 is within the range observed for other 11C-based tracers (17). The liver receives the highest organ dose of approximately 25 μSv·MBq−1. A typical injection of 370 MBq would lead to a total dose of approximately 2 mSv for a brain PET/CT protocol (including a low-dose CT scan).
CONCLUSION
In this dosimetry study, the average effective dose derived from 11C-laniquidar was 4.40 ± 0.56 μSv·MBq−1. Therefore, 11C-laniquidar is safe for PET imaging of P-gp expression on the current generation of PET/CT scanners.
DISCLOSURE
The costs of publication of this article were defrayed in part by the payment of page charges. Therefore, and solely to indicate this fact, this article is hereby marked “advertisement” in accordance with 18 USC section 1734. This work was supported by the European Community’s Seventh Framework Programme (FP7/2007-2013) under grant agreement no. 201380. No other potential conflict of interest relevant to this article was reported.
Acknowledgments
We thank Prof. Ronald Boellaard for fruitful discussions and Dr. Marieke J. Hazewinkel for help with determining the regions of interest.
Footnotes
Published online Oct. 3, 2013.
- © 2013 by the Society of Nuclear Medicine and Molecular Imaging, Inc.
REFERENCES
- Received for publication January 31, 2013.
- Accepted for publication August 16, 2013.


