
Main menu

  • Home
  • Content
    • Current
    • Ahead of print
    • Past Issues
    • JNM Supplement
    • SNMMI Annual Meeting Abstracts
    • Continuing Education
    • JNM Podcasts
  • Subscriptions
    • Subscribers
    • Institutional and Non-member
    • Rates
    • Journal Claims
    • Corporate & Special Sales
  • Authors
    • Submit to JNM
    • Information for Authors
    • Assignment of Copyright
    • AQARA requirements
  • Info
    • Reviewers
    • Permissions
    • Advertisers
  • About
    • About Us
    • Editorial Board
    • Contact Information
  • More
    • Alerts
    • Feedback
    • Help
    • SNMMI Journals
  • SNMMI
    • JNM
    • JNMT
    • SNMMI Journals
    • SNMMI

User menu

  • Subscribe
  • My alerts
  • Log in
  • My Cart

Search

  • Advanced search
Journal of Nuclear Medicine
  • SNMMI
    • JNM
    • JNMT
    • SNMMI Journals
    • SNMMI
  • Subscribe
  • My alerts
  • Log in
  • My Cart
Journal of Nuclear Medicine

Advanced Search

  • Home
  • Content
    • Current
    • Ahead of print
    • Past Issues
    • JNM Supplement
    • SNMMI Annual Meeting Abstracts
    • Continuing Education
    • JNM Podcasts
  • Subscriptions
    • Subscribers
    • Institutional and Non-member
    • Rates
    • Journal Claims
    • Corporate & Special Sales
  • Authors
    • Submit to JNM
    • Information for Authors
    • Assignment of Copyright
    • AQARA requirements
  • Info
    • Reviewers
    • Permissions
    • Advertisers
  • About
    • About Us
    • Editorial Board
    • Contact Information
  • More
    • Alerts
    • Feedback
    • Help
    • SNMMI Journals
  • View or Listen to JNM Podcast
  • Visit JNM on Facebook
  • Join JNM on LinkedIn
  • Follow JNM on Twitter
  • Subscribe to our RSS feeds
Research ArticleBasic Science Investigations

Mapping Changes in Mouse Brain Metabolism with PET/CT

Andy Welch, Marco Mingarelli, Gernot Riedel and Bettina Platt
Journal of Nuclear Medicine November 2013, 54 (11) 1946-1953; DOI: https://doi.org/10.2967/jnumed.113.121509
Andy Welch
1School of Medicine and Dentistry, University of Aberdeen, Aberdeen, United Kingdom; and
  • Find this author on Google Scholar
  • Find this author on PubMed
  • Search for this author on this site
Marco Mingarelli
1School of Medicine and Dentistry, University of Aberdeen, Aberdeen, United Kingdom; and
  • Find this author on Google Scholar
  • Find this author on PubMed
  • Search for this author on this site
Gernot Riedel
2School of Medical Sciences, University of Aberdeen, Aberdeen, United Kingdom
  • Find this author on Google Scholar
  • Find this author on PubMed
  • Search for this author on this site
Bettina Platt
2School of Medical Sciences, University of Aberdeen, Aberdeen, United Kingdom
  • Find this author on Google Scholar
  • Find this author on PubMed
  • Search for this author on this site
  • Article
  • Figures & Data
  • Info & Metrics
  • PDF
Loading

Article Figures & Data

Figures

  • Tables
  • FIGURE 1.
    • Download figure
    • Open in new tab
    • Download powerpoint
    FIGURE 1.

    Matched PET images from 4 representative mice used in this study. Warmer colors represent higher activity.

  • FIGURE 2.
    • Download figure
    • Open in new tab
    • Download powerpoint
    FIGURE 2.

    Comparison between %ID/g (A), SUV (B), and whole-brain normalized uptake (C) for 12 regions of Mirrione atlas and for each frame. Images were normalized using CT–CT registration, and results are for 6-mo group. Error bars indicate mean + SD of group.

  • FIGURE 3.
    • Download figure
    • Open in new tab
    • Download powerpoint
    FIGURE 3.

    SPM images (from left to right: coronal, sagittal, and horizontal axis) of reduction in uptake in frame 4, compared with frame 1 (for 6-mo CT–CT registered data). Images at top show complete spectrum of T values, images in the middle show threshold applied at level of uncorrected P < 0.001, and images at bottom show threshold applied at level of familywise error–corrected P < 0.05. SPM images are overlaid on T2 image from Mirrione atlas for anatomic reference, and same color scale (where warmest color represents T value of 20) was used for all images.
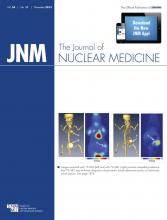
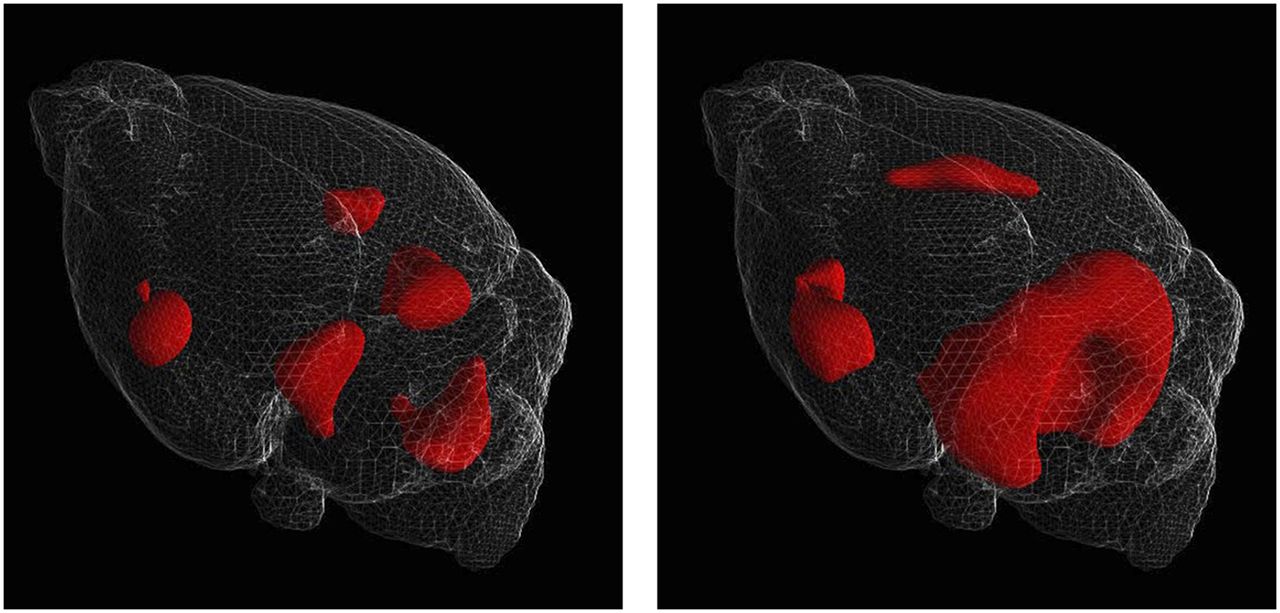
  • FIGURE 4.
    • Download figure
    • Open in new tab
    • Download powerpoint
    FIGURE 4.

    Surface-rendered 3-dimensional SPM images depict reduction in metabolism for 6-mo vs. 10-mo groups (left) and 6-mo vs. 14-mo groups (right). Images were registered using CT–CT method and normalized to whole-brain activity, and 1.0 mm of smoothing was applied. A surface rendering of the T2-weighted MR image is provided to aid localization.

Tables

  • Figures
    • View popup
    TABLE 1

    Details of Mice Used

    6 mo10 mo14 mo
    Mouse no.Age (mo)Weight (g)Age (mo)Weight (g)Age (mo)Weight (g)
    1 (F)5.43410.45013.758
    2 (M)6.74610.85114.053
    3 (M)6.94911.64914.046
    4 (M)6.13610.04015.338
    5 (M)6.14310.74313.448
    6 (M)6.43211.04113.742
    7 (F)6.12410.32815.330
    8 (M)5.83210.23813.337
    9 (F)7.12811.83214.437
    10 (M)5.83210.03515.342
    11 (M)6.13210.03115.335
    12 (F)6.62910.23915.355
    Average6.334.810.639.814.443.4
    SD0.57.50.67.60.88.7
    • View popup
    TABLE 2

    Maximum T Scores in Various Brain Regions from SPM Analysis of Reduction in Metabolism from 6 to 10 Months

    CT–CTPET–PET
    RegionSUVNormSUVNorm
    Whole brain2.948.402.705.56
    Caudal brain stem2.948.402.424.15
    Cerebellum2.905.692.605.10
    Striatum2.625.792.413.55
    Midbrain2.595.972.445.56
    Cortex2.586.002.704.84
    Thalamus2.566.282.414.90
    Hippocampus2.555.502.404.75
    Amygdala2.442.702.220.00
    Hypothalamus2.372.972.160.69
    Basal forebrain and septum2.352.272.260.17
    Olfactory bulb2.150.082.562.19
    • Scan length = 40 min; smoothing = 1.0 mm.

    • Data are for images registered using CT–CT and PET–PET and for images scaled to units of SUV and normalized to whole-brain activity.

    • View popup
    TABLE 3

    Maximum T Scores in Caudal Brain Stem for 2 Age Comparisons with Different Scan Lengths and Smoothing Levels

    Level of smoothing
    CT–CTPET–PET
    Scan length0.00.51.01.50.00.51.01.5
    6–10 mo
     10 min*7.857.697.076.114.944.804.423.66
     20 min*7.707.227.066.174.154.113.973.66
     30 min*7.517.908.486.594.744.053.673.48
     40 min*8.479.008.406.104.124.184.153.92
    10–14 mo
     10 min*6.536.486.646.874.164.174.103.65
     20 min*6.276.576.346.405.785.434.513.90
     30 min*6.786.716.366.795.895.925.104.32
     40 min*6.746.836.837.045.195.224.964.46
    • ↵* Significant difference (P < 0.05) between CT–CT and PET–PET, based on paired t test over 4 levels of smoothing.

    • View popup
    TABLE 4

    Maximum T Scores in Various Brain Regions from SPM Analysis of Reduction in Metabolism with Age for Various Scan Lengths and Smoothing Levels

    Level of smoothing
    6–10 mo*10–14 mo
    Region0.00.51.01.50.00.51.01.5
    10 min
     Caudal brain stem7.857.697.076.116.536.486.646.87
     Cerebellum7.086.387.196.556.115.857.208.09
     Striatum5.275.045.094.803.523.703.933.53
     Midbrain8.888.728.357.313.723.192.943.17
     Cortex7.016.505.614.924.253.814.465.25
    20 min
     Caudal brain stem7.707.227.066.176.276.576.346.40
     Cerebellum6.976.746.225.277.156.957.498.24
     Striatum5.685.604.884.504.214.324.063.30
     Midbrain8.478.327.396.082.582.552.462.54
     Cortex6.666.345.294.395.355.626.356.72
    30 min
     Caudal brain stem7.517.908.486.596.786.716.366.79
     Cerebellum6.326.236.305.827.366.546.707.98
     Striatum7.606.595.355.174.664.754.643.53
     Midbrain7.707.526.755.973.673.392.932.99
     Cortex6.996.625.794.945.285.396.056.47
    40 min
     Caudal brain stem8.479.008.406.106.746.836.837.04
     Cerebellum6.075.975.695.196.006.056.707.44
     Striatum7.356.665.794.973.773.663.162.39
     Midbrain6.916.685.975.283.723.092.833.08
     Cortex7.877.186.004.955.165.465.855.73
    • ↵* Effect of smoothing was significant for 6- to 10-mo comparison, based on 2-way repeated-measures ANOVA with smoothing and scan length as factors.

PreviousNext
Back to top

In this issue

Journal of Nuclear Medicine: 54 (11)
Journal of Nuclear Medicine
Vol. 54, Issue 11
November 1, 2013
  • Table of Contents
  • Table of Contents (PDF)
  • About the Cover
  • Index by author
Print
Download PDF
Article Alerts
Sign In to Email Alerts with your Email Address
Email Article

Thank you for your interest in spreading the word on Journal of Nuclear Medicine.

NOTE: We only request your email address so that the person you are recommending the page to knows that you wanted them to see it, and that it is not junk mail. We do not capture any email address.

Enter multiple addresses on separate lines or separate them with commas.
Mapping Changes in Mouse Brain Metabolism with PET/CT
(Your Name) has sent you a message from Journal of Nuclear Medicine
(Your Name) thought you would like to see the Journal of Nuclear Medicine web site.
Citation Tools
Mapping Changes in Mouse Brain Metabolism with PET/CT
Andy Welch, Marco Mingarelli, Gernot Riedel, Bettina Platt
Journal of Nuclear Medicine Nov 2013, 54 (11) 1946-1953; DOI: 10.2967/jnumed.113.121509

Citation Manager Formats

  • BibTeX
  • Bookends
  • EasyBib
  • EndNote (tagged)
  • EndNote 8 (xml)
  • Medlars
  • Mendeley
  • Papers
  • RefWorks Tagged
  • Ref Manager
  • RIS
  • Zotero
Share
Mapping Changes in Mouse Brain Metabolism with PET/CT
Andy Welch, Marco Mingarelli, Gernot Riedel, Bettina Platt
Journal of Nuclear Medicine Nov 2013, 54 (11) 1946-1953; DOI: 10.2967/jnumed.113.121509
Twitter logo Facebook logo LinkedIn logo Mendeley logo
  • Tweet Widget
  • Facebook Like
  • Google Plus One
Bookmark this article

Jump to section

  • Article
    • Abstract
    • MATERIALS AND METHODS
    • RESULTS
    • DISCUSSION
    • CONCLUSION
    • DISCLOSURE
    • Footnotes
    • REFERENCES
  • Figures & Data
  • Info & Metrics
  • PDF

Related Articles

  • This Month in JNM
  • PubMed
  • Google Scholar

Cited By...

  • Effect of gedunin on glioblastoma proliferation and invasiveness: In vitro and in vivo approaches
  • HSP90 inhibitor gedunin impairs glioblastoma proliferation and invasiveness
  • HSP90 inhibitor gedunin impairs glioblastoma proliferation and invasiveness
  • Google Scholar

More in this TOC Section

  • Tumor-Specific Binding of Radiolabeled PEGylated GIRLRG Peptide: A Novel Agent for Targeting Cancers
  • PET/MRI of Hypoxic Atherosclerosis Using 64Cu-ATSM in a Rabbit Model
  • Tumor Uptake of Anti-CD20 Fabs Depends on Tumor Perfusion
Show more Basic Science Investigations

Similar Articles

Keywords

  • PET
  • preclinical
  • mouse
  • brain
  • 18F-FDG
SNMMI

© 2025 SNMMI

Powered by HighWire