
Main menu

  • Home
  • Content
    • Current
    • Ahead of print
    • Past Issues
    • JNM Supplement
    • SNMMI Annual Meeting Abstracts
    • Continuing Education
    • JNM Podcasts
  • Subscriptions
    • Subscribers
    • Institutional and Non-member
    • Rates
    • Journal Claims
    • Corporate & Special Sales
  • Authors
    • Submit to JNM
    • Information for Authors
    • Assignment of Copyright
    • AQARA requirements
  • Info
    • Reviewers
    • Permissions
    • Advertisers
  • About
    • About Us
    • Editorial Board
    • Contact Information
  • More
    • Alerts
    • Feedback
    • Help
    • SNMMI Journals
  • SNMMI
    • JNM
    • JNMT
    • SNMMI Journals
    • SNMMI

User menu

  • Subscribe
  • My alerts
  • Log in
  • My Cart

Search

  • Advanced search
Journal of Nuclear Medicine
  • SNMMI
    • JNM
    • JNMT
    • SNMMI Journals
    • SNMMI
  • Subscribe
  • My alerts
  • Log in
  • My Cart
Journal of Nuclear Medicine

Advanced Search

  • Home
  • Content
    • Current
    • Ahead of print
    • Past Issues
    • JNM Supplement
    • SNMMI Annual Meeting Abstracts
    • Continuing Education
    • JNM Podcasts
  • Subscriptions
    • Subscribers
    • Institutional and Non-member
    • Rates
    • Journal Claims
    • Corporate & Special Sales
  • Authors
    • Submit to JNM
    • Information for Authors
    • Assignment of Copyright
    • AQARA requirements
  • Info
    • Reviewers
    • Permissions
    • Advertisers
  • About
    • About Us
    • Editorial Board
    • Contact Information
  • More
    • Alerts
    • Feedback
    • Help
    • SNMMI Journals
  • View or Listen to JNM Podcast
  • Visit JNM on Facebook
  • Join JNM on LinkedIn
  • Follow JNM on Twitter
  • Subscribe to our RSS feeds
Research ArticleBasic Science Investigations

A PET-Compatible Tissue Bioreactor for Research, Discovery, and Validation of Imaging Biomarkers and Radiopharmaceuticals: System Design and Proof-of-Concept Studies

Timothy D. Whitehead, Samuel T. Nemanich, Carmen Dence and Kooresh I. Shoghi
Journal of Nuclear Medicine October 2013, 54 (10) 1812-1819; DOI: https://doi.org/10.2967/jnumed.113.119776
Timothy D. Whitehead
1Department of Radiology, Washington University in St. Louis, St. Louis, Missouri
  • Find this author on Google Scholar
  • Find this author on PubMed
  • Search for this author on this site
Samuel T. Nemanich
1Department of Radiology, Washington University in St. Louis, St. Louis, Missouri
  • Find this author on Google Scholar
  • Find this author on PubMed
  • Search for this author on this site
Carmen Dence
1Department of Radiology, Washington University in St. Louis, St. Louis, Missouri
  • Find this author on Google Scholar
  • Find this author on PubMed
  • Search for this author on this site
Kooresh I. Shoghi
1Department of Radiology, Washington University in St. Louis, St. Louis, Missouri
2Department of Biomedical Engineering, Washington University in St. Louis, St. Louis, Missouri; and
3Division of Biology and Biomedical Sciences, Washington University in St. Louis, St. Louis, Missouri
  • Find this author on Google Scholar
  • Find this author on PubMed
  • Search for this author on this site
  • Article
  • Figures & Data
  • Supplemental
  • Info & Metrics
  • PDF
Loading

Article Figures & Data

Figures

  • Tables
  • Additional Files
  • FIGURE 1.
    • Download figure
    • Open in new tab
    • Download powerpoint
    FIGURE 1.

    Schematic diagram of TBR system integrated with microPET Focus F220. (A) Cell chamber is integrated with microPET Focus F220 scanner in series with sensor probes, gas exchanger, degas vessel, and peristaltic pump. (B) Detailed schematic of cell chamber. C = carbon dioxide; DO/TMP = combined dissolved O2 and temperature probe; MFC = mass flow controllers; N = nitrogen; O = oxygen; S = septa.

  • FIGURE 2.
    • Download figure
    • Open in new tab
    • Download powerpoint
    FIGURE 2.

    Metabolic parameters during TBR study. (A) Concentration of glucose in feed, effluent (left axis), and consumption rate (right axis). (B) Concentration of FFA in feed, effluent (left axis), and production rate (right axis). (C) Concentration of lactate in feed, effluent (left axis), and production rate (right axis). Glucose, lactate, and FFA rate were calculated from piecewise function fitted curves. Refer to Table 1 for description of time stamps. Operational parameters throughout experiment: feed flow rate (Qfeed) = 0.5 mL/min, media recycle flow rate (Qrcy) = 50 mL/min, oxygen partial pressure (pO2) = 21%, pH set point = 7.3, and temperature = 37°C.
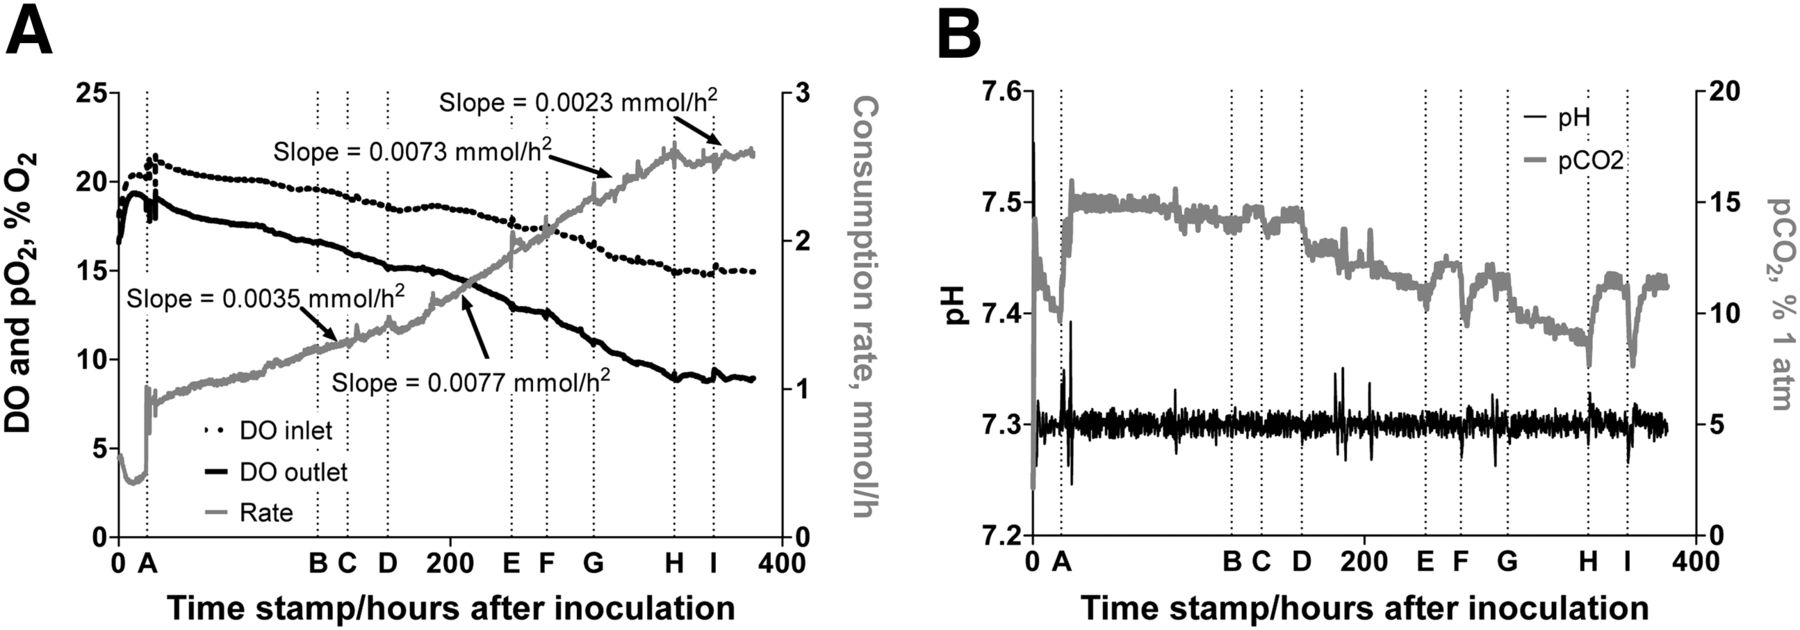
  • FIGURE 3.
    • Download figure
    • Open in new tab
    • Download powerpoint
    FIGURE 3.

    Physiologic parameters during TBR study. (A) DO and oxygen partial pressures (pO2) (left axis) and O2 consumption rate (right axis). (B) pH (left axis) and CO2 partial pressure (pCO2) needed to maintain pH (right axis). Operational parameters throughout experiment: feed flow rate (Qfeed) = 0.5 mL/min, media recycle flow rate (Qrcy) = 50 mL/min, pO2 = 21%, pH set point = 7.3, and temperature = 37°C.

  • FIGURE 4.
    • Download figure
    • Open in new tab
    • Download powerpoint
    FIGURE 4.

    (A) AUCs for 3 glucose uptake tests. Glucose concentration before bolus injection was used as baseline for integration. AUC represents integral between time of glucose injection, which is defined as baseline, to time when concentration returns to baseline in Figure 2. (B) Intercellular FFA and TG content of cell samples taken from chamber. Open symbols were sampled from upper septum; closed symbols were sampled from lower septum. Averages and SD represent data from multiple sampling of chamber at given location in time. Glu = glucose; PGZ = pioglitazone.

  • FIGURE 5.
    • Download figure
    • Open in new tab
    • Download powerpoint
    FIGURE 5.

    Coronal and sagittal views of TBR highlighting heterogeneity within chamber. Arrows indicate direction of flow from top of chamber to bottom. Max = maximum.

  • FIGURE 6.
    • Download figure
    • Open in new tab
    • Download powerpoint
    FIGURE 6.

    Representation of input function curve (A) in absence of cells in chamber (solid line) depicting transient kinetics and in presence of HepG2 cells with sampled obtained manually from inlet to chamber (•), effluent (■), and image (◆). (B) Kinetics of 2 regions of interest depicting heterogeneity of 11C-palmitate uptake in TBR chamber as shown in Figure 5. SUV = standardized uptake value.

  • FIGURE 7.
    • Download figure
    • Open in new tab
    • Download powerpoint
    FIGURE 7.

    Serum and TBR chamber 11C-palmitate kinetics in presence and absence of lipids. (A) Normalized standardized uptake value kinetics of 11C-palmitate in medium in presence and absence of lipids. (B) Region of interest drawn in TBR chamber depicting total uptake of 11C-palmitate in presence and absence of lipids. SUV = standardized uptake value.

Tables

  • Figures
  • Additional Files
    • View popup
    TABLE 1

    Event Time Stamps in TBR Experiments

    Time stampTime (h)Event
    A17.2Started medium feed, glucose = 5.55 mM
    B119.9Glucose = 1.39 mM
    C137.9Glucose uptake test 1, 0.75 mL bolus of 283 mg/mL
    D162.1Glucose = 5.55 mM, lipid = 100 μM
    E236.8Glucose = 1.39 mM, lipid = 100 μM
    F258.1Glucose uptake test 2, 0.75 mL bolus of 283 mg/mL
    G286.3Glucose = 5.55 mM, lipid = 100 μM, pioglitazone = 1 μg/mL
    H334.9Glucose = 1.39 mM, lipid = 100 μM, pioglitazone = 1 μg/mL
    I358.5Glucose uptake test 3, 0.75 mL bolus of 283 mg/mL
    382.0Glucose = 5.55 mM, pioglitazone = 0
    520.0First imaging*
    643.0Second imaging*
    • ↵* Feed flow rate (Qfeed) = 5 mL/min during imaging sessions.

    • Operational parameters throughout experiment: Qfeed = 0.5 mL/min, media recycle flow rate (Qrcy) = 50 mL/min, pO2 = 21%, pH set point = 7.3, temperature = 37°C.

    • View popup
    TABLE 2

    11C-Palmitate Metabolism in TBR Medium

    GroupTracer testedAnalysisPercentage extracted
    111C-palmitateControl100.00 ± 1.49
    211C-palmitateTest93.07 ± 5.84
    311C-CO2Control100.00 ± 0.94
    411C-CO2Test0.0031 ± 0.003*
    • ↵* Significantly lower than control.

Additional Files

  • Figures
  • Tables
  • Supplemental Data

    Files in this Data Supplement:

    • Supplemental Data
PreviousNext
Back to top

In this issue

Journal of Nuclear Medicine: 54 (10)
Journal of Nuclear Medicine
Vol. 54, Issue 10
October 1, 2013
  • Table of Contents
  • Table of Contents (PDF)
  • About the Cover
  • Index by author
Print
Download PDF
Article Alerts
Sign In to Email Alerts with your Email Address
Email Article

Thank you for your interest in spreading the word on Journal of Nuclear Medicine.

NOTE: We only request your email address so that the person you are recommending the page to knows that you wanted them to see it, and that it is not junk mail. We do not capture any email address.

Enter multiple addresses on separate lines or separate them with commas.
A PET-Compatible Tissue Bioreactor for Research, Discovery, and Validation of Imaging Biomarkers and Radiopharmaceuticals: System Design and Proof-of-Concept Studies
(Your Name) has sent you a message from Journal of Nuclear Medicine
(Your Name) thought you would like to see the Journal of Nuclear Medicine web site.
Citation Tools
A PET-Compatible Tissue Bioreactor for Research, Discovery, and Validation of Imaging Biomarkers and Radiopharmaceuticals: System Design and Proof-of-Concept Studies
Timothy D. Whitehead, Samuel T. Nemanich, Carmen Dence, Kooresh I. Shoghi
Journal of Nuclear Medicine Oct 2013, 54 (10) 1812-1819; DOI: 10.2967/jnumed.113.119776

Citation Manager Formats

  • BibTeX
  • Bookends
  • EasyBib
  • EndNote (tagged)
  • EndNote 8 (xml)
  • Medlars
  • Mendeley
  • Papers
  • RefWorks Tagged
  • Ref Manager
  • RIS
  • Zotero
Share
A PET-Compatible Tissue Bioreactor for Research, Discovery, and Validation of Imaging Biomarkers and Radiopharmaceuticals: System Design and Proof-of-Concept Studies
Timothy D. Whitehead, Samuel T. Nemanich, Carmen Dence, Kooresh I. Shoghi
Journal of Nuclear Medicine Oct 2013, 54 (10) 1812-1819; DOI: 10.2967/jnumed.113.119776
Twitter logo Facebook logo LinkedIn logo Mendeley logo
  • Tweet Widget
  • Facebook Like
  • Google Plus One
Bookmark this article

Jump to section

  • Article
    • Abstract
    • MATERIALS AND METHODS
    • RESULTS
    • DISCUSSION
    • CONCLUSION
    • DISCLOSURE
    • Acknowledgments
    • Footnotes
    • REFERENCES
  • Figures & Data
  • Supplemental
  • Info & Metrics
  • PDF

Related Articles

  • This Month in JNM
  • PubMed
  • Google Scholar

Cited By...

  • Bioanalytic Hybrid System Merging 3-Dimensional Cell Culture and Chromatographic Precision for Unprecedented Preclinical Insights in Molecular Imaging
  • Google Scholar

More in this TOC Section

  • Design and Fabrication of Kidney Phantoms for Internal Radiation Dosimetry Using 3D Printing Technology
  • Synthesis and Biologic Evaluation of Novel 18F-Labeled Probes Targeting Prostate-Specific Membrane Antigen for PET of Prostate Cancer
  • Tumor-Specific Binding of Radiolabeled PEGylated GIRLRG Peptide: A Novel Agent for Targeting Cancers
Show more Basic Science Investigations

Similar Articles

Keywords

  • bioreactor
  • biomarker discovery
  • imaging
  • tissue engineering
  • positron emission tomography (PET)
SNMMI

© 2025 SNMMI

Powered by HighWire