


Abstract
Several tracers have been evaluated as probes for noninvasive epidermal growth factor receptor (EGFR) quantification with PET. One of the most promising candidates is the 11C-labeled analog of the EGFR tyrosine kinase inhibitor PD153035. However, previous in vitro studies indicated extensive metabolism of the tracer, which could be disadvantageous for the assessment of receptor density in vivo. The aim of this study was to investigate the in vivo metabolism of [11C]PD153035 to determine whether alterations in metabolite formation are accompanied by changes in biodistribution and tumor uptake. Methods: EGFR-overexpressing human epidermoid carcinoma xenografts in rats were used in all examinations of tumor uptake. Cytochrome P450 enzymes of subfamilies CYP2D and CYP3A were inhibited before intravenous injection of [11C]PD153035 into healthy and tumor-bearing male rats. Samples were taken from arterial blood and urine, and the occurrence of radioactive metabolites was assessed with radio–high-performance liquid chromatography. Dynamic PET examinations of healthy and tumor-bearing animals were performed. In 1 rat, the effect of local intraarterial administration was examined. Results: [11C]PD153035 labeled at position 6 was metabolized extensively in vivo in male rats, resulting in very low levels of the intact tracer in plasma only minutes after injection. The major identified radiolabeled metabolites found were the N-oxide and metabolites arising from O demethylation at position 7. They were reduced by inhibition of CYP2D and CYP3A enzymes. PET revealed enzyme activity–dependent changes in the radioactivity distribution in the liver and tumors. Local administration of [11C]PD153035 greatly increased radioactivity levels in the adjacent tumor compared with levels typically found after intravenous administration. The highest tumor-to-muscle ratio at 60 min after intravenous injection was found in the untreated animals, whereas the overall highest ratio was found in the tumor near the intraarterial administration site. Conclusion: We suggest that the metabolism of [11C]PD153035 should be taken into consideration when this tracer is used to quantify EGFR expression, as our results indicated that the distribution of radioactivity to EGFR-overexpressing tumors was affected by the rate of metabolism and the route of administration.
The epidermal growth factor receptor (EGFR) belongs to the ErbB family of receptor tyrosine kinases. Overexpression of EGFR and its cognate ligands has been shown to contribute to increased proliferation and invasiveness of several tumor types (1). The intracellular portion of the EGFR consists of a tyrosine kinase domain that is activated by ligand binding and receptor dimerization and is a potential therapeutic target for the group of drugs known as tyrosine kinase inhibitors (TKIs). These drugs act by inhibiting the adenosine triphosphate–binding site of tyrosine kinase and thereby blocking subsequent diverse intracellular downstream signaling events (reviewed by Fry (2)).
Elevated levels of the EGFR in numerous cancer types (3) suggest a possible benefit from and need for methods for the noninvasive quantification of receptor density. Expression levels may be estimated by noninvasive PET imaging with an EGFR-specific imaging radiotracer. On the basis of radioactivity uptake levels, patients could be more reliably selected for EGFR-directed therapy. In addition, a successful imaging tracer could be a valuable tool in preclinical research for the design and evaluation of novel therapeutics for the treatment of EGFR-dependent cancer.
Imaging studies of EGFR expression have been performed with several tracers, with varying results, but so far none has reached acceptance in clinical use (4–6). PD153035 is a reversibly binding TKI with a high affinity for the intracellular tyrosine kinase domain of the EGFR (inhibition constant, ≈5.2 pM; 50% inhibitory concentration, ≈29 pM) (7,8). These characteristics make the molecule an attractive candidate as a PET tracer, and [11C]PD153035 has been evaluated in several in vitro and in vivo studies. Promising in vivo results were observed in rodents (9–11). The tracer, labeled at position 6, was evaluated for radiation dosimetry (12) and for imaging of non–small cell lung cancer in humans; the uptake of radioactivity was positively correlated with an increased effectiveness of EGFR-directed therapy (13). However, our previous in vitro study indicated that the radiotracer was rapidly metabolized by both rat and human liver microsomes (14). The main metabolite found in all assays was the N-oxide, whereas metabolites formed by O-demethylation of the methoxy group at position 7 were mediated only by human liver microsomes. We concluded that if these in vitro results were predictive of [11C]PD153035 metabolism occurring in vivo, then the estimation of EGFR density based on radioactive uptake could be problematic and the choice of labeling position would be important.
Therefore, we investigated the in vivo metabolism of [11C]PD153035 in rats to estimate the importance and involvement of distinct metabolic pathways related to radiotracer in vivo behavior. These goals were accomplished by treating animals with selective enzyme inhibitors before injecting [11C]PD153035 and subsequently analyzing the radioactive metabolites in blood and urine together with data from dynamic PET imaging. Previous reports on the metabolism of quinazoline-based TKIs and other structurally similar compounds (15–17) indicated that O-demethylation and N-oxide formation could be mediated by the cytochrome P450 enzyme subfamilies CYP3A and CYP2D. Ketoconazole and quinidine, well-known inhibitors of CYP3A and CYP2D, respectively (18,19), were therefore chosen for the inhibition experiments in the present study. In our previous in vitro study, we found that position 7 was more prone to be demethylated, resulting in very polar metabolites (14). In the present study, we chose to use [11C]PD153035 labeled at position 6 because more lipophilic metabolites would be easier to detect and quantify in the plasma metabolite assays.
To examine the impact of metabolism on tumor uptake, rats bearing EGFR-overexpressing human epidermoid carcinoma xenografts from the A431 cell line (20) were scanned before and after the administration of enzyme inhibitors. In a final experiment, we investigated how the circumvention of initial metabolism by a more direct delivery of the tracer would affect the uptake of radioactivity in the tumor. The use of intraarterial microcatheterization made selective administration upstream from the tumor and avoidance of initial metabolism in major metabolic organs possible.
MATERIALS AND METHODS
Radiosynthesis and Purification of Tracer
Solvents and chemicals used for synthesis and purification were commercially available and of analytic grade. PD153035 used as a reference and the 6-O-desmethyl precursor were synthesized as described elsewhere (21,22). [6-Methoxy-11C]PD153035 was synthesized and purified with an automated synthesis module (Tracerlab FX C Pro; GE Healthcare AB). The 6-O-desmethyl precursor (1 mg) and K2CO3 (10 mg) in N,N-dimethylformamide (0.4 mL) were mixed and subsequently filtered (polyvinylidene difluoride; 4 mm; National Scientific Co.) into a reaction vial in the synthesis module. Cyclotron (PETtrace; GE Healthcare AB)–produced methane was converted to methyl iodide (11C-CH3I) (23), which was trapped in the reaction solution and reacted with the O-desmethyl precursor (5 min, 95°C). The product was isolated by semipreparative radio–high-performance liquid chromatography (HPLC) with a μ-Bondapak C18 column (Waters) (300 × 7.8 mm; 10 μm; CH3CN-H2O-CF3COOH, 30:70:0.1 [v/v]; 5 mL/min); this step was followed by solid-phase extraction on a Sep-Pak C18 Plus cartridge (Waters) and elution with ethanol (99%). The product solution was diluted with saline to a maximum ethanol content of 10% (v/v).
Animals and Treatment
All experiments involving animals were conducted according to the regulations of the Karolinska Institutet and were approved by the local laboratory animal ethics committee (N241/07, N325/09, N85/11, N337/10). Male Sprague–Dawley rats (Scanbur) and immunocompromised NIH-Foxn1rnu rats (Charles River) weighed between 370 and 590 g and ranged from 15 to 28 wk old at the time of the studies. They were housed under standard conditions with food and water ad libitum.
For treatment with enzyme inhibitors, at 1 h before the injection of [11C]PD153035, quinidine sulfate dihydrate (Sigma-Aldrich) was dissolved in saline (10 mg/mL) and ketoconazole (Sigma-Aldrich) was suspended in 2% hydroxypropylcellulose (2 mg/mL) immediately before intraperitoneal injection (quinidine at 20 mg/kg and ketoconazole at 10 mg/kg). For assessing the impact of metabolism on tumor uptake, 2 animals were subjected to a first PET scan and a second PET scan 3 h later. Quinidine and ketoconazole were coadministered at 1 h before the second scan.
Animals were anesthetized (2% isoflurane; Virbac) during surgery and imaging. Isoflurane was blended with air-O2 (7:3) in an isoflurane vaporizer (E-Z systems) and delivered through a Microflex nonrebreather mask (Euthanex Corp.).
Tumor Xenograft Model
A431 cells were grown under standard conditions in Dulbecco modified Eagle medium with a high glucose level (HyClone; Thermo Scientific), 10% fetal bovine serum, penicillin (100 U/mL), and streptomycin (100 μg/mL) in an incubator (37°C; 5% CO2). The cells were detached with trypsin and resuspended in serum-free culture medium. The cells were inoculated subcutaneously into the upper part of both front legs of immunocompromised rats (0.1 mL; 5 × 10⁶ cells).
Tumors were 10–15 mm in diameter at the PET examination, 14–16 d after inoculation. After removal postmortem, the tumor tissue was fixed in 2% buffered formalin for 24 h and then kept in 70% ethanol until further analysis.
Immunohistochemistry
Formalin-fixed, paraffin-embedded tumor tissue sections (4 μm) were deparaffinized with xylene, rehydrated, incubated overnight with an EGFR antibody (1/1,000; Sigma E3138) diluted in 1% (w/v) bovine serum albumin, and visualized with a standard avidin–biotin–peroxidase complex technique (Vector Laboratories). Counterstaining was performed with Mayer hematoxylin.
Metabolite Assay
Rats were anesthetized and placed on a heating pad (37°C) on the operating table. A polyethylene 50 catheter was inserted into the femoral artery, and blood samples (∼250 μL) were collected via the catheter at 10 and 30 min after the intravenous injection of [11C]PD153035. The animals were sacrificed 60 min after injection, and the urine was collected from the bladder.
Blood and urine samples were added to plastic tubes containing heparin (50 μL; 5 IU/mL) and centrifuged at 4,000 rpm for 2 min. The supernatant was transferred to a new tube, acetonitrile (150 μL) was added, and the contents of the tube were blended for a few seconds to mix and precipitate proteins before centrifugation (4,000 rpm; 2 min). The resulting protein-free supernatant was injected into the HPLC system, and 30-s fractions were collected and analyzed in a γ counter (1480 Wizard 3ʺ; Perkin Elmer). In 1 animal, the contents of the intestines were removed postmortem, extracted with hot 70% ethanol, and filtered through Celite 545 (Sigma-Aldrich) before dilution with the mobile phase and injection into the HPLC system.
The liquid chromatography system used for the analysis of blood and urine samples consisted of a liquid chromatography pump (LC-9A; Shimadzu), a μ-Bondapak C18 column (300 × 7.8 mm; 10 μm; Waters), a mobile phase of CH3CN-H2O-CF3COOH (30:70:0.1 [v/v]; 5 mL/min), and a UV detector (Shimadzu) (λ, 249 nm).
PET
In vivo PET investigations were performed with a Focus 120 (CTI Concorde Microsystems) small-animal PET scanner. Healthy rats were anesthetized and placed on the camera bed with the abdomen (including parts of the liver and the urinary bladder) in the field of view (7.68 cm). Tumor-bearing rats were positioned so that the camera field of view covered the upper parts of the body, including the tumors on both sides. [11C]PD153035 was administered via the tail vein (500–1,000 μL), except for the one experiment in which [11C]PD153035 was injected locally (500 μL over 5 min) through an intraarterial catheter. Data were collected every second for 60 min after injection and reconstructed by use of standard 2-dimensional filtered backprojection with a ramp filter. The matrix size of the reconstructed images was 128 × 128 × 95, and the spatial resolution was 1.3 mm. Data were normalized and corrected for randoms, dead time, and radioactive decay. The amounts of [11C]PD153035 injected ranged from 19.6 to 112.0 MBq/kg, and the specific activity at injection typically was 500 GBq/μmol.
Assuming a tissue density of 1 g/mL, we divided radioactivity concentrations by the administered activity to obtain the region of interest (ROI)–derived percentage injected dose per gram of tissue (%ID/g) in the kidneys, blood, liver, and tumor tissue. Blood time–activity curves were obtained by drawing ROIs over approximately 1.5 cm of the inferior vena cava at early times (0–30 s). The total amount of excreted radioactivity was estimated from the bladder and intestines with ROIs covering all volumes containing radioactivity during the last 10 min of the PET scan. In the tumor experiments, uptake was estimated by drawing ROIs over the whole tumor. The size and spatial location of the ROIs were based on postmortem examinations of the tumor sites. Humeral soft tissue on the same side as the tumor was chosen as the reference region. Radioactivity concentrations (Bq/mL) were calculated automatically by calibration against a phantom with a known concentration of radioactivity. PET data were processed with microPET Manager (Siemens Medical Systems) and evaluated with Inveon Research Workplace software (Siemens Medical Systems).
Intraarterial Catheterization and Administration
The animal was anesthetized and restrained on the detached small-animal PET bed placed in an endovascular interventional system (Allura Xper XD20; Philips). A midline incision (5 mm) was made on the ventral side of the tail. The artery was dissected and ligated distally. Next, a 6-0 silk ligature was tied loosely around the proximal part of the exposed artery, and a microvascular clip was placed over the ventral artery. The artery was cut, and a 0.041-cm (0.016-in) hydrophilic microcatheter (Magic; Balt Extrusion) carrying a 0.018-cm (0.007-in) microwire (Hybrid; Balt Extrusion) was introduced and advanced under fluoroscopic control to a tip position in the proximal third of the left subclavian artery. Reflow of blood into the microcatheter during navigation was prevented by a constant flow of normal saline at a rate of 250–500 μL/h from a pressurized infusion system, and 100 μL of iodine contrast material was injected to confirm the catheter position. Digital subtraction angiography series confirmed the position of the microcatheter tip. Thereafter, the catheter was flushed with 300 μL of saline, the animal was placed in the PET scanner, and [11C]PD153035 was injected. After the injection was completed, the microcatheter tip was retracted to the thoracic aorta. After PET scanning, the animal was returned to the interventional system for locating anatomic landmarks by XPerCT (24).
Images from the interventional system and XPerCT were imported to OsiriX imaging software (OsiriX Foundation) and postprocessed for image fusion. Photoshop (Adobe) was used for fusion of the CT and PET images and final image processing.
RESULTS
Metabolite Assay
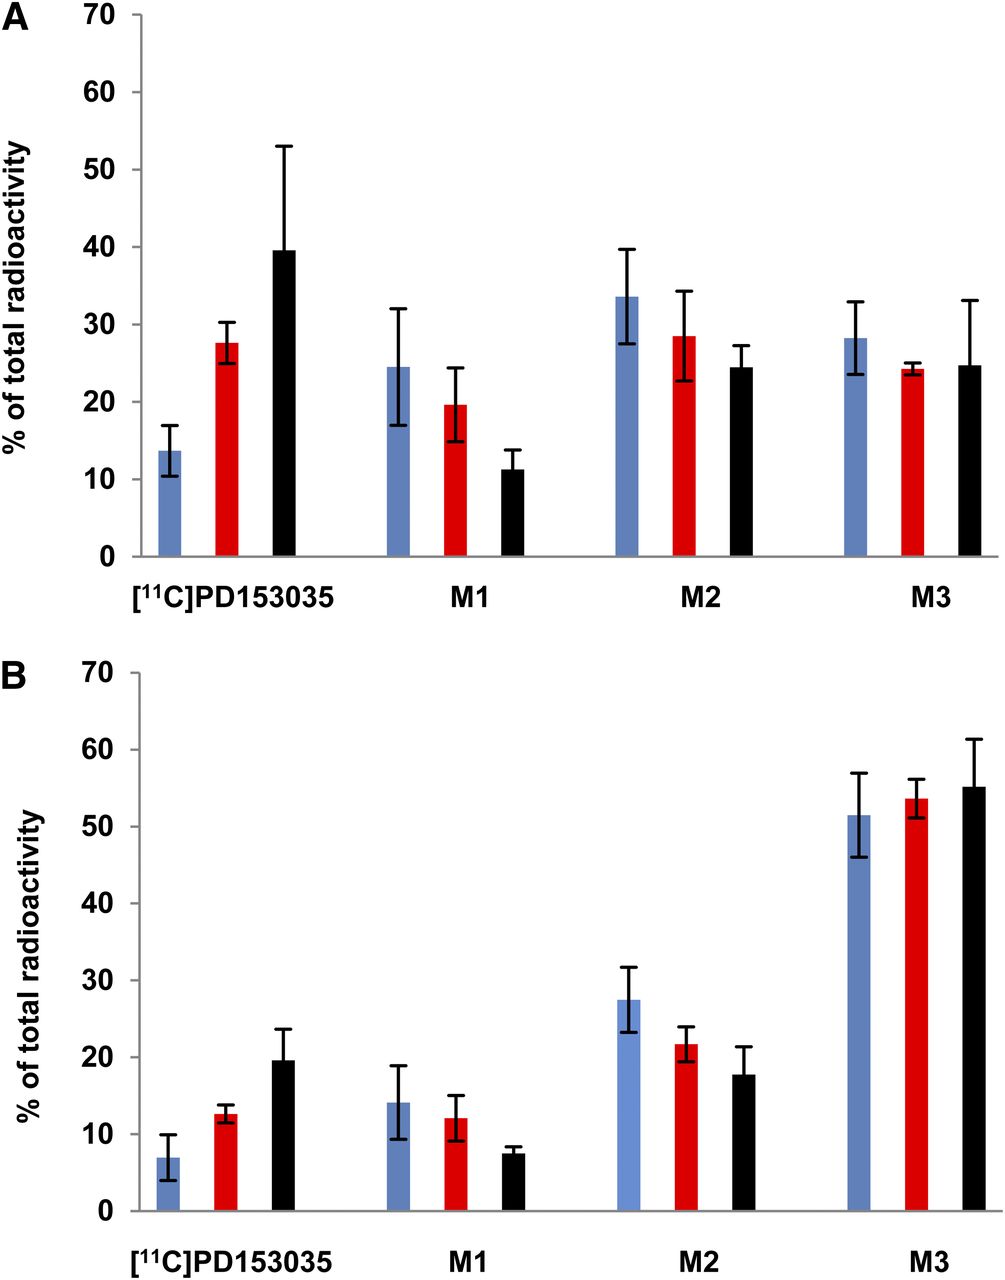
The major metabolites found—[11C]PD153035 N-oxide (M1), 7-O-desmethyl [11C]PD153035 (M2), and hydrophilic metabolites (M3) (Fig. 1)—were present at both sampling times in all animals. The M3 components were not identified because of insufficient chromatographic separation and, for simplicity, are referred to here as 1 entity. The metabolism was altered by pretreatment with inhibitors of both CYP2D and CYP3A.

[11C]PD153035 labeled at position 6 and its metabolites. M1 = [11C]PD153035 N-oxide; M2 = 7-O-desmethyl [11C]PD153035; M3 = polar radiometabolites.
In the untreated animals, the mean level of intact [11C]PD153035 in plasma, measured as a percentage of total radioactivity, decreased from 10% at 10 min to 5% at 30 min after tracer injection (Fig. 2). Both enzyme inhibitors decreased the formation of M1 and M2, increasing the relative levels of intact [11C]PD153035 in plasma. The polar M3 metabolites were the most abundant radiometabolites at 30 min after tracer injection, whereas the relative amounts of both M1 and M2 decreased from 10 to 30 min in all 3 groups. The ketoconazole-treated animals had the highest relative levels of intact tracer at both time points—3-fold higher than the levels in the control animals. The relative levels of intact tracer in the quinidine-treated animals were about twice the levels in the control animals. Only metabolites were found in the urine from all 3 groups. In the feces from a control rat, less than 3% of the radioactivity was intact [11C]PD153035.

Radioactive metabolites found in plasma as mean percentage of total radioactivity in each group (n = 3). (A) 10-min blood sample. (B) 30-min blood sample. Blue = no treatment (control); red = quinidine treatment; black = ketoconazole treatment. Error bars indicate standard deviations.
The distribution of plasma metabolites was examined in 1 tumor-bearing NIH-Foxn1rnu rat after the coadministration of both enzyme inhibitors. The levels were found to be similar to those observed after ketoconazole administration only in the healthy rats.
PET Scans of Biodistribution
The organ distributions of radioactivity were similar in the groups of treated animals and control animals, with the only appreciable differences being seen in the liver time–activity curves (Fig. 3). After the initial distribution phase, the elimination of radioactivity in the liver tended to be slower in the ketoconazole-treated animals than in animals from the other groups (Fig. 3C). Maximum concentrations were reached within 10 min and were lower in the treated animals.
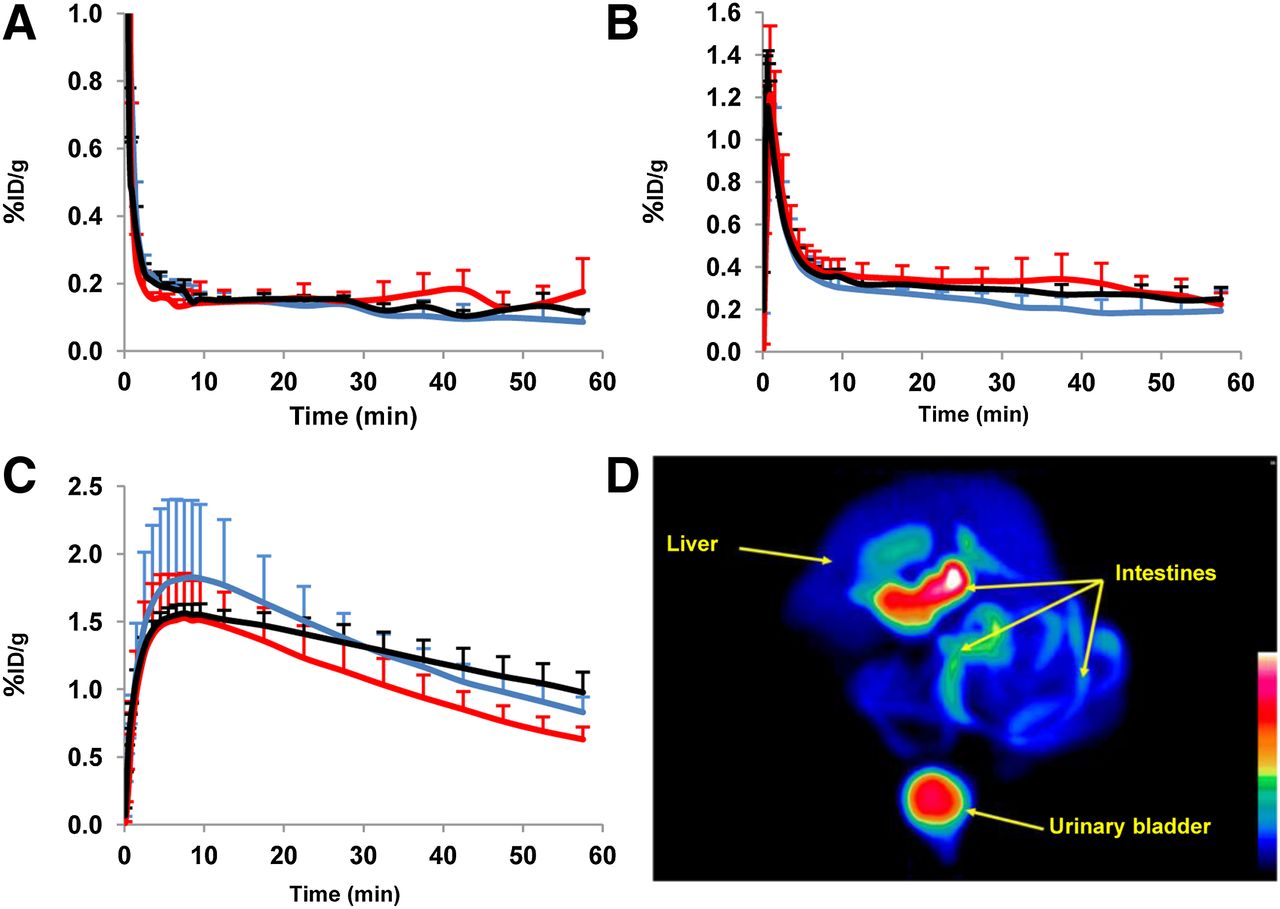
(A–C) Mean radioactivity concentrations in venous blood (A) (y-axis scale cut at 1 %ID/g), kidneys (B), and liver (C) as %ID/g plotted over time for each group (n = 3). Blue = no treatment (control); red = quinidine treatment; black = ketoconazole treatment. Error bars indicate positive standard deviations. (D) PET image of maximum-intensity projection over abdomen with acquisition data summed for 60 min in untreated animal.
Concentrations in the kidneys leveled off at 0.3–0.4 %ID/g after the first 10 min, with those in the untreated animals continuing to decrease slightly more (Fig. 3B). Venous blood levels dropped quickly, to 0.1–0.2 %ID/g, from 10 min until the end of the scan in all animals (Fig. 3A). Comparably low levels of radioactivity were observed in muscle tissue, and differences in these levels between groups could not be determined.
Radioactivity accumulated very rapidly in the bladder and intestines of all animals (Fig. 3D). On the basis of the PET data, 24%–35% of the injected radioactivity was excreted into the bladder or intestines at 60 min, with no consistent group differences being observed.
Radioactivity Uptake in Tumors
The effects of enzyme inhibition over time are shown in Figure 4 as ratios of tumor uptake in the untreated animals to that in the treated animals. Initially, the radioactivity uptake was higher in the scan performed before the administration of enzyme inhibitors than in the scan performed 1 h after treatment in the same animals. However, the elimination of radioactivity was slower after enzyme inhibition; therefore, the final tumor concentrations were higher at the end of the second PET scan. Levels of radioactivity were very low in all tumors after intravenous tracer injection, reaching maxima of 0.3 %ID/g and 0.2 %ID/g after 2–3 min in the untreated and treated animals, respectively (Fig. 5A). As shown in Figure 5B, the tumor-to-nontumor (T/NT) ratios were persistently higher throughout the scan in the untreated animals.
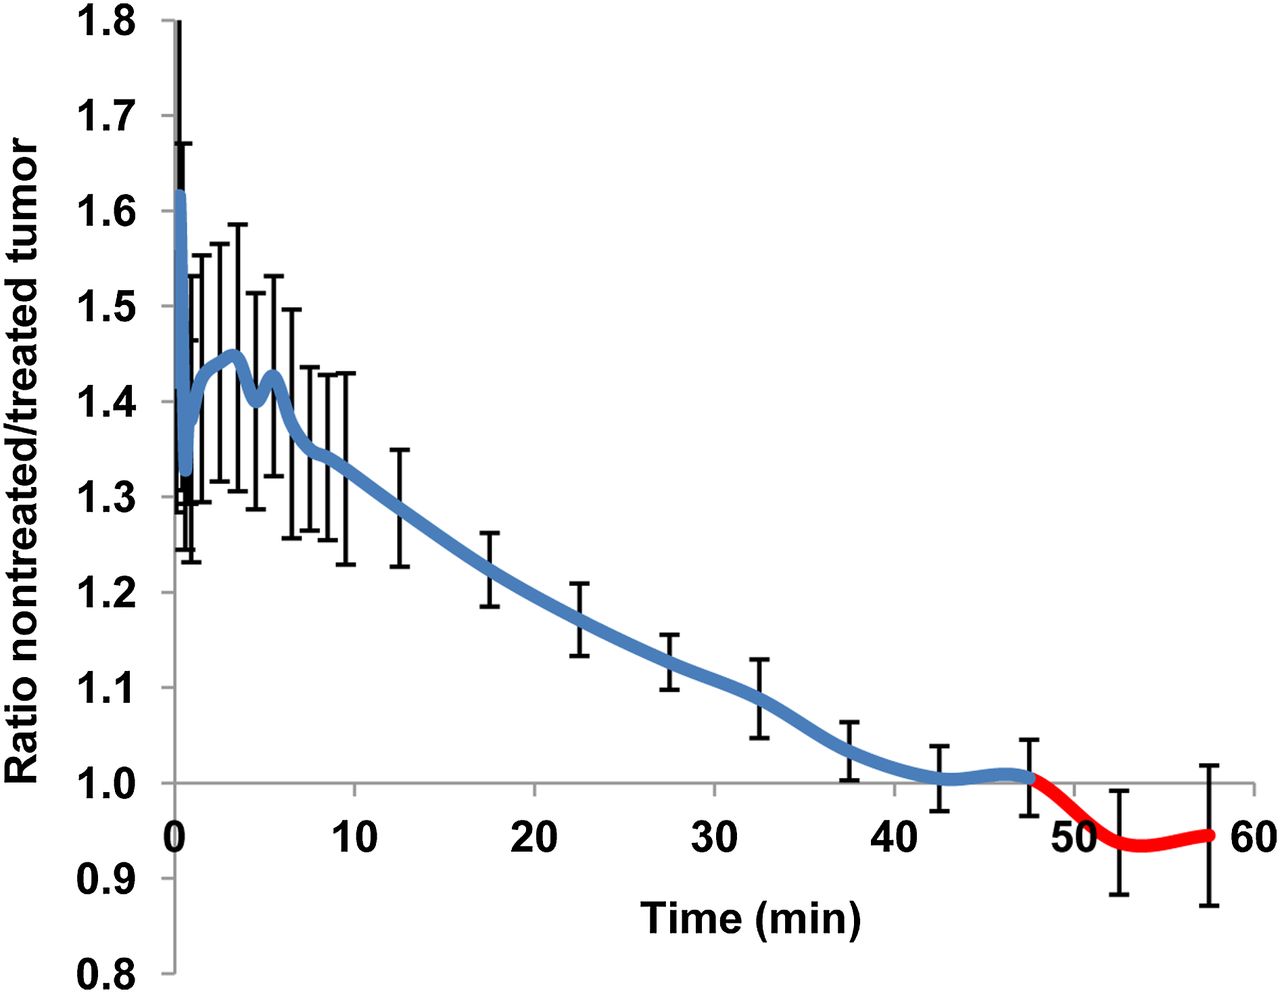
Ratios of tumor radioactivity concentrations in untreated animals to concentrations at 1 h after coadministration of enzyme inhibitors. Curve represents mean values for PET data derived from total of 4 tumors in 2 different animals, each bearing 2 tumors. Error bars indicate standard deviations.
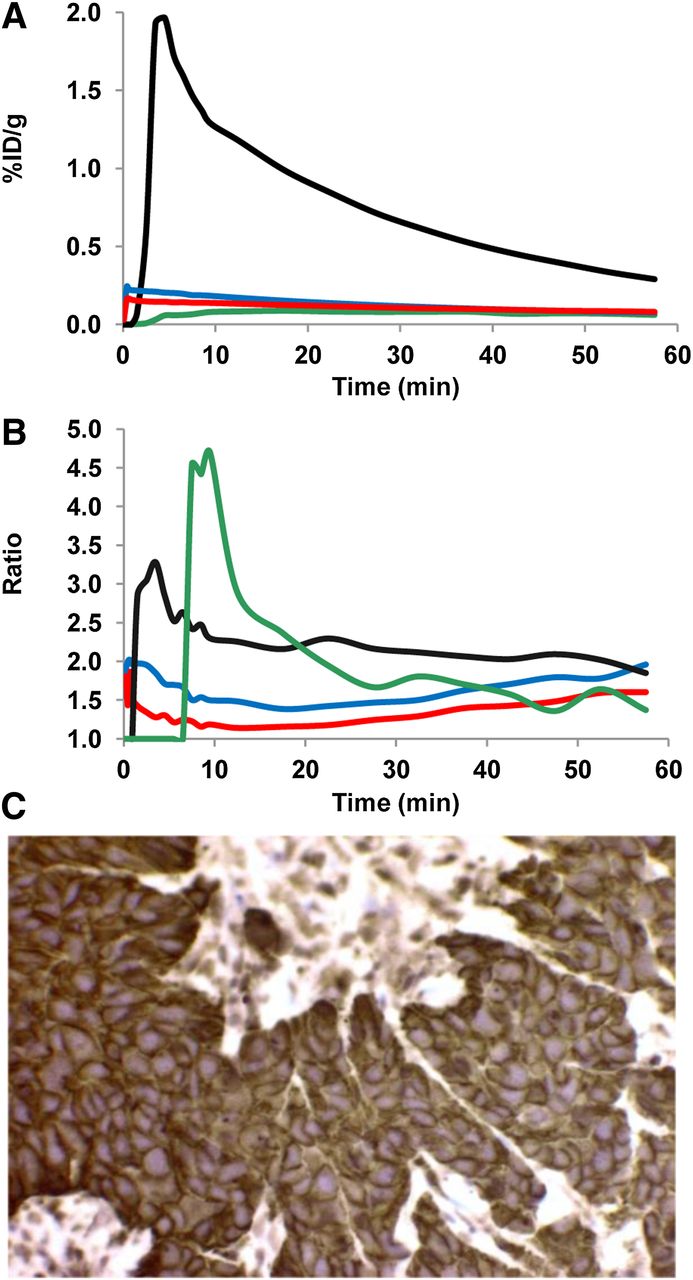
(A) Time–activity curves showing radioactivity uptake in tumors after intravenous and intraarterial administrations of [11C]PD153035. (B) T/NT ratios. Blue line = intravenous administration before treatment with enzyme inhibitors; red line = intravenous administration after treatment with enzyme inhibitors; black line = tumor located closest to site of intraarterial injection; green line = tumor on side opposite from site of intraarterial injection. Blue and red lines represent mean values (%ID/g) derived from total of 4 tumors in 2 different animals, each bearing 2 tumors. Black and green lines represent data from single animal after intraarterial administration of tracer. (C) Immunohistochemistry of A431 tumor tissue at ×40 magnification. EGFR-positive staining is brown.
Local administration of [11C]PD153035 in the proximal third of the left subclavian artery markedly increased the uptake of radioactivity in the tumor close to the injection site. Maximum initial uptake was more than 20 times higher than that in the tumor on the contralateral side and approximately 10 times higher than that in tumors in other animals after intravenous administration (Fig. 5A). Interestingly, the contralateral tumor showed the highest initial T/NT ratio. However, for the last 30 min of the scans, the ratio was highest in the tumor located on the same side as the intraarterial injection (Fig. 5B).
Immunohistochemical staining of tumor tissue excised postmortem confirmed high levels of EGFR in all tumors. A representative image is shown in Figure 5C.
The large difference in [11C]PD153035 uptake in tumors depending on their location relative to the site of intraarterial administration is shown in Figures 6A and 6B. In the angiogram acquired before tracer injection (Fig. 6C), the injection site and the new blood vessels close to the tumor are shown.

Fused PET/CT images of upper body. (A and B) Axial view (A) and coronal view (B), summed for 60 min after intraarterial injection of [11C]PD153035. (C) Frontal projection angiogram of area outlined in red in B. 1 = control tumor on right side; 2 = tumor located close to site of injection; 3 = approximate position of soft tissue used as reference region; 4 = location of catheter tip during intraarterial injection; 5 = abnormal vasculature recruited by tumor.
DISCUSSION
Analyses of plasma, urine, and fecal samples indicated that [11C]PD153035 was rapidly metabolized in vivo to at least 3 radioactive metabolites. PET scans revealed very rapid renal and hepatobiliary elimination. Treatment with ketoconazole and quinidine affected the relative amounts of the intact tracer and the major metabolites in plasma, resulting in altered uptake of radioactivity in EGFR-expressing tumor tissue and the liver. Compared with intravenous injections, intraarterial injection performed upstream of the tumor site resulted in a higher level of tumor uptake and a higher T/NT ratio.
As in our previous in vitro study (14), M1 was the most abundant metabolite at 10 min, whereas at 30 min the largest amount of radioactivity in plasma samples and in urine was from polar M3. In contrast to our previous observations in vitro, M2 was found in appreciable amounts in the plasma of the control animals in the present study (Fig. 2). The presence of M2 and the higher relative levels of M3 demonstrated that in vitro incubation with liver microsomes did not entirely predict tracer metabolism in vivo. Treatment with either ketoconazole or quinidine increased the amount of intact [11C]PD153035 in plasma and affected the formation of all metabolites. These data support our hypothesis that CYP2D and CYP3A are involved in radiotracer metabolism (Fig. 2). In addition to the large relative amounts of radiometabolites in plasma, extensive tracer metabolism was also indicated by the rapid excretion of radioactivity in the urine and the gastrointestinal tract. The amounts excreted did not vary appreciably with the compositions of radioactive substances found in plasma.
In healthy rats, some notable differences in the uptake of radioactivity in the liver between groups were observed. EGFR is expressed in the liver and plays an important role in hepatic development and regeneration (25). Therefore, EGFR-targeting tracers would be expected to and have been shown to have noticeable uptake in the liver (26,27). A tendency for more prolonged retention of radioactivity (Fig. 3C) in the livers of animals treated with ketoconazole was observed; this finding would be consistent with an increased amount of intact radiotracer binding to its target tissue. The higher maximum concentration in the untreated animals was consistent with a higher rate of metabolism, with more tracer initially binding to the metabolizing enzymes and EGFRs in the untreated animals. Some variations within groups regarding uptake of radioactivity in the liver (Fig. 3C) might be explained by age-related differences in biodistribution related to changes in enzyme activity and isoform distributions during aging, as reported in several studies (28–30).
The demethylated metabolite, M2, was relatively less lipophilic than PD153035 (logP values, ∼3.3 and ∼4, respectively) but still had a rather high affinity (inhibition constant, 25–168 pM) for the EGFR tyrosine kinase (31). Therefore, M2 in the circulation probably also could have contributed to radioactivity levels in EGFR-expressing tissues. Enzyme inhibition increased the amounts of intact radiotracer in the blood and decreased the amounts of M1 and M2. Therefore, changes in the uptake of tissue radioactivity because of different levels of intact radiotracer might have been masked to some extent by parallel changes in contributions from the radioactive metabolites. Had the tracer instead been labeled at position 7, smaller amounts of the lipophilic 6-O-demethylated radiometabolite and larger amounts of polar M3 would have been expected, on the basis of our in vitro study with liver microsomes (14). Biodistribution then might have been altered more.
In a pilot clinical study, correlations between the uptake of radioactivity and therapeutic efficacy with the EGFR TKI erlotinib were reported (13). However, the uptake of radioactivity in tumors was changed little or not at all by the erlotinib treatment. If tissue uptake were primarily due to EGFR binding, then decreased uptake due to the blocking of binding sites would be expected (10,32). Tracer metabolism was not considered in those studies, and our results indicated that radiometabolites in tissue might make it difficult to detect blocking effects. The biodistribution and excretion of [11C]PD153035 observed in the present study were similar to those reported for humans (12). These data suggest that metabolic and excretory behaviors are similar and, therefore, that our findings may have good translational potential.
The time at which EGFR density is assessed after the intravenous injection of [11C]PD153035 can be important (Fig. 4). Before clearing, hydrophilic M3 would produce high ratios initially in highly vascularized tumors, with larger blood pools than reference tissue. [11C]PD153035, M2, and possibly M1 should instead interact more with target tissue, be retained longer, and therefore contribute more at late times. A tumor in a subject with a fast metabolism could have higher radiometabolite concentrations at earlier times, whereas a tumor in a subject with a slower metabolism would have relatively higher levels at later times. Also, both CYP2D6 and CYP3A4 enzymes exhibit genetic polymorphisms in humans with ethnic differences (33). Furthermore, as shown in Figure 5A, the location of the administration site relative to the lesion and major metabolic organs is important for tracer availability to the target tissue. Therefore, the ability to detect lesions in a particular organ may not necessarily be generalizable for other organs.
Differences in T/NT ratios during scans and between groups are shown in Figure 5B. Ratios were higher in the tumor closest to the intraarterial injection site; this finding is consistent with the retention of intact [11C]PD153035 in EGFR-rich tissue. However, the highest initial T/NT ratio after intravenous injection was found in control animals, in whom relative levels of intact tracer in plasma were lowest. A high initial and delayed ratio was also found in the tumor on the side contralateral to the intraarterial administration. This finding is consistent with a delayed delivery of [11C]PD153035 from the injection site to the metabolic organs, with subsequent circulation of a mixture of radioactive species to other tissues. Therefore, [11C]PD153035 might well be used to estimate EGFR levels if the tracer can be delivered intact; however, the radiometabolites, depending on their properties, may be more reflective of the vascular properties of tumors and, to various degrees (for M2 and possibly M1), interactions with EGFRs. We therefore suggest that radiolabeled anilinoquinazoline-based TKIs (4–6) should be analyzed for predicted N-oxidation (15–17) and the behavior of possible metabolites characterized. TKIs labeled at metabolically labile side chains may produce small radiometabolites that clear rapidly, favoring analyses at late times, but this notion must be confirmed. Irreversibly binding TKIs could increase the T/NT signal at later times. However, their metabolites might still complicate in vivo quantifications. Consequently, the method of analyzing image data for [11C]PD153035 (and similar TKIs) will be important. For example, methods calculating standardized uptake values without the use of reference regions may provide different results than those including radioactive metabolites and their distribution and binding properties (34,35).
Tumors were grown on the upper part of the front legs so that the tracer in the intraarterial administration experiment could be selectively delivered via the subclavian artery. For comparative tissue kinetics, the same positions for the tumor and the reference region were used in all experiments (Figs. 6A and 6B). The angiogram (Fig. 6C) shows the location of the catheter at the time of injection and the abnormal blood vessels recruited by the growing tumor. Both the tracer and the iodine contrast medium were retained in the left thoracic wall vasculature because of blocking of the blood flow of the thoracic lateral artery by the microcatheter, thus limiting clearance of the tracer from the capillary bed. However, the arteries supplying the tumor and the extremity showed no signs of decreased perfusion because of microcatheter positioning, allowing the tumor to be clearly visualized (Figs. 6A and 6B) because of its relatively high level of uptake and good contrast against surrounding tissue (Figs. 5A and 5B). These data illustrate the importance of the route of drug delivery to target tissue, especially for tracers with a low level of metabolic stability, as in the present study. Analogously, radioactivity uptake may also vary for tumors in different locations relative to the administration site and metabolic organs. The principle of selective intraarterial administration of radiotracers upstream from a tumor may be important for several applications in nuclear medicine.
CONCLUSION
Drug delivery to target tissue, subjects’ rates of metabolism, and the timing of PET scans all were shown here to be crucial factors when [11C]PD153035 was used as an imaging biomarker for the quantification of EGFR expression in tumor tissue. The interpretation of results obtained with [11C]PD153035 could be complicated by the metabolism of the tracer if pharmacokinetics in humans are comparable to those found here in rats. Therefore, we suggest that further evaluations of in vivo tracer metabolism and methods of analysis are warranted before wider clinical applications of this tracer.
DISCLOSURE
The costs of publication of this article were defrayed in part by the payment of page charges. Therefore, and solely to indicate this fact, this article is hereby marked “advertisement” in accordance with 18 USC section 1734. This project was financially supported by The Swedish Cancer Society (Cancerfonden) (4722-B02-01XAB), The Swedish Research Council (2004-5104 and 2008-3186), the Swedish Foundation for Strategic Research (RBa08-0067), the National Association of Swedish Pharmacies, the Stockholm City Council, the Swedish Society of Medicine, and Uppdrag Besegra Stroke (supported by the Swedish Heart–Lung Foundation, Friends of Karolinska Institutet USA, and the Swedish Order of St. John). Furthermore, the study was supported by the Karolinska Experimental Research and Imaging Center and Karolinska Institutet. No other potential conflict of interest relevant to this article was reported.
Acknowledgments
We thank Staffan Eksborg and Jonas Grafström for helpful discussions about data interpretation.
Footnotes
Published online Sep. 3, 2013.
- © 2013 by the Society of Nuclear Medicine and Molecular Imaging, Inc.
REFERENCES
- Received for publication January 24, 2013.
- Accepted for publication May 7, 2013.


Jump to section
Related Articles
Cited By...
- No citing articles found.