


Abstract
Small-animal SPECT systems with stationary detectors and focusing multiple pinholes can achieve excellent resolution–sensitivity trade-offs. These systems are able to perform fast total-body scans by shifting the animal bed through the collimator using an automated xyz stage. However, so far, a large number of highly overlapping central fields of view have been used, at the cost of overhead time needed for animal repositioning and long image reconstruction times due to high numbers of projection views. Methods: To improve temporal resolution and reduce image reconstruction time for such scans, we have developed and tested spiral trajectories (STs) of the animal bed requiring fewer steps. In addition, we tested multiplane trajectories (MPTs) of the animal bed, which is the standard acquisition method of the U-SPECT-II system that is used in this study. Neither MPTs nor STs require rotation of the animal. Computer simulations and physical phantom experiments were performed for a wide range of numbers of bed positions. Furthermore, we tested STs in vivo for fast dynamic mouse scans. Results: We found that STs require less than half the number of bed positions of MPTs to achieve sufficient sampling. The reduced number of bed positions made it possible to perform a dynamic total-body bone scan and a dynamic hepatobiliary scan with time resolutions of 60 s and 15 s, respectively. Conclusion: STs open up new possibilities for high throughput and fast dynamic radio-molecular imaging.
SPECT is used to quantitatively and visually assess the distribution of radioactive biologic markers (tracers) in vivo in order to, for example, study animal models of disease and test new pharmaceuticals. Most SPECT systems use rotating detectors and collimators to scan an animal or patient. Alternatively, SPECT systems have been developed that have 360° coverage and use stationary detectors and multipinhole collimators, a full-ring stationary system being first realized at the University of Arizona (1,2). Combining stationary setups and focusing multiple pinholes with high pinhole magnification has resulted in dedicated small-animal SPECT systems that have overcome the limitation of poor spatial resolution and sensitivity. Sub–half-millimeter resolutions over the entire mouse and very detailed images of tracer uptake in tiny subcompartments of organs and tumors have been achieved (3–16). In such focusing multipinhole (FMP) SPECT systems, all pinholes focus on a central field of view (CFOV) in order to maximize the scan speed and the count yield for imaging tumors or organs.
With FMP SPECT, scans of volumes that are larger than the CFOV (such as total-body scans of mice and rats) are performed by gently moving the animal through the collimator in small steps using a high-precision xyz stage (11); this provides adequate sampling (no artifacts in the reconstructed images). Images are reconstructed with a dedicated iterative algorithm that exploits all projections acquired from all positions of the animal inside the collimator simultaneously, rather than stitching together reconstructions of separate subvolumes (obtained from individual focus positions). This method of combined acquisition and reconstruction is called the scanning focus method (11,13). It enables both total-body and focused imaging. The latter is achieved by selecting volumes of interest by means of a special graphic user interface that uses radiographs or optical images of the animal.
FMP SPECT systems that have stationary collimators and detectors are well suited to performing fast dynamic studies, because there are no heavy parts that need to be rotated during scanning. For fast scanning of volumes much larger than the CFOV, the minimum possible time resolution crucially depends on the number of bed positions; a significant fraction of acquisition time can be lost in bed movements when scan times are short (scan time lost in a bed translation is ∼0.7 s). However, up to now, acquisition protocols have been relying on a conservatively high number of bed positions to ensure proper sampling (e.g., 100–150 for total-body mouse scans), making these protocols suboptimal for fast dynamic large-volume SPECT acquisitions. These protocols use a number of bed positions in the same transaxial plane, whereafter the bed is shifted along the longitudinal axis until the object is scanned along its entire length. These bed trajectories are denoted hereafter as multiplane trajectories (MPTs). MPTs combined with a conservatively high number of bed positions as used until now guarantee sufficient sampling of the object, because every part of the selected scan volume is positioned at least once inside the CFOV. However, the entire field of view (FOV) of the collimator, at a single bed position, is much larger than the CFOV; it extends over the entire tube diameter as illustrated in Figure 1A. Photons from activity outside the CFOV can therefore still be detected by a significant portion of the pinholes. Because the image reconstruction algorithm uses the projection views of all bed positions simultaneously to reconstruct the entire volume, even activity that is never positioned within the CFOV may still be sufficiently sampled. Therefore, investigating trajectories other than those providing overlapping CFOVs can be useful.

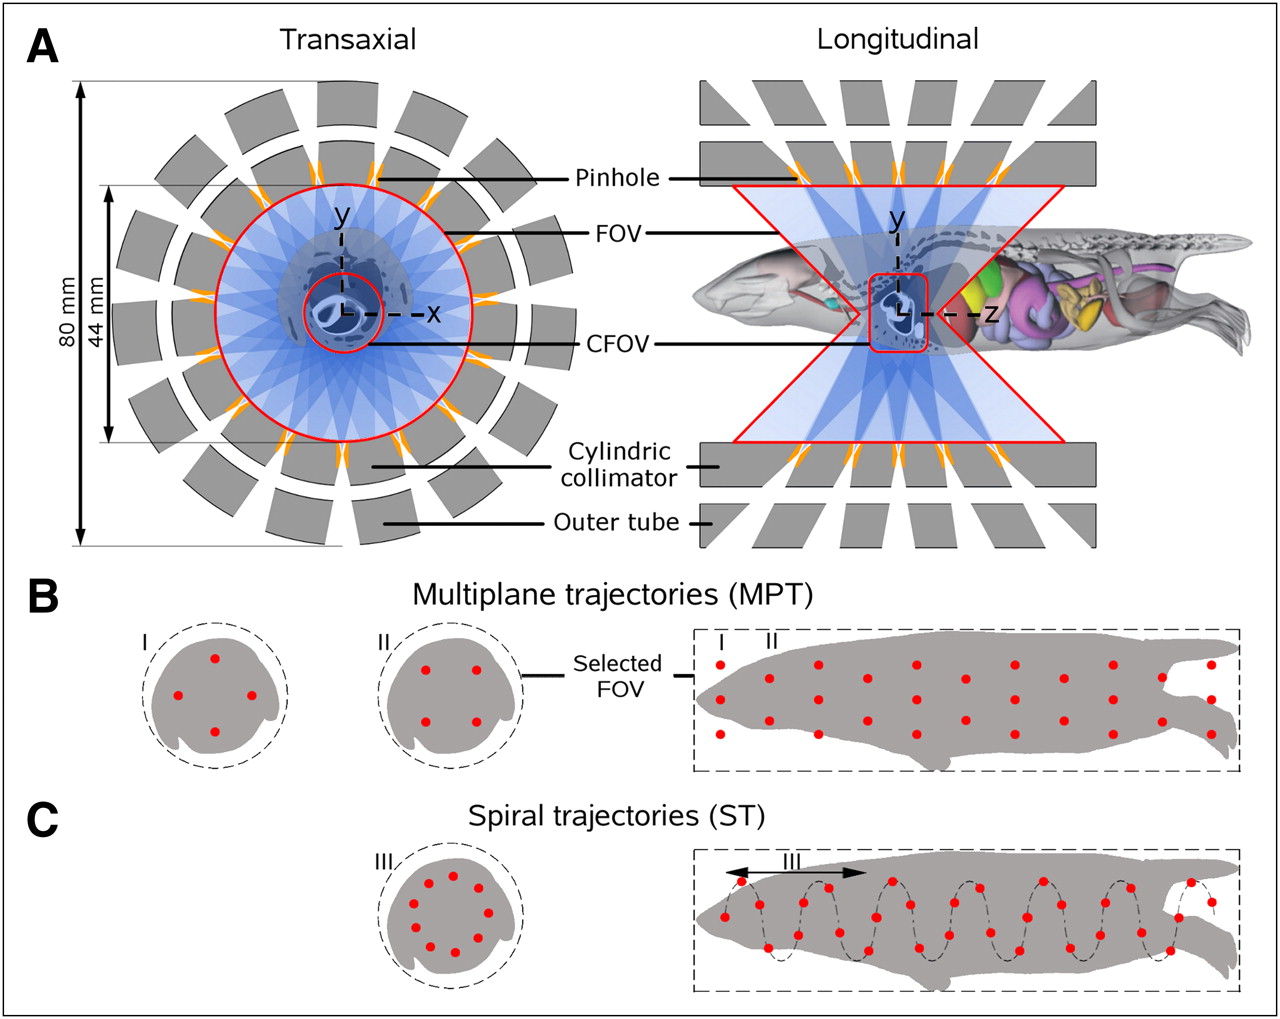
(A) Illustration of mouse in collimator with focusing pinholes. (B) MPT with 4 transaxial CFOV positions (red dots) per longitudinal position. Orientation of CFOV positions is rotated by 45° in successive planes. (C) ST with 4.5 CFOV positions per spiral pitch length (after 9 bed steps, or 2 pitch lengths, bed returns to same transaxial position). For both MPT and ST, mouse bed is only shifted (not rotated) to position the mouse in CFOV.
The aim of this study was to show the potential of spiral trajectories (STs) for reducing the required number of bed positions and to demonstrate that STs can be used for ultrafast dynamic mouse SPECT.
MATERIALS AND METHODS
This section starts with an introduction to the scanner and collimator geometry of the U-SPECT-II system (MILabs) used in this study and a description of the different types of bed trajectories that were tested. Subsequently, digital phantom simulations and physical phantom experiments are described and experimental details of in vivo dynamic animal studies are provided. Finally, the image reconstruction algorithm is described.
FMP SPECT Scanner
The collimator geometry of a U-SPECT-II focusing general-purpose mouse collimator is shown in Figure 1A. The system has 3 large-FOV γ-cameras placed in a triangular configuration with a FMP collimator positioned at the center of the scanner. In the present study, a collimator tube for mouse-sized animals was used (11) both for simulations and for experiments. The 75 pinholes in this collimator are arranged in 5 rings of 15 pinholes. Each pinhole has a diameter of 0.6 mm and an opening angle of 30°. All pinholes together observe a FOV that extends over the entire collimator tube diameter (44 mm), and the FOV has the shape of an hourglass (Fig. 1A). The average longitudinal length of the collimator FOV is 25 mm. A portion of the FOV referred to as the CFOV is sampled by all pinholes simultaneously. Within the CFOV, complete data acquisition is obtained without any translation of the bed. For the mouse collimator used here, the CFOV has a diameter of approximately 12 mm and a longitudinal length of approximately 8 mm. Equipped with this collimator the system achieves a spatial image resolution of 0.45 mm, and 0.35 mm can be achieved when the same collimator has 0.3-mm-diameter pinholes (17).
Bed Trajectories
In this study, images obtained with MPTs and STs were compared. Neither MPTs nor STs require rotation of the animal. The position of the bed is defined as the position of the center of the selected scan volume in the coordinate system of the collimator. This coordinate system has its origin at the center of the CFOV, and the x-axis and y-axis lie perpendicular to the collimator’s longitudinal axis, which is the z-axis (Fig. 1A). Both MPTs and STs are step-and-shoot acquisition techniques, in which the coordinates of successive bed positions lie either in multiple planes perpendicular to the collimator’s longitudinal axis (MPTs) or on a spiral curve (STs). To maximize scan speed, if the bed is repositioned it does not follow a curve but rather the shortest path between successive bed positions. Both types of bed trajectories were tested for a decreasing number of bed positions to see when artifacts might appear in the reconstructed images. The MPTs consist of longitudinally repeating scan planes, with each scan plane having 4 transaxial bed positions (no longitudinal movement of the bed within a scan plane). The orientations of the bed positions of successive scan planes were transaxially rotated by 45°; in this way, bed positions of successive scan planes minimally overlap especially when the longitudinal distance between subsequent scan planes was small (Fig. 1B). Thus, angular sampling of the scanned volume was improved over the use of successive scan planes that have the same transaxial position pattern. To test acquisitions with different numbers of bed positions, the longitudinal distances between subsequent scan planes were changed. For scanning a cylindric volume (radius R and length L) with
Here, Rf is the transaxial radius of the CFOV and δ is the longitudinal length of the CFOV. These equations are valid for
If MPTs are used with fewer bed positions, the longitudinal distances between the scan planes increase. Although regions close to the scan planes will still be sampled sufficiently, there is insufficient sampling between planes with increasing interplanar distances. If the bed follows an ST, each bed position has a different longitudinal coordinate resulting in more uniform sampling of the object in the longitudinal direction than is achievable with MPTs. Therefore, our hypothesis is that STs achieve sufficient sampling for fewer bed positions.
For the STs investigated here, the spiral pitch length was varied in order to vary the number of bed positions. STs had 4.5 bed positions per spiral pitch, and the bed returned to its initial transaxial position after 9 bed steps (2 times the spiral pitch, Fig. 1C). In this way, angular sampling of the scanned volume was improved over repetition of the same transaxial position pattern with 4 bed positions for each spiral pitch, especially when the longitudinal step between successive bed positions was small. For STs with N > 1 bed positions, the coordinates of bed position n in a scan of the above-mentioned volume are
Phantom Scans
To test the performance of MPTs and STs for different numbers of bed positions, scans of phantoms that are challenging for limited sampling were simulated and experimentally performed.
Digital Image-Quality Phantom Scan Simulations
The digital phantom (Fig. 2A) has a cylindric shape with a diameter of 24 mm and a length of 90 mm (approximately the size of a mouse). This phantom addresses image uniformity and data completeness and consists of a uniform section and 2 Defrise disk phantom inserts with disk sets perpendicular and parallel to the long axis of the phantom (thickness of the disks and spacing between disks are both 1.5 mm). The Defrise phantom is often used for studying the effects of incomplete data in various cone-beam–like geometries (e.g., pinhole SPECT and multislice CT). To mimic a realistic continuous activity distribution, the voxel size of the phantom was 0.15 mm, half the size of voxels in the reconstructed image. To investigate possible bias effects on reconstructed images introduced by the sampling quality of the bed trajectories, high count projections were required. Therefore, activity concentrations of 51 MBq/mL and a scan time of 30 min were assumed in the simulations (18).

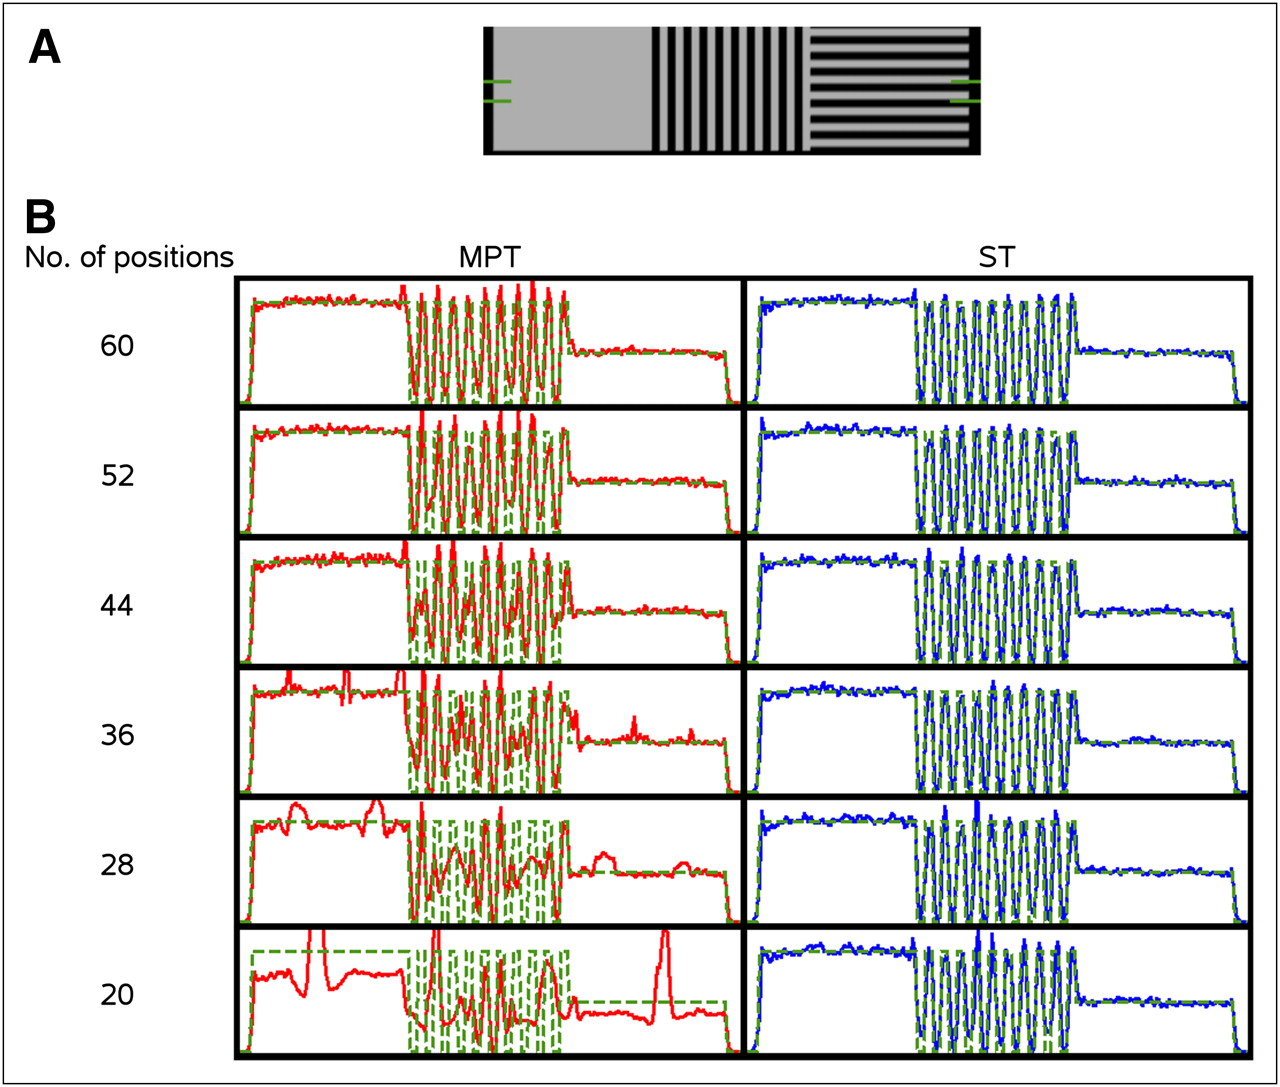
(A) Digital image-quality phantom with longitudinal profile region between green lines. (B) Image profiles through center of reconstructed phantom images for simulated scans with MPTs (left column) and STs (right column) relative to original digital image-quality phantom (dashed green line) for decreasing number of bed positions.
The fast simulator used in this study is based on ray tracing to account for resolution-degrading effects of pinhole diameter and pinhole edge penetration (19,20). The radionuclide that was simulated was 99mTc (140-keV γ-photons). The intrinsic resolution of the detectors and detection efficiency for 140-keV γ-photons was set in correspondence with experimental data to a gaussian response with a full width at half maximum of 3.5 mm and 89%, respectively. The simulator was used to simulate phantom projection data and to precalculate the system matrix by simulating point sources. To emulate noise, Poisson statistics were generated for the simulated projection data, taking into account administered activity and scan duration.
The accuracy of the reconstructed phantom images was visually evaluated by image profiles through longitudinal phantom slices and expressed in terms of the normalized mean error (NME) and normalized mean square error (NMSE) between a volume of interest (VOI) in the reconstructed images and the corresponding region in the digital phantom. The VOI was a cylindric region with diameter and length of 18 mm and 87 mm, respectively, and was centered and aligned with the digital phantom. To calculate both errors, the digital phantom was resampled to the voxel size of the reconstructed images.
Let λ be the summed activity over all M voxels inside the VOI of the digital phantom:
Similarly, the summed activity ∼λ over all M voxels of the corresponding VOI in the reconstructed image can be calculated. With the above definitions, the NME between the digital phantom and reconstructed image can be written as
The NMSE is expressed by
Physical Defrise Phantom Scans
Experimental phantom scans were performed using a Defrise phantom consisting of a set of parallel polymethylmethacrylate disks (Data Spectrum Corp.). The 20-mm-diameter disks were 1.5 mm thick, and the spacing between them equaled their thickness (equivalent to the image-quality phantom used in the scan simulations). The length of the phantom was 25.5 mm. Spaces between the disks were filled with 384 MBq of 99mTc-pertechnetate, and the phantom was scanned for 30 min. Because the longitudinal length of the physical Defrise phantom was 3.5 times less than the length of the digital image-quality phantom described above, the scans acquired using N bed positions can be compared with the scan simulations of the digital image-quality phantom acquired using 3.5 × N bed positions.
Animal Studies
The dynamic capabilities that come into reach with the development of STs were illustrated by a dynamic total-body mouse bone scan and a dynamic hepatobiliary scan of the mouse’s thorax and abdomen. All scans were obtained using STs that performed best in the phantom scans (smallest number of bed positions and still adequate sampling). Animal studies were conducted following protocols approved by the Animal Research Committee of the University Medical Center Utrecht. During all procedures, the animals’ body temperature was kept at approximately 37°C by a thin heating mat that was integrated into the bed.
Dynamic Bone Scan
A dynamic total-body bone scan of a mouse was performed using 99mTc-hydroxymethylene diphosphonate. A 29.5-g male mouse was anesthetized with isoflurane. 99mTc-hydroxymethylene diphosphonate (189 MBq) was injected in the tail vein. Scanning started immediately before radioligand injection, and the mouse was scanned for 60 min in time frames of 1 min.
From the reconstructed images, VOIs were selected covering the heart, kidneys, left shoulder, left knee, and bladder. For each organ or structure, the VOI outline was drawn in the reconstructed image in which the organ or structure was most clearly visible. From these VOIs, time–activity curves were derived by measuring the average activity concentration in each VOI in each time frame.
Dynamic Hepatobiliary Scan
A dynamic hepatobiliary scan of the mouse’s thorax and abdomen was performed. 99mTc-mebrofenin is indicated as an imaging agent for evaluation of the hepatobiliary tract. 99mTc-mebrofenin was injected into the bloodstream, from which it circulated to the liver and was excreted into the bowel. The scan area stretched from the pelvis to the neck. A 25-g male mouse was anesthetized with isoflurane, and 145 MBq of 99mTc-mebrofenin (Bridatec; GE–Amersham Health) was injected via the tail vein. Scanning started immediately before radioligand injection, and the mouse was scanned for 5 min in time frames of 15 s. From the reconstructed images, VOIs were selected covering the inferior vena cava, the heart, the liver, the gallbladder, and the duodenum. Each VOI outline was drawn in the reconstructed image in which the organ was most clearly visible. Time–activity curves were derived by measuring the average activity concentration in each VOI in each time frame.
Image Reconstruction
The images of the digital image-quality phantom scan simulations and physical Defrise phantom scans were reconstructed using pixel-based ordered-subset expectation maximization with 16 subsets and 10 iterations. This algorithm deviates from traditional ordered-subset expectation maximization in that subsets do not consist of grouped projection views but rather the pixels in each subset are spread out in a regular pattern over the entire detector. At high acceleration factors (high numbers of subsets), images reconstructed with the pixel-based algorithm are closer to equivalent images reconstructed with maximum-likelihood expectation maximization than to images reconstructed with ordered-subset expectation maximization with traditional selection of subsets (18). The images of the digital image-quality phantom scan simulations were reconstructed on a 0.3-mm-voxel grid and were postfiltered with a gaussian filter with full width at half maximum of 0.4 mm. For the physical Defrise phantom scans, a window with a width of 25% was set around the 99mTc photopeak. Images were reconstructed on a 0.2-mm-voxel grid and were also postfiltered with a gaussian filter with a full width at half maximum of 0.4 mm.
For the dynamic bone scan, 60 images (from 60 × 1-min time frames) were reconstructed. For the dynamic hepatobiliary scan, 20 images (from 20 × 15-s time frames) were reconstructed. For both animal studies, a window with a width of 25% was set around the 99mTc photopeak. Because of the low-count projection data resulting from the short scan times per frame, only a low number of iterations were needed and the images were therefore reconstructed using maximum-likelihood expectation maximization with 10 iterations. The voxel size of the reconstructed images was 0.4 mm. The reconstructed images were postfiltered using an edge- and flux-preserving Perona–Malik nonlinear diffusion filter (gradient modulus threshold = 10; integration constant = 3/44; 2 iterations) (21,22).
RESULTS
Phantom Scans
Digital Image-Quality Phantom Scan Simulations
Figure 2B shows longitudinal image profiles through the transaxial center of the reconstructed phantom images together with the digital phantom profile (ground truth). Both the slice thickness and the profile width were 3 mm. These image profiles show that as the number of bed positions decreases, the accuracy of reconstructed images degrades significantly more quickly for images acquired with MPTs than for images acquired with STs; the image profile of MPTs with 60 bed positions already shows a considerable mismatch in the middle section of the phantom, whereas the image profile of STs with 28 bed positions shows only a slight degradation. Figure 3 shows the NME (Fig. 3A) and NMSE (Fig. 3B) of the images of the image-quality phantom scan simulations as a function of the number of bed positions, both for MPTs and for STs. STs resulted in a lower NME and NMSE than MPTs at an equal number of bed positions, for all simulated bed trajectories. The increase in both errors for a decreasing number of bed positions is significantly less for STs than for MPTs.

NME (A) and NMSE (B) of reconstructed image-quality phantom images as function of number of bed positions for MPTs and STs.
Physical Defrise Phantom Scans
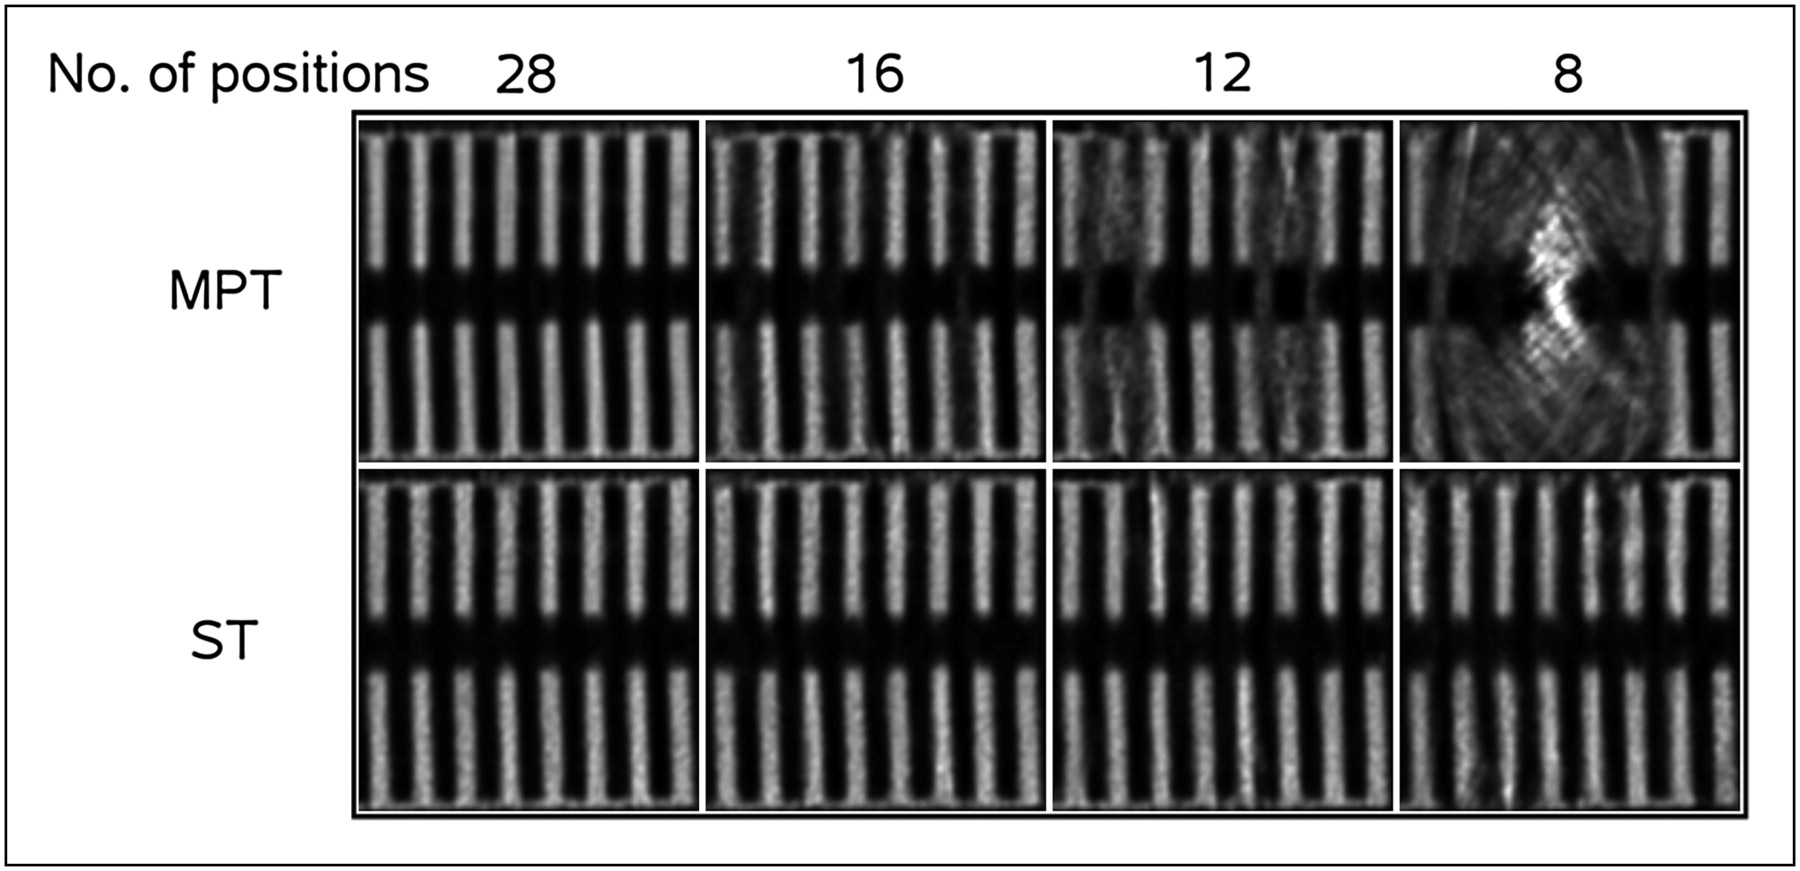
Figure 4 shows 3-mm-thick slices through the reconstructed images of the physical Defrise phantom acquired with MPTs and STs for a decreasing number of bed positions. The experimental images convey the same message as the results of the scan simulations reported in the previous paragraph: MPTs lead to axial blurring artifacts when the number of bed positions becomes 16 or less, corresponding to MPTs with about 60 or fewer bed positions in the phantom scan simulations. Images acquired with STs start to show slight image degradation for 8 bed positions and still show no significant axial blurring artifacts. This result corresponds to STs with 28 bed positions in the phantom scan simulations.

Longitudinal slices through disks of reconstructed physical Defrise phantom images for MPTs and STs for decreasing number of bed positions.
Animal Studies
All in vivo scans were performed using STs with an average longitudinal bed step size of 3.4 mm (equal to the bed step size of STs with 28 bed positions in the phantom scan simulations or the bed step size of STs with 8 bed positions in the physical Defrise phantom scans). Twenty-three bed positions were needed to scan the selected scan volume for the dynamic total-body bone scan and 9 bed positions were needed to perform the dynamic hepatobiliary scan.
Dynamic Bone Scan
Figure 5A shows sagittal maximum-intensity projections of the distribution of 99mTc-hydroxymethylene diphosphonate in a mouse at different time frames with a time resolution of 1 min. Figure 5B shows time–activity curves of the tracer concentration in several organs and structures. In the first minutes after injection, the highest tracer concentrations were in the heart, liver, kidneys, and bladder. From the tenth minute, uptake in bone reached activity levels high enough for bony structures such as the left shoulder, spine, and left knee to become clearly visible.
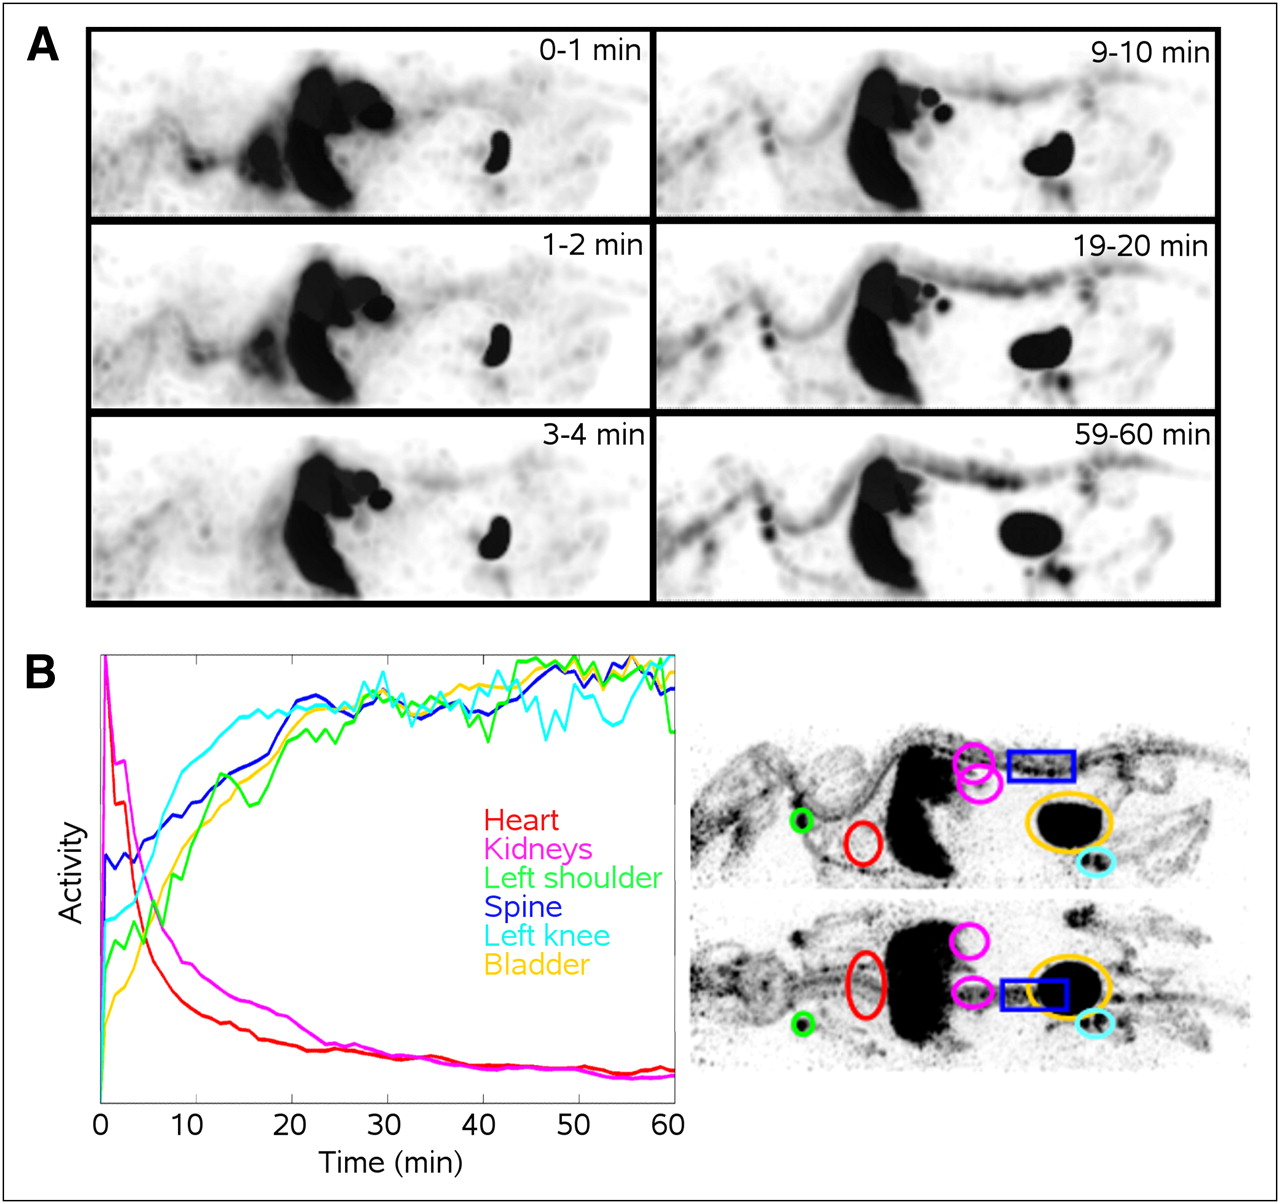
(A) Maximum-intensity projections of reconstructed dynamic 99mTc-hydroxymethylene diphosphonate scan with 1-min time frames at different time points. (B) Time–activity curves for several organs and structures, with each curve normalized to its maximum, and illustration of VOIs projected onto sagittal and coronal maximum-intensity projections of high-count reconstruction of summed projection data of last 30 frames (31–60 min).
Dynamic Hepatobiliary Scan
Figure 6A shows a time series of coronal maximum-intensity projections of the reconstructed dynamic 99mTc-mibrofenin scan with 15-s time frames. Figure 6B shows time–activity curves of the tracer concentration in several organs. The tracer traveled via the inferior vena cava into the heart, went into the liver, and accumulated in the gallbladder. The tracer finally left the gallbladder via the duodenum. Videos of both dynamic scans are available online as supplemental data at http://jnm.snmjournals.org.

(A) Maximum-intensity projections of reconstructed dynamic 99mTc-mibrofenin scan with 15-s time frames. (B) Time–activity curves for several organs, with each curve normalized to its maximum, and coronal projections of VOIs.
DISCUSSION
This study has proposed fast acquisition protocols for total-body SPECT with focusing pinhole collimators. The experiments indicated that STs are suitable for fast total-body SPECT since the number of bed positions can be much smaller than with MPTs, lowering the overhead time due to bed repositioning and allowing for faster image reconstruction.
The geometry of different U-SPECT-II collimators for mouse and rat imaging is similar (cylindric tubes with pinholes focusing on a central volume). Therefore, STs for fast dynamic SPECT may well be applicable to other purpose-built FMP collimators currently in use with this device (e.g., general-purpose rat collimator and high-sensitivity mouse collimator with 1-mm pinholes). However, further validation is required for these collimators.
In this paper, fast total-body mouse imaging with minute resolutions was enabled by diminishing the number of bed positions. Imaging time might be further reduced by increasing the speed of the xyz stage during bed movements to reduce the time lost per bed translation. However, there is a trade-off between the speed and the accuracy of the xyz stage; reduced positioning accuracy might lead to artifacts in the reconstructed images (13).
The time resolutions of dynamic total-body mouse scans that can be achieved by FMP SPECT are also subject to collimator sensitivity. The higher a collimator’s sensitivity, the faster a certain number of photons can be collected. However, increasing the collimator’s sensitivity (e.g., using pinholes with larger diameters) may affect image resolution. Here, we improved overall count yield at a fixed resolution–sensitivity trade-off of the system by significantly decreasing overhead times due to translations of the animal bed. However, with lower administered activities and shorter scan times, higher sensitivity, accomplished by, for example, the use of larger-diameter pinholes, may be beneficial. A high-sensitivity mouse collimator with 1-mm pinholes was recently constructed for U-SPECT-II and has about 2.5 times higher sensitivity than the collimator used for the present studies (0.6-mm pinholes). The ability shown here to perform fast dynamic small-animal SPECT enables studies such as total-body tracer kinetic modeling, which at present are usually performed with PET.
STs allow for reducing the required number of bed positions by a factor of more than 2, compared with MPTs. Therefore, for scans performed with STs, the number of projection bins used for image reconstruction can be more than halved, compared with scans performed with MPTs. The time needed for the forward-projection step and back-projection steps in the reconstruction algorithm can therefore be reduced more than 2-fold, compared with scans that are performed with MPTs (13). This is desirable, especially for studies that have many images to be reconstructed such as high-throughput studies or dynamic studies, in which every scan consists of many short time frames.
CONCLUSION
This paper has introduced STs of the animal bed for fast dynamic FMP SPECT with a stationary detector setup. Phantom studies show that STs can be used with a more than 2-fold lower number of bed positions than MPTs. The feasibility of applying STs to fast mouse scans was demonstrated, opening new possibilities for high-throughput and fast dynamic SPECT studies for use in such applications as total-body tracer kinetic modeling.
DISCLOSURE STATEMENT
The costs of publication of this article were defrayed in part by the payment of page charges. Therefore, and solely to indicate this fact, this article is hereby marked “advertisement” in accordance with 18 USC section 1734.
Acknowledgments
This research was cofinanced by grant PID06015 under the program Pieken in the Delta Zuidvleugel of the Ministry of Economic Affairs and Provincie Zuid-Holland, The Netherlands. No other potential conflict of interest relevant to this article was reported.
Footnotes
Published online Jun. 15, 2012.
- © 2012 by the Society of Nuclear Medicine and Molecular Imaging, Inc.
REFERENCES
- Received for publication December 14, 2011.
- Accepted for publication April 4, 2012.


Jump to section
Related Articles
Cited By...
- Utilizing High-Energy {gamma}-Photons for High-Resolution 213Bi SPECT in Mice
- Ultra-High-Sensitivity Submillimeter Mouse SPECT
- Performance Assessment of a Preclinical PET Scanner with Pinhole Collimation by Comparison to a Coincidence-Based Small-Animal PET Scanner
- VECTor: A Preclinical Imaging System for Simultaneous Submillimeter SPECT and PET