


Abstract
18F-FDG, 18F-fluorothymidine, and 18F-misonidazole PET scans have emerged as important clinical tools in the management of cancer; however, none of them have demonstrated conclusive superiority. The aim of this study was to compare the intratumoral accumulation of 18F-FDG, 18F-fluorothymidine, and 18F-misonidazole and relate this to specific components of the tumor microenvironment in mouse models of human non–small cell lung cancer (NSCLC). Methods: We used NSCLC A549 and HTB177 cells to generate subcutaneous and peritoneal xenografts in nude mice. Animals were coinjected with a PET radiotracer, pimonidazole (hypoxia marker), and bromodeoxyuridine (proliferation marker) intravenously 1 h before animal euthanasia. Tumor perfusion was assessed by Hoechst 33342 injection, given 1 min before sacrifice. The intratumoral distribution of PET radiotracers was visualized by digital autoradiography and related to microscopic visualization of proliferation, hypoxia, perfusion, stroma, and necrosis. Results: NSCLC xenografts had complex structures with intermingled regions of viable cancer cells, stroma, and necrosis. Cancer cells were either well oxygenated (staining negatively for pimonidazole) and highly proliferative (staining positively for bromodeoxyuridine) or hypoxic (pimonidazole-positive) and noncycling (little bromodeoxyuridine). Hypoxic cancer cells with a low proliferation rate had high18F-FDG and 18F-misonidazole uptake but low 18F-fluorothymidine accumulation. Well-oxygenated cancer cells with a high proliferation rate accumulated a high level of 18F-fluorothymidine but low 18F-FDG and18F-misonidazole. Tumor stroma and necrotic zones were always associated with low 18F-FDG, 18F-misonidazole, and 18F-fluorothymidine activity. Conclusion: In NSCLC A549 and HTB177 subcutaneously or intraperitoneally growing xenografts, 18F-fluorothymidine accumulates in well-oxygenated and proliferative cancer cells, whereas 18F-misonidazole and 18F-FDG accumulate mostly in poorly proliferative and hypoxic cancer cells. 18F-FDG and 18F-misonidazole display similar intratumoral distribution patterns, and both mutually exclude 18F-fluorothymidine.
PET has emerged as an important clinical tool for cancer detection, cancer staging, and monitoring of response to therapy. The 3 most commonly used tracers are 18F-FDG, 18F-fluorothymidine, and 18F-misonidazole, which are applied for PET of tumor glucose metabolism, cell proliferation, and tumor hypoxia, respectively. However, no tracer is conclusively superior in the management of cancer. This uncertainty may be due in part to the difficulty of directly comparing tracers that cannot be coimaged. To circumvent this problem, serial PET scans have been used in clinical studies in patients (1–7) and animal models (8–14). However, the results have been mixed, probably for the following reasons.
First, solid cancers have a highly complex and heterogeneous microenvironment (15–17), composed of viable cancer cells, stroma, and necrosis. Viable cancer cells are either hypoxic or well oxygenated (15,16,18), and the distribution of proliferative cells is also heterogeneous (8,10,18–20). Obviously, as it is impossible to generate 2 individual tumors with the same or similar microenvironment components, it is invalid to compare 18F-FDG, 18F-fluorothymidine, and 18F-misonidazole uptake using different tumors.
Second, serial PET scans in which the same tumor is probed with different tracers, separated by some time interval, are also problematic. Published data have demonstrated that the tumor microenvironment may be unstable even over short periods. Acute hypoxia may occur any time due to a shutdown of blood flow. Chronically hypoxic human head–neck cancer cells have shown a rapid turnover rate in animal models (21) and in head–neck cancer patients (6). PET/CT studies performed on subsequent days may not necessarily provide a reliable comparison between multiple PET tracers; tumor microenvironments may have already changed before a second PET scan is performed.
In this study, we indirectly compared 18F-FDG, 18F-fluorothymidine, and 18F-misonidazole by coinjecting each with both pimonidazole and bromodeoxyuridine and using digital autoradiography (DAR) to detect radiotracer accumulation. DAR images were then related to immunohistochemical and histologic images of tumor hypoxia, proliferation, stroma, and necrosis. To minimize issues associated with section alignment and registration, the same tumor section or contiguous adjacent sections were used for all images as we described previously (8,22). We have compared 18F-FDG, 18F-fluorothymidine, and 18F-misonidazole uptake by relating it to common intratumoral microenvironment components, such as hypoxic versus well-oxygenated cancer cells, proliferative versus nonproliferative cancer cells, stroma, and necrosis of different non–small cell lung cancer (NSCLC) xenografts growing subcutaneously or intraperitoneally.
MATERIALS AND METHODS
Tumor Cell Lines and Animals
The human NSCLC A549 and HTB177 cell lines were used in the experiments. All were purchased from American Type Culture Collection. A549 and HTB177 cells were maintained in F-12K medium and RPMI 1640 medium (Cellgro), respectively. All media were supplemented with 10% fetal bovine serum (Gemini) and a mixture of 1% glutamine and 1% antibiotic (Cellgro). Cells were grown in a humidified incubator at a 37°C air atmosphere containing 5% carbon dioxide. Exponentially growing cells were harvested with 0.25% (w/v) trypsin–0.53 mM ethylenediamine tetraacetic acid solution, washed, and suspended in phosphate-buffered saline. The number of viable cells was counted using a Vi-CELL cell viability analyzer (Beckman-Coulter).
All experiments were performed using 6- to 8-wk-old female athymic NCr-nu/nu mice purchased from NCI-Frederick Cancer Research Institute. The animal protocol was approved by the Institutional Animal Care and Use Committee (University of Louisville Health Center). Nude mice were maintained and used according to the institutional guidelines. Animals were housed 5 per cage and kept in the institutional small-animal facility at a constant temperature and humidity. Food pellets and water were provided ad libitum.
Establishment of Tumors in Mice
Subcutaneous tumors were initiated by injecting 5 × 10⁶ tumor cells in 0.1 mL of phosphate-buffered saline into the mouse flank. The experiments were performed when the tumors reached approximately 1 cm in average diameter—typically 3 wk after initiation.
Disseminated microscopic tumors were induced in the peritoneum by injecting tumor cell suspensions (5 × 10⁶ cells/0.2 mL) into the peritoneal cavity. The animals were used for experiments approximately 4 wk after injection. At that time, a distribution of tumors of varying sizes was observed to be present.
PET Radiotracers
18F-FDG and 18F-fluoride were purchased from the P.E.T. NET Pharmaceuticals Inc. facility at the University of Louisville Hospital. 18F-fluorothymidine and 18F-misonidazole were prepared according to published methods (23,24) with an automated modular-lab system (Eckert and Ziegler). In brief, 18F-fluoride was passed through a QMA cartridge and eluted with 0.5 mL of tetrabutylammonium bicarbonate (75 mM) into the reaction vessel. Dry acetonitrile (1 mL) was added into the reaction vessel and heated with the help of a nitrogen flow until completely dry. For the preparation of 18F-fluorothymidine, 20 mg of the precursor 3-N-Boc-1-[5-O-(4,4′-dimethoxytrityl)-3-O-nosyl-2-deoxy-β-d-lyxofuranosyl]thymine (ABX) in 100 μL of CH3CN and 500 μL of t-butanol were added and reacted for 15 min at 105°C, followed by hydrolysis with 1N HCl (1 mL) at 105°C for 10 min. After cooling to room temperature, 1N sodium acetate (1 mL) was added and then delivered to semipreparative C18 high-performance liquid chromatography for purification. For the preparation of 18F-misonidazole, all procedures were similar except that 10 mg of 3-(2-nitroimidazol-1-yl)-2-O-tetrahydropyranyl-1-O-toluenesulfonylpropanediol (ABX) was used as the precursor. Radiochemical yields for 18F-fluorothymidine and 18F-misonidazole by thin-layer chromatography were approximately 50% and 70%, respectively. Radiochemical purity was greater than 99% for both 18F-fluorothymidine and 18F-misonidazole.
Markers of Hypoxia, Proliferation, and Perfusion
The hypoxia marker, pimonidazole hydrochloride (1-[(2-hydroxy-3-piperidinyl)propyl]-2-nitroimidazole hydrochloride) (Hypoxyprobe Inc.), was dissolved in physiologic saline at a concentration of 20 mg/mL. The proliferation marker, bromodeoxyuridine (Roche Diagnostics), was first dissolved in dimethyl sulfoxide and further diluted in physiologic saline to a final concentration of 20 mg/mL. The blood perfusion marker, Hoechst 33342 (Sigma-Aldrich), was dissolved in physiologic saline at a concentration of 5 mg/mL. In all cases, fresh drug solutions were prepared on the day of injection.
Experimental Procedures
18F-FDG (7.4 MBq), 18F-fluorothymidine (7.4 MBq), or 18F-misonidazole (7.4 MBq) was coinjected with pimonidazole (2 mg) and bromodeoxyuridine (4 mg) via the tail vein 1 h before animal euthanasia (total injection volume, 0.4 mL). Hoechst 33342 (0.5 mg, 0.1 mL) was injected via the tail vein 1 min before sacrifice. For each PET tracer and cell line, 5 mice with subcutaneous xenografts and 3 mice bearing peritoneal tumors were included in the study. For the 18F-FDG study only, animals were kept fasting overnight.
Preparation of Frozen Tumor Sections
As we described previously (8,18,22), immediately after animal sacrifice, tumor tissues were removed for subsequent processing. Subcutaneous xenografts and peritoneal tumors were frozen and embedded in optimal cutting temperature medium (4583; Sakura Finetek). Immediately thereafter, 5 contiguous 7-μm-thick tissue sections were cut using a 3050S cryostat microtome (Leica, Inc.) and adhered to poly-l-lysine–coated glass microscope slides (Fisher Scientific, Inc).
18F-FDG, 18F-Fluorothymidine, and 18F-Misonidazole DAR
Autoradiograms were obtained by placing the tumor sections in a film cassette against an imaging plate as described previously (8,22). The same plate was used throughout the experiments; the plate was exposed for approximately 20 h and read using a Cyclone Plus imaging system (PerkinElmer, Inc.), which generated digital images with pixel dimensions of 42 × 42 μm. Regions of interest (100 × 100 μm) were drawn over hypoxic and low-proliferation regions, nonhypoxic and high-proliferation regions, stroma, and necrosis in DAR imaging, with reference to immunohistochemical and hematoxylin- and eosin-stained images obtained from the same or an adjacent section for DAR. DAR imaging was quantified by OptiQuant software (PerkinElmer Inc.), and tracer uptake was initially expressed as digital light units per square millimeter. Subsequently, the derived values were converted to MBq/g on the basis of the known section thickness (7 μm) and system calibration factor of 35.4 digital light units per becquerel, which was obtained from a pilot experiment using multiple 18F-FDG point sources. Finally, tracer uptake in each microenvironment component was expressed as percentage injected dose per gram of tumor tissue.
Visualization of Pimonidazole, Bromodeoxyuridine, and Hoechst 33342
Pimonidazole, bromodeoxyuridine, and Hoechst 33342 images were obtained after completion of DAR exposures as described previously (8,18,22). To minimize issues associated with section alignment and registration, the same tumor section used for DAR or contiguous adjacent sections was used for all images. Briefly, slides were air-dried, fixed in cold acetone (4°C) for 20 min, and incubated with SuperBlock (37515; Pierce Biotechnology) at room temperature for 30 min. All antibodies were also applied in SuperBlock. Sections were then incubated with fluorescein isothiocyanate–conjugated antipimonidazole monoclonal antibody (Hypoxyprobe Inc.), diluted 1:25, for 1 h at room temperature. For bromodeoxyuridine staining, sections adjacent to those stained for pimonidazole were treated with 2N HCl for 10 min at room temperature followed by 0.1 M borax for 10 min at room temperature. Sections were then exposed to AlexaFluor594-conjugated antibromodeoxyuridine antibody (1:20 dilution; Molecular Probes) for 1 h at room temperature. To control for nonspecific binding of antibodies, stained sections were processed from similar tumors that had not been exposed to pimonidazole or bromodeoxyuridine.
Images were acquired at ×40 magnification using an Eclipse E800 fluorescence microscope (Nikon America Inc.) equipped with a motorized stage (Ludi Electronic Products Ltd.). Hoechst 33342 and pimonidazole were imaged using blue and green filters, respectively. Bromodeoxyuridine was imaged using a red filter. Hematoxylin- and eosin-stained images were examined by light microscopy. Microscopic images were coregistered and analyzed using Neurolucida 7.0 (MicroBrightField, Inc.) and Photoshop 7.0 (Adobe). Proliferation index was measured by evaluating the percentage of nuclei that stained positively for bromodeoxyuridine antibody.
Statistical significance was examined by a 2-tailed Student t test. A P value of less than 0.05 was considered to indicate a statistically significant difference. Correlation between proliferation index and 18F-fluorothymidine uptake was analyzed by Pearson multiple regression using GraphPad Prism (GraphPad Software Inc.).
RESULTS
NSCLC had intermingled but clearly defined regions of cancer cells, stroma, and necrosis. Figure 1A shows an example of the complex microenvironment revealed by hematoxylin- and eosin-stained slices from an HTB177 subcutaneous xenograft. Cancer cells were further divided into 2 subcategories according to oxygenation status and cellular proliferation (Fig. 1B): cancer cells close to functional blood vessels (positive Hoechst 33342) stained negatively for pimonidazole but positively for bromodeoxyuridine, indicating that the cells were well oxygenated and proliferative. Cancer cells approximately 150 μm away from functional blood vessels or close to necrosis stained positively for pimonidazole but negatively for bromodeoxyuridine, indicating that these cancer cells were hypoxic and less proliferative.
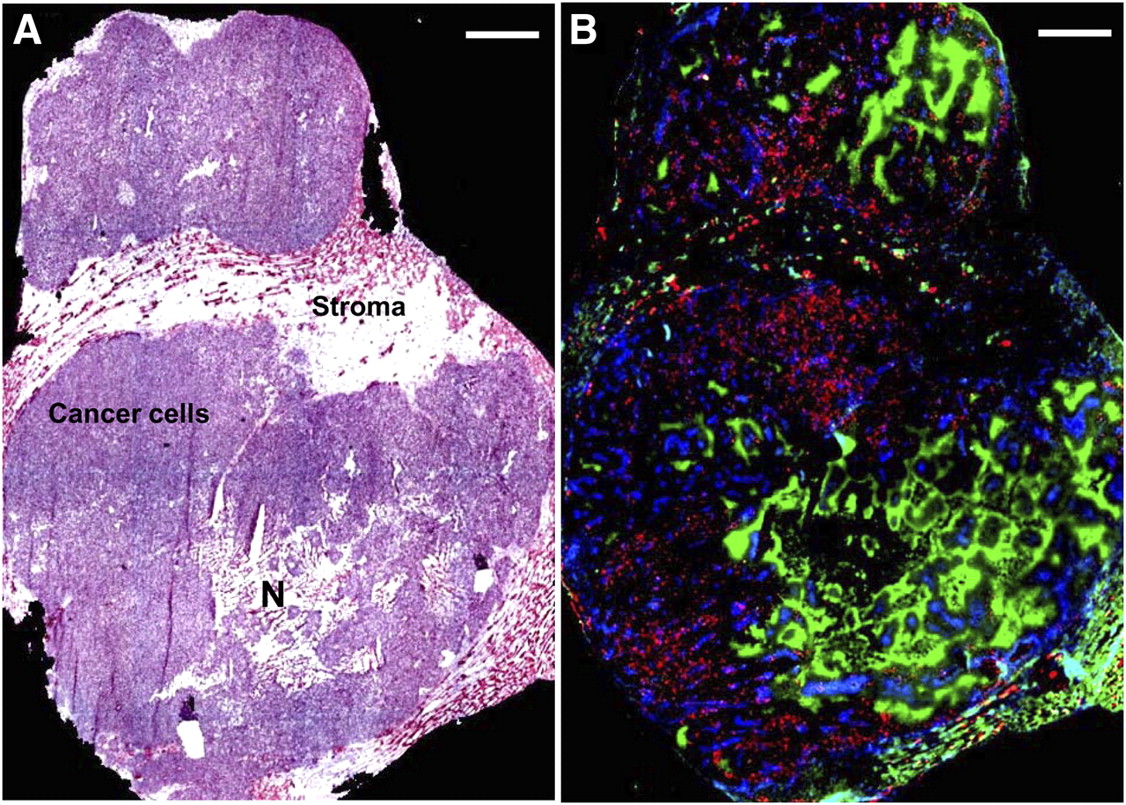
Complex microenvironment of HTB177 subcutaneous xenograft. (A) Hematoxylin- and eosin-stained image of xenograft shows stroma, cancer cells, and necrosis (N). (B) Fluorescence overlay image of section contiguous to hematoxylin- and eosin-stained section shows hypoxia, proliferation, and perfusion. Pimonidazole is shown as green, Hoechst 33342 as blue, and bromodeoxyuridine as red. Both scale bars = 1 mm.
18F-FDG uptake in subcutaneous xenografts and disseminated peritoneal tumors arising from both A549 and HTB177 tumor cells was studied, and the results were broadly similar. Representative examples show the relationship between 18F-FDG uptake and pimonidazole (green), bromodeoxyuridine (red), Hoechst 33342 (blue), tumor stroma, and necrosis in an A549 subcutaneous xenograft (Fig. 2 and Supplemental Fig. 1) and a HTB177 peritoneal tumor (Supplemental Fig. 2). In general, there was spatial colocalization between high levels of 18F-FDG uptake and high pimonidazole binding, and such regions also tended to correspond to low proliferation and perfusion. On the other hand, nonhypoxic cancer cells were proliferating more actively; these regions displayed low 18F-FDG uptake (Fig. 2 and Supplemental Fig. 2). Both stroma and necrotic zones were also associated with lower 18F-FDG activity. 18F-FDG accumulation and pimonidazole binding were similar but not identical; there were a few mismatched regions, and areas of 18F-FDG accumulation appeared broader than areas of pimonidazole accumulation.
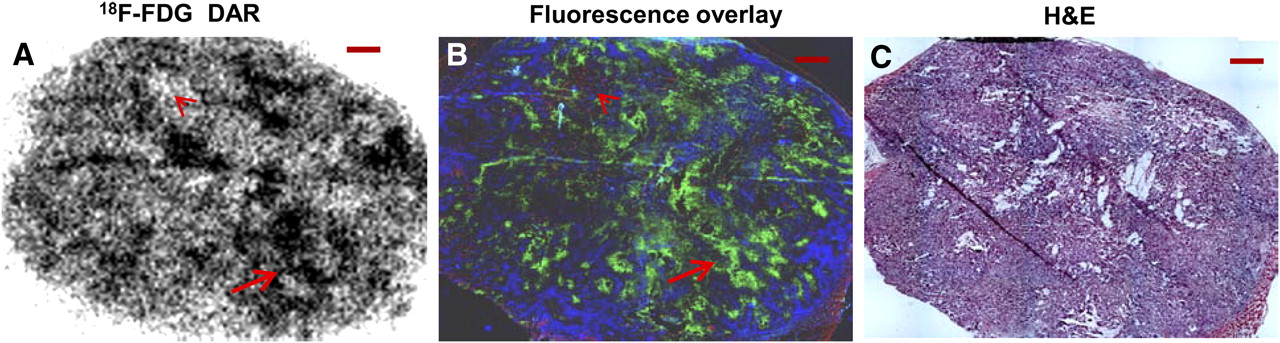
Relationship between 18F-FDG uptake and hypoxia, proliferation, and perfusion in HTB177 subcutaneous xenograft. (A and B) 18F-FDG uptake detected by DAR (A) is found on fluorescence overlay (B) in hypoxic (pimonidazole-positive, green) but low-proliferation (bromodeoxyuridine-negative) cancer cells as arrow indicates. Nonhypoxic (pimonidazole-negative), proliferative (bromodeoxyuridine-positive, red), and well-perfused (Hoechst-positive, blue) cancer cells have low 18F-FDG uptake (arrowheads). Stroma and necrotic zones associate with low 18F-FDG activity. (C) Hematoxylin- and eosin-stained adjacent section (H&E) is provided for reference. All scale bars = 1 mm.
In contrast, 18F-fluorothymidine preferentially accumulated in areas of the tumor that showed high uptake of bromodeoxyuridine and stained negatively for pimonidazole. This preference was demonstrated for both cell lines, grown either as subcutaneous xenografts or disseminated peritoneal diseases. For example, in HTB177 peritoneal tumors (Fig. 3 and Supplemental Fig. 3A), high18F-fluorothymidine uptake was found in the regions of high bromodeoxyuridine-binding cancer cells that were negative for pimonidazole staining, indicating high proliferation and good oxygenation. Low 18F-fluorothymidine accumulation was found in cancer cells that stained positively for pimonidazole but negatively for bromodeoxyuridine. 18F-fluorothymidine uptake significantly correlated with proliferation index (r = 0.91, P < 0.001, Supplemental Fig. 3B). 18F-fluorothymidine accumulation was low in stroma and necrosis.
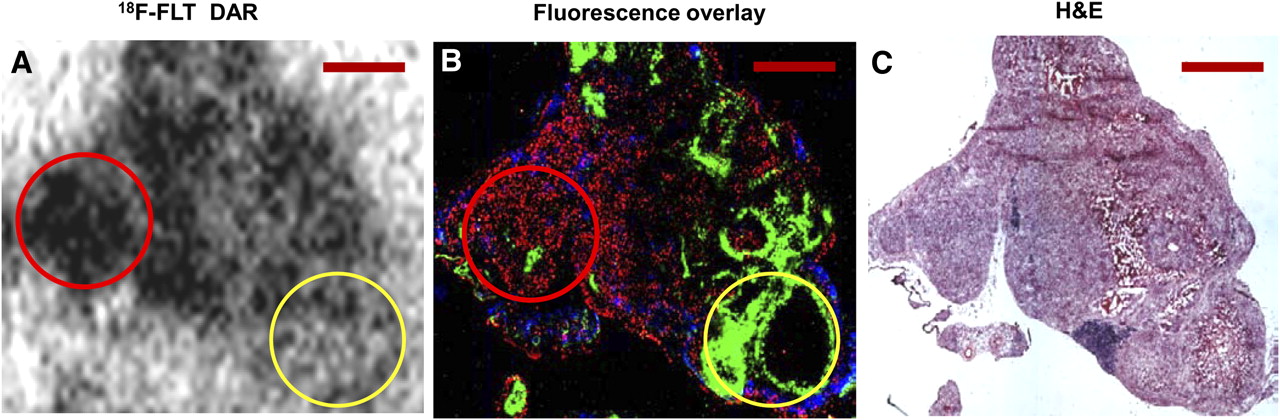
Relationship between 18F-fluorothymidine uptake and hypoxia, proliferation, and perfusion in HTB177 peritoneal tumor model. (A and B) High 18F-fluorothymidine (FLT) accumulation (A) is found on fluorescence overlay (B) in highly proliferating cancer cells (bromodeoxyuridine-positive, red), which are well perfused (Hoechst positive, blue) and well oxygenated (pimonidazole-negative) (red circle). Pimonidazole-positive (green) cancer cells have little 18F-fluorothymidine uptake (yellow circle). Stroma and necrotic zones associate with low 18F-fluorothymidine activity. (C) Hematoxylin- and eosin-stained adjacent section (H&E) is provided for reference. All scale bars = 1 mm.
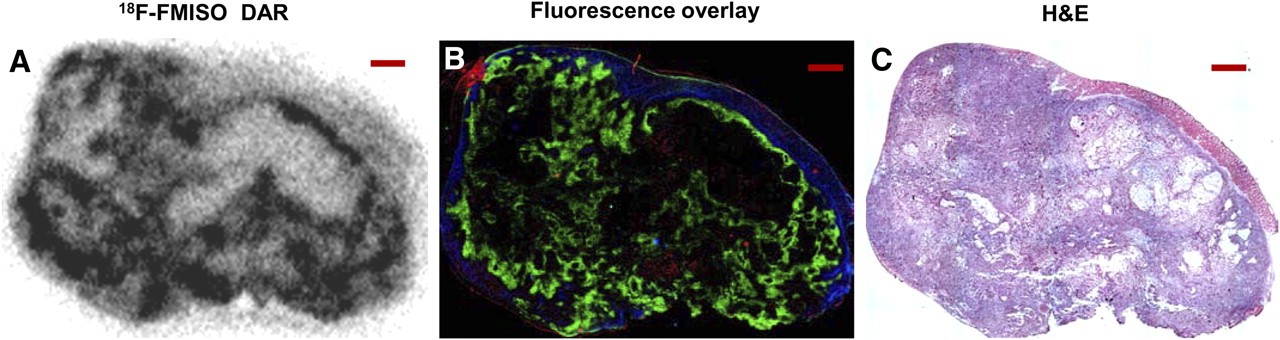
Representative examples of the relationship between 18F-misonidazole uptake and pimonidazole binding, proliferation, and perfusion are shown in an A549 subcutaneous xenograft (Fig. 4 and Supplemental Fig. 4A) and peritoneal tumors (Supplemental Fig. 4B). In general, there was spatial colocalization between high levels of 18F-misonidazole uptake and pimonidazole binding. Such regions tended to correspond to low proliferation and perfusion. Well-oxygenated cancer cells with a high proliferation rate had low 18F-misonidazole uptake. Stroma and necrotic zones had low 18F-misonidazole accumulation. Subcutaneous xenografts and disseminated peritoneal disease arising from both cancer lines were investigated, and results were similar.

Relationship between 18F-misonidazole uptake and hypoxia, proliferation, and blood perfusion in A549 subcutaneous xenograft. (A and B) High 18F-misonidazole (FMISO) uptake (A) closely associates on fluorescence overlay (B) with hypoxia (pimonidazole-positive, green). Nonhypoxic cancer cells are proliferative (bromodeoxyuridine-positive, red) and well perfused (Hoechst 33342–positive, blue) and have low 18F-misonidazole uptake. Stroma and necrotic zones associate with low 18F-misonidazole activity. (C) Hematoxylin- and eosin-stained adjacent section (H&E) is provided for reference. All scale bars = 1 mm.
Comparison of the uptake of 18F-FDG, 18F-fluorothymidine, and 18F-misonidazole in each tumor environment component in HTB177 tumor is summarized in Figure 5. 18F-FDG accumulation (expressed as percentage injected dose per gram, mean ± SD) was approximately 3-fold higher in hypoxic cancer cells than in well-oxygenated cancer cells, stroma, and necrosis (P < 0.001 for all, Fig. 5A). 18F-fluorothymidine uptake was 2-fold higher in nonhypoxic (well-oxygenated) regions, where proliferation was highest, than in hypoxic cancer cell areas, stroma, and necrosis (P < 0.01, Fig. 5B). 18F-misonidazole uptake was approximately 3-fold higher in hypoxic cancer cells than in nonhypoxic cancer cells, stroma, and necrosis (P < 0.001, Fig. 5C). Regions of hypoxic (and low-proliferation) cancer cells had high 18F-FDG and 18F-misonidazole uptake but low 18F-fluorothymidine uptake, and regions of well-oxygenated (also highly proliferative) cancer cells had low 18F-FDG and 18F-misonidazole uptake but high 18F-fluorothymidine accumulation, intratumor stroma, and necrotic zones associated with low accumulation of all tracers we tested (Supplemental Fig. 5). Similar quantitative results were observed in A549 tumors (data not shown).
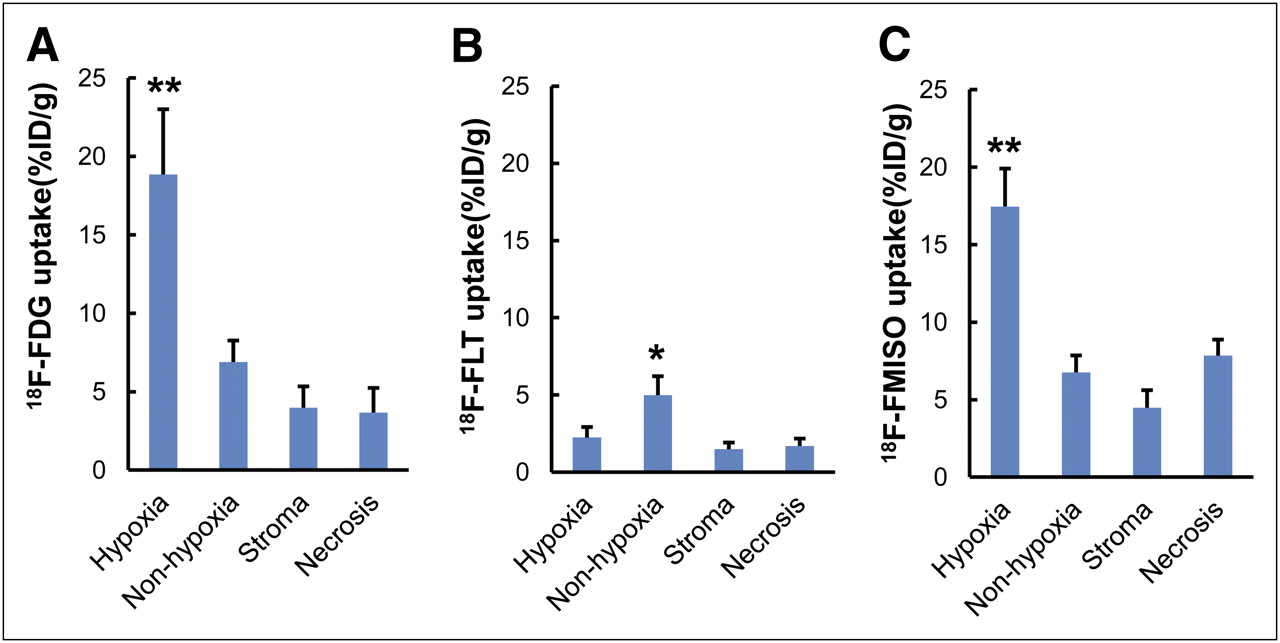
Comparison of PET tracer uptake in each microenvironment component in HTB177 tumors defined by immunohistochemical visualization and hematoxylin- and eosin-stained imaging: 18F-FDG uptake (percentage injected dose per gram) (A), 18F-fluorothymidine (FLT) uptake (B), and 18F-misonidazole (FMISO) uptake (C). *P < 0.01, compared with all other groups. **P < 0.001, compared with all other groups. n = 20–30 measurements.
DISCUSSION
In this study, we have shown that the microenvironment of A549 and HTB177 xenografts is complex and highly heterogeneous, being composed of viable, minimally proliferative, and hypoxic cancer cells; nonhypoxic and highly proliferative cancer cells; noncancerous stroma; and necrotic zones (Fig. 1). This finding is in good agreement with histologic findings in NSCLC patients (15,16), suggesting that our tumor models can mimic human NSCLC. In this study, cellular proliferation and hypoxia were found to be mutually exclusive (Fig. 1), as agrees with previous reports by us (18,25) and others (10,19,20). Because of the complex tumor microenvironment, it is impossible to generate identical experimental xenografts for the purpose of comparing different PET tracers.
We have successfully compared 18F-FDG, 18F-fluorothymidine, and 18F-misonidazole uptake by relating them to specific components of the intratumoral microenvironment (Figs. 2–4⇑⇑ and Supplemental Figs. 2 and 4B). We injected each PET tracer with pimonidazole and bromodeoxyuridine simultaneously, and we compared DAR imaging with histologic visualization of tumor hypoxia and proliferation in the same or an adjacent section (8,22). Factors potentially affecting results such as a change in microenvironment, misalignment, and misregistration were minimized.
Another way to compare PET tracers would be to conduct serial PET scans on the same tumor, as has been done to compare tumor uptake of 18F-FDG, 18F-fluorothymidine, and 18F-misonidazole both clinically and preclinically (1–14). However, the results have been mixed and controversial. One possible reason is that the intratumoral microenvironment is fluctuating during the intervals between scans. A rapid change in hypoxia in experimental xenografts growing in animals and solid cancers in patients has been reported. Ljungkvist et al. have demonstrated that hypoxic human head–neck cancer cells had a rapid turnover rate; debris from pimonidazole-labeled hypoxic cancer cells was found in the necrotic zone 1–3 d later, and new hypoxia formed during this period (21). Nehmeh et al. found a significant difference in intratumor 18F-misonidazole distribution between two 18F-misonidazole PET/CT scans in the same head–neck cancer patients over a 3-d interval, possibly because of a change in tumor hypoxia during this period (6). Future investigations would need to address the timing for stability of tumor microenvironment components.
The observation that 18F-FDG accumulation tended to colocalize with hypoxia (Fig. 2) agrees with our previous findings in the human colorectal cancer cell lines HT29 and HCT-8 (8) and is consistent with previous in vivo (10,26) and in vitro (9,27,28) studies. Hypoxia results in upregulation of glucose transporters and hexokinase proteins (29–33), key facilitators of glucose uptake and metabolism. In addition, anaerobic glycolysis is an inefficient biochemical pathway of energy generation, requiring significantly more (a factor of 18) glucose molecules than oxidative phosphorylation to produce similar amounts of adenosine triphosphate. These factors may be related to the higher uptake of 18F-FDG in hypoxic cells.
A similar explanation could be made with respect to the Warburg effect (aerobic glycolysis). German biologist Otto Warburg found that even in the presence of ample oxygen, cancer cells use glucose by aerobic glycolysis (34), which is a fundamental feature of cancer (35). In operational terms, the existence of aerobic glycolysis would confer a general increase in 18F-FDG uptake throughout tumors, spatially unrelated to the microdistribution of hypoxia, and would thus result in a relatively high 18F-FDG background. A hypoxia-dependent component of 18F-FDG uptake may still arise from hypoxia-dependent upregulation of the expression or activity of glucose transporters or hexokinases, but differences between oxic and hypoxic regions would be diminished in tumors displaying the classic Warburg effect. It is possible that this mechanism may partly explain our observation of discrepancies between regions of 18F-FDG accumulation and enhanced pimonidazole binding and why regions of 18F-FDG accumulation appear broader and more blurred than those of 18F-misonidazole. However, 18F-FDG uptake in nonhypoxic (pimonidazole-negative) regions of our tumor models was typically low and not statistically different from stromal or necrotic regions (Fig. 5).
We found that high 18F-misonidazole uptake was closely associated with pimonidazole-positive hypoxic cells, whereas well-oxygenated cancer cells, stroma, and necrosis had low 18F-misonidazole accumulation (Fig. 4 and Supplemental Fig. 4B). Troost et al. reported a similar result in head–neck cancer xenografts (14). 18F-misonidazole PET/CT may noninvasively detect hypoxic cells in patients.
18F-FDG and 18F-misonidazole uptake (percentage injected dose per gram) in hypoxic regions was similar (18% ± 4% and 17% ± 2%, respectively, for HTB177, and 18% ± 3% and 16% ± 5%, respectively, for A549; P > 0.05 in both cell lines). The patterns of intratumoral accumulation of 18F-misonidazole were also similar, but not identical, to those of 18F-FDG. In particular, we observed that regions of higher 18F-FDG accumulation appeared to be broader and more blurred on DAR (Fig. 2 and Supplemental Fig. 2) than those of 18F-misonidazole (Fig. 4). This finding may be related to the Warburg effect or to differences between hypoxia-regulated protein expression and the dependency of 2-nitroimidazole binding on partial pressure of oxygen.
High 18F-fluorothymidine uptake was found in regions where there was greater binding of bromodeoxyuridine. Therefore, 18F-fluorothymidine PET/CT maps the amount of proliferative cells in cancers, and 18F-fluorothymidine may be able to observe the change in proliferation after anticancer therapies. Maximal intratumoral uptake of 18F-fluorothymidine is around 30% of maximal 18F-FDG and 18F-misonidazole uptake, possibly because less than about 30% of the cells in the nonhypoxic zones accumulated 18F-fluorothymidine, whereas all cancer cells in hypoxic zones were presumably able to accumulate both 18F-FDG and 18F-misonidazole.
CONCLUSION
The microenvironment of NSCLC A549 and HTB177 subcutaneous xenografts and peritoneal metastases is complex and highly heterogeneous. 18F-fluorothymidine generally accumulates in proliferating cancer cells, whereas 18F-misonidazole and 18F-FDG accumulate mostly in hypoxic and nonproliferative cancer cells, 18F-FDG shares a similar intratumoral distribution pattern with 18F-misonidazole but mutually excludes 18F-fluorothymidine.
DISCLOSURE STATEMENT
The costs of publication of this article were defrayed in part by the payment of page charges. Therefore, and solely to indicate this fact, this article is hereby marked “advertisement” in accordance with 18 USC section 1734.
Acknowledgments
We thank Drs. Joseph O’Donoghue and James Russell at Memorial Sloan-Kettering Cancer Center (New York, NY) for their invaluable comments and thoughtful suggestions, and Professor Nigel Cooper and Dr. Haiyang Wei at the Departments of Anatomical Sciences and Neurobiology, University of Louisville (Louisville, KY) for microscope support. This study was supported by a Kentucky Lung Cancer Research Program Award (cycle 9) and in part by an international cooperation research grant from the Chinese Ministry of Science and Technology (2009DFB30040) and a scholarship from Chinese State Administration of Foreign Experts Affairs (CG2010230004). No other potential conflict of interest relevant to this article was reported.
Footnotes
Baozhong Shen, Department of Medical Imaging and Nuclear Medicine, Fourth Affiliated Hospital, Harbin Medical University, 37 Yinhang St., Nangang District, Harbin 150001, China. E-mail: shenbzh{at}vip.sina.com
Published online Jun. 19, 2012.
- © 2012 by the Society of Nuclear Medicine and Molecular Imaging, Inc.
REFERENCES
- Received for publication September 6, 2011.
- Accepted for publication March 21, 2012.


Jump to section
Related Articles
Cited By...
- Inhibition of Autotaxin with GLPG1690 Increases the Efficacy of Radiotherapy and Chemotherapy in a Mouse Model of Breast Cancer
- Lactic Acid Accumulation in the Tumor Microenvironment Suppresses 18F-FDG Uptake
- The Reverse Warburg Effect and 18F-FDG Uptake in Non-Small Cell Lung Cancer A549 in Mice: A Pilot Study
- Areas of High 18F-FDG Uptake on Preradiotherapy PET/CT Identify Preferential Sites of Local Relapse After Chemoradiotherapy for Non-Small Cell Lung Cancer
- Heterogeneity in Intratumor Correlations of 18F-FDG, 18F-FLT, and 61Cu-ATSM PET in Canine Sinonasal Tumors