


Abstract
The hypothesis of this study was that distinct experimental glioblastoma phenotypes resembling human disease can be noninvasively distinguished at various disease stages by imaging in vivo. Methods: Cultured spheroids from 2 human glioblastomas were implanted into the brains of nude rats. Glioblastoma growth dynamics were followed by PET using 18F-FDG, 11C-methyl-l-methionine (11C-MET), and 3′-deoxy-3′-18F-fluorothymidine (18F-FLT) and by MRI at 3–6 wk after implantation. For image validation, parameters were coregistered with immunohistochemical analysis. Results: Two tumor phenotypes (angiogenic and infiltrative) were obtained. The angiogenic phenotype showed high uptake of 11C-MET and 18F-FLT and relatively low uptake of 18F-FDG. 11C-MET was an early indicator of vessel remodeling and tumor proliferation. 18F-FLT uptake correlated to positive Ki67 staining at 6 wk. T1- and T2-weighted MR images displayed clear tumor delineation with strong gadolinium enhancement at 6 wk. The infiltrative phenotype did not accumulate 11C-MET and 18F-FLT and impaired the 18F-FDG uptake. In contrast, the Ki67 index showed a high proliferation rate. The extent of the infiltrative tumors could be observed by MRI but with low contrast. Conclusion: For angiogenic glioblastomas, noninvasive assessment of tumor activity corresponds well to immunohistochemical markers, and 11C-MET was more sensitive than 18F-FLT at detecting early tumor development. In contrast, infiltrative glioblastoma growth in the absence of blood–brain barrier breakdown is difficult to noninvasively follow by existing imaging techniques, and a negative 18F-FLT PET result does not exclude the presence of proliferating glioma tissue. The angiogenic model may serve as an advanced system to study imaging-guided antiangiogenic and antiproliferative therapies.
Together with all intracranial neoplasms, malignant gliomas constitute the second most common cause of death from an intracranial disease, and despite aggressive treatment strategies, including surgery, radiotherapy, and chemotherapy, median survival of patients with glioblastomas, the most common and fatal brain tumors, is still limited to 1–3 y (1).
Limitations of treatment paradigms come from the heterogeneity of glioblastoma tissue with regard to proliferation, invasion, vascularization, hypoxia, and genetic alterations, all of which constitute critical determinants for therapy response (2,3). In addition, glioblastoma is a highly dynamic disease with regard to the accumulation of molecular–genetic disease-driving alterations and various growth patterns in different locations of the tumor at various disease stages. This heterogeneity of human disease is difficult to reproduce in animal models and may be the cause of the discrepancy between the effectiveness of preclinical and clinical treatment regimens. Antiangiogenic approaches, for example, were promising in mouse models (4,5) before being discovered to initiate a transformation from an angiogenic to an infiltrative glioma phenotype in some patients (6). Therefore, there is a need for experimental glioma models that more closely resemble the heterogeneity of glioblastoma development in order to assess the efficacy of innovative treatments (7).
To enable assessment of the dynamic changes occurring in gliomas, noninvasive imaging is being implemented in patients (8,9) and translated into model systems (10,11). Because appropriate tumor samples cannot be obtained at all disease stages, longitudinal assessment of multiple and complementary imaging parameters on proliferation, angiogenesis, and migration is of crucial importance to guide therapy decisions.
To test the hypothesis that imaging is able to reveal glioblastoma heterogeneity noninvasively in vivo, an improved xenograft model of human glioblastoma has been used (12,13). The model has been described previously and displays 2 different phenotypes, invasive and angiogenic. In brief, highly infiltrative brain tumors with a stemlike phenotype were established by xenotransplantation of human glioblastoma in nude rats. These tumors, expressing neural stem cell markers, coopted the host vasculature and presented as an aggressive and infiltrative disease without signs of angiogenesis. After serial passages in animals, some of the tumors transformed themselves into an angiogenesis-dependent phenotype. This process was characterized by a reduction in stem cell markers, downregulation of proinvasive genes, and upregulation of angiogenesis signaling genes. The angiogenesis-independent tumor growth and the uncoupling of invasion and angiogenesis point at 2 independent mechanisms that drive glioblastoma progression (12,13).
In the current work, tissue specimens from glioblastoma-A, showing a stable angiogenic phenotype over multiple passages, and from glioblastoma-B, showing a stable invasive phenotype over multiple passages, were used to investigate whether clinically relevant imaging parameters (18F-FDG, 11C-methyl-l-methionine [11C-MET], and 3′-deoxy-3′-18F-fluorothymidine [18F-FLT]) PET; and T2-weighted, contrast-enhanced T1-weighted, and diffusion-weighted-MRI) may be able to distinguish the 2 models noninvasively and how noninvasive imaging parameters correspond to immunohistochemical markers targeting proliferation, invasion, and angiogenesis. We demonstrate that for the angiogenic phenotype, noninvasive assessment of tumor activity corresponds well to immunohistochemical markers. In contrast, infiltrative glioblastoma growth is difficult to noninvasively follow in the absence of microvascular proliferation and blood–brain barrier (BBB) breakdown by existing imaging techniques.
MATERIALS AND METHODS
Tissue Culture of Primary Glioblastoma Spheroids
Tissue specimens from 2 primary human glioblastomas (glioblastoma-A, patient P3 and glioblastoma-B, patient P8) serially passaged in nude rats were taken from viable tumor areas (12,13). Material from glioblastoma-A, which showed a stable angiogenic phenotype over multiple passages, was taken from passage number 20. Material from glioblastoma-B, which showed a stable invasive phenotype over multiple passages, was taken from passage 17. Tissue samples were minced into approximately 0.5-mm fragments and placed into 80-cm2 tissue culture flasks (Nunc) coated with 0.75% agar (Difco). Spheroids were maintained in a standard tissue culture incubator with 5% CO2 and 100% relative humidity at 37°C. Spheroids with diameters between 400 and 600 μm were selected for intracerebral implantation as previously described (14).
Animal Experiments
All animal procedures were in accordance with the Norwegian and German Laws for Animal Protection and were approved by the local animal care committees. Nude rats were housed at constant temperature (23°C) and relative humidity (40%), under a regular light–dark schedule. Food and water were freely available. Intracranial implantation of glioblastoma spheroids was performed as previously described (15).
Sequential PET and MRI were performed on each rat 3, 4, 5, and 6 wk after spheroid implantation for the rat model of angiogenic glioblastoma (glioblastoma-A) and 4 and 6 wk after spheroid implantation for the rats model of infiltrative glioblastoma (glioblastoma-B).
The imaging scans were organized as follows: a first batch of 3 rats transplanted with glioblastoma-A and 3 rats transplanted with glioblastoma-B was imaged using a microPET R4 scanner (Concord Microsystems, Inc.) and a 7.0-T Biospec small-animal MRI scanner (Bruker BioSpin). A second batch of 3 rats injected with glioblastoma-A and 3 rats injected with glioblastoma-B was imaged using a microPET Focus 220 (Siemens) and the same 7.0-T Biospec. All imaging sessions for each batch of experimental animals were performed within 4 d as follows: 11C-MET PET either on Tuesday or Thursday, 18F-FDG PET on Tuesday (for rats receiving 11C-MET and 18F-FDG on Tuesday, a delay of 3 h was allowed between 11C-MET and 18F-FDG injection), 18F-FLT PET on Wednesday, and MRI on Friday. After the last imaging scan, rats were sacrificed and perfused with paraformaldehyde (PFA 4%), and the brains were taken for immunohistochemical analyses. Additional rats were implanted with spheroids and sacrificed at an early time point of disease development.
PET
Rats were anesthetized with isoflurane (DeltaSelect) vaporized in a mix of O2 and N2O (1:2). Isoflurane was used at 3.0% for induction and at 1.0%–2.0% for maintenance. Body temperature was measured with a rectal probe and maintained at 37°C. Rats were imaged using a microPET R4 or a microPET Focus 220. Follow-up images in individual animals were obtained on the same PET scanner.
18F-FDG, 11C-MET, and 18F-FLT synthesis was performed as described previously (16–18). Rats were kept fasting 15 h before 18F-FDG injection. No-carrier-added 18F-FDG was injected intravenously (tail vein) with a dose of 15 MBq per rat. Images were acquired 30–60 min after tracer injection. No-carrier-added 11C-MET was injected intravenously, with a dose of 30 MBq per rat. Images were acquired 20–50 min after tracer injection. No-carrier-added 18F-FLT was administered intravenously, with a dose of 15 MBq per rat, and images were acquired 60–90 min after tracer injection. Every scan was followed by a 10-min transmission scan using a 57Co source to correct for attenuation.
MRI
Rats were anesthetized with isoflurane (induction, 3.0%; maintenance, 1.0%–2.0%) vaporized in a mix of O2 and N2O (1:2). Body temperature was measured with a rectal probe and maintained at 37°C. MRI experiments were conducted on a 7.0-T Biospec with 20-cm-wide actively shielded gradient coils (200 mT/m). Radiofrequency transmission was achieved with home-built Helmholtz coils (12-cm diameter); signal was detected using a 2.2-cm surface coil, positioned over the head of the animal.
T2-weighted images were acquired using a multislice multiecho spin echo sequence with the following parameters: field of view, 1.67 × 1.67 cm; image matrix, 128 × 128 (isotropic in-plane resolution of 130 μm); 30 consecutive slices of 1-mm thickness; echo time (TE), 13.5 ms; repetition time (TR), 5,000 ms; and number of echoes, 10.
T1-weighted scans were obtained before and 20 min after intraperitoneal injection of 2.0 μmol of gadolinium-diethylenetriamine pentaacetic acid per gram (Magnevist; Schering). Images were acquired using a multigradient echo sequence with the following parameters: field of view, 1.67 × 1.67 cm; image matrix, 128 × 128 (isotropic in-plane resolution of 130 μm); 12 consecutive slices of 1-mm thickness; TE, 9.5 ms; TR, 350 ms; flip angle, 60°; and number of echoes, 1.
Apparent diffusion coefficient (ADC) maps were acquired with the following parameters: field of view, 1.67 × 1.67 cm; image matrix, 128 × 128 (isotropic in-plane resolution of 130 μm); 6 consecutive slices of 1-mm thickness; TE, 31.0 ms; TR, 3,000 ms; flip angle, 90°; and b value, 0, 300, and 850 s/mm2 in each direction.
Data Reconstruction and Analysis
PET data were reconstructed using 2-dimensional filtered backprojection with a ramp filter and corrected for photon attenuation. PET images were analyzed using VINCI software (http://www.nf.mpg.de/vinci3/) (19). MR images were processed using Paravision 3.2 (Bruker BioSpin) or ImageJ (Rasband WS; National Institutes of Health, http://rsb.info.nih.gov/ij). Coregistration of PET and MR image parameters was performed using the VINCI software (19). A volume-of-interest approach was used to determine radiotracer uptake and to determine regional values for the maximal percentage injected dose per cubed centimeter (%ID/cm3) and tumor-to-background (T/B) ratios. Reference regions were mirror regions of the tumors drawn in the contralateral brain.
Immunostaining of Paraffin Sections
Paraffin-embedded formalin-fixed tissue sections of 5 μm from rat brains were placed in a xylene bath for 2 × 3 min, absolute ethanol for 2 × 3 min, 96% ethanol for 2 × 2 min, and finally in distilled water for 30 s. Sections were boiled in citrate buffer (pH 6; 20 min; nestin) or treated with proteinase K (Dako) at room temperature for 5 min (von Willebrand factor, Ki67). Sections were then treated with 5% serum-blocking solution for 10 min, and the primary antibody was incubated overnight at 4°C, washed 4 times, incubated for 1 h with a biotinylated secondary antibody (Vector), washed 4 times, incubated with avidin–biotin complex (ABC-complex; Vector) for 30 min, and finally treated with 3,3′-diaminobenzidine for 1–5 min.
The primary antibodies used were an antihuman monoclonal nestin antibody diluted 1:200 (Millipore), a monoclonal anti–von Willebrand factor diluted 1:500 (Dako), and antihuman Ki67 monoclonal antibody diluted 1:75 (clone MIB1; Dako). The hematoxylin and eosin and immunohistochemical stainings were analyzed on a light microscope (Nikon).
Statistical Analysis
Mean ± SD of %ID/cm3 and T/B ratios of radiotracer uptake were calculated. One- and 2-way ANOVA tests were performed using SigmaPlot 11.0 (Systat Software Inc.) to assess significant differences between 2 or more groups.
RESULTS
Imaging Proliferation and Metabolism of Angiogenic Glioblastoma
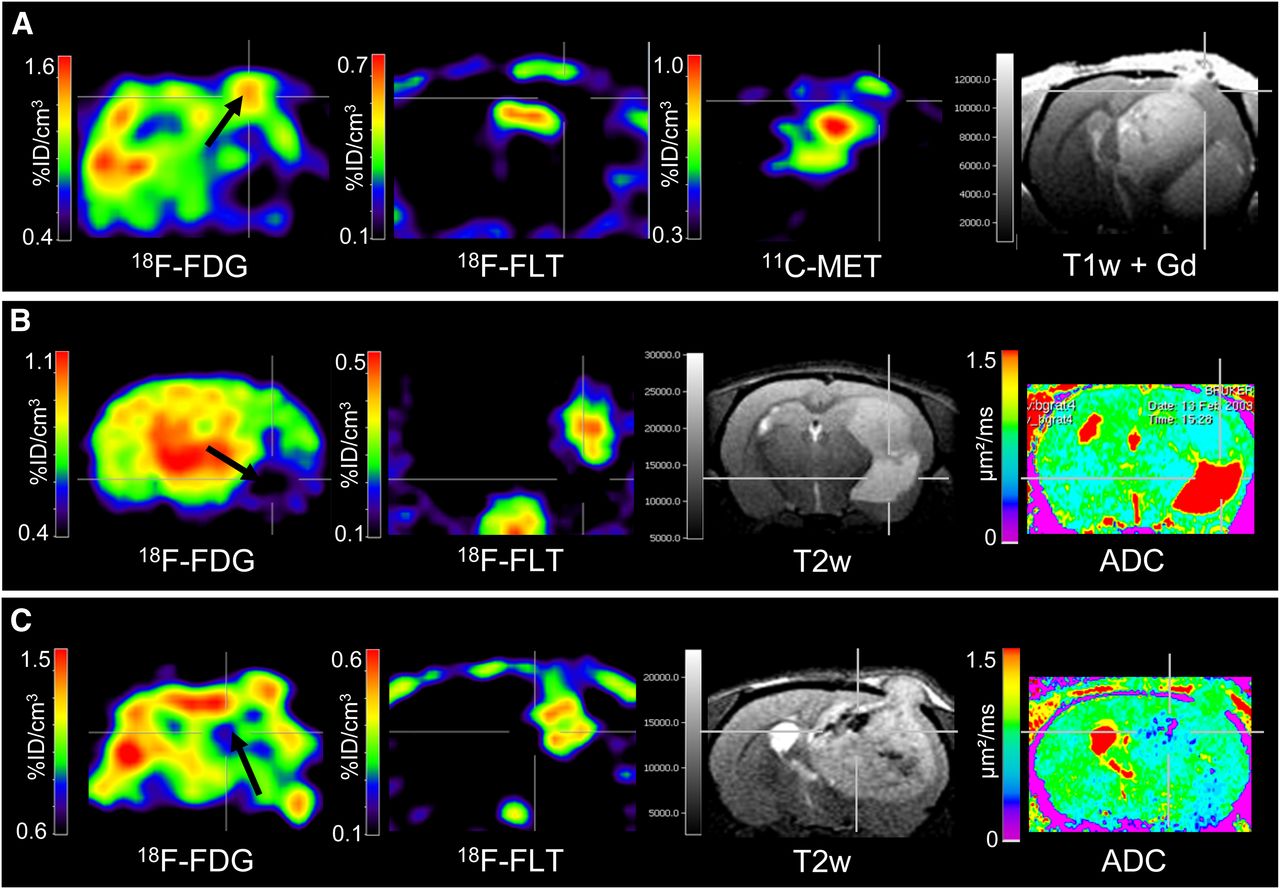
Nude rats (n = 6) were implanted with spheroids derived from the human glioblastoma-A. The xenograft and the patient biopsy showed a similar genetic profile (Supplemental Fig. 1; supplemental materials are available online only at http://jnm.snmjournals.org). Development of the glioblastoma was assessed by small-animal PET and small-animal MRI (Fig. 1). At week 4, the glioblastoma was characterized by a reduced 18F-FDG uptake in the tumor area, compared with the contralateral healthy hemisphere. 18F-FLT and 11C-MET PET showed uptake in the areas of spheroid implantation, with a mean (±SD) maximum uptake of 0.14 ± 0.07 and 0.54 ± 0.07 %ID/cm3, corresponding to mean T/B ratios of 2.4 ± 0.5 and 1.9 ± 0.2, respectively (Fig. 2). On MR images, glioblastoma were discernible on T2- and T1-weighted scans, with moderate gadolinium contrast enhancement and no alteration of diffusion (Fig. 1A). At week 6, 18F-FDG uptake was reduced in the entire ipsilateral hemisphere but was heterogeneous (Fig. 1B, black arrow). At this stage, 18F-FLT and 11C-MET uptake were significantly increased to 0.65 ± 0.19 and 0.89 ± 0.24 %ID/cm3, corresponding to T/B ratios of 5.9 ± 1.2 and 2.8 ± 0.3, respectively (Fig. 2). T1-weighted MRI revealed strong gadolinium contrast enhancement in some parts of the tumors. Moreover, diffusivity was reduced as depicted by the ADC map corresponding to a high cellular density of the tumors. Histology revealed circumscribed, angiogenic tumors, as shown in sections immunostained with human-specific nestin, used as a tumor marker because of its abundant expression in the xenografts (Fig. 3). In correspondence to 18F-FLT and 11C-MET PET, histology revealed a highly proliferative tumor (Ki67, 37.0%), with typical hallmarks of malignant growth including microvascular proliferation and necrosis. The presence of angiogenesis was supported by Western blotting, showing high levels of HIF1A and the presence of vascular endothelial growth factor expression (Supplemental Fig. 2).

(A) At week 4, tumor with angiogenic phenotype was characterized by decreased 18F-FDG uptake and by increased 18F-FLT and 11C-MET uptake. (B) At week 6, 18F-FDG uptake was reduced in the entire ipsilateral hemisphere but was heterogeneous (black arrow), whereas 18F-FLT and 11C-MET uptake increased substantially. Tumors were discernible on T2- and T1-weighted MRI scans before injection of gadolinium contrast agent and were enhanced after injection. Reduced ADC in tumor, compared with contralateral brain, revealed dense tumors. Nestin staining of brain sections confirmed presence of tumor. Gd = gadolinium; T1w = T1-weighted; T2w = T2-weighted.

Maximum 18F-FDG (A), 18F-FLT (B), and 11C-MET (C) accumulation in tumor and contralateral brain was quantified, and mean values of maximal tumor uptake (T/B ratios and %ID/cm3) were calculated for each group. Data are plotted as boxes, showing median values (continuous line), 25% and 75% percentiles (extremities of boxes), and means (dash–dot line, numeric values). Two-way ANOVA tests were used to analyze differences between 2 phenotypes and over time.

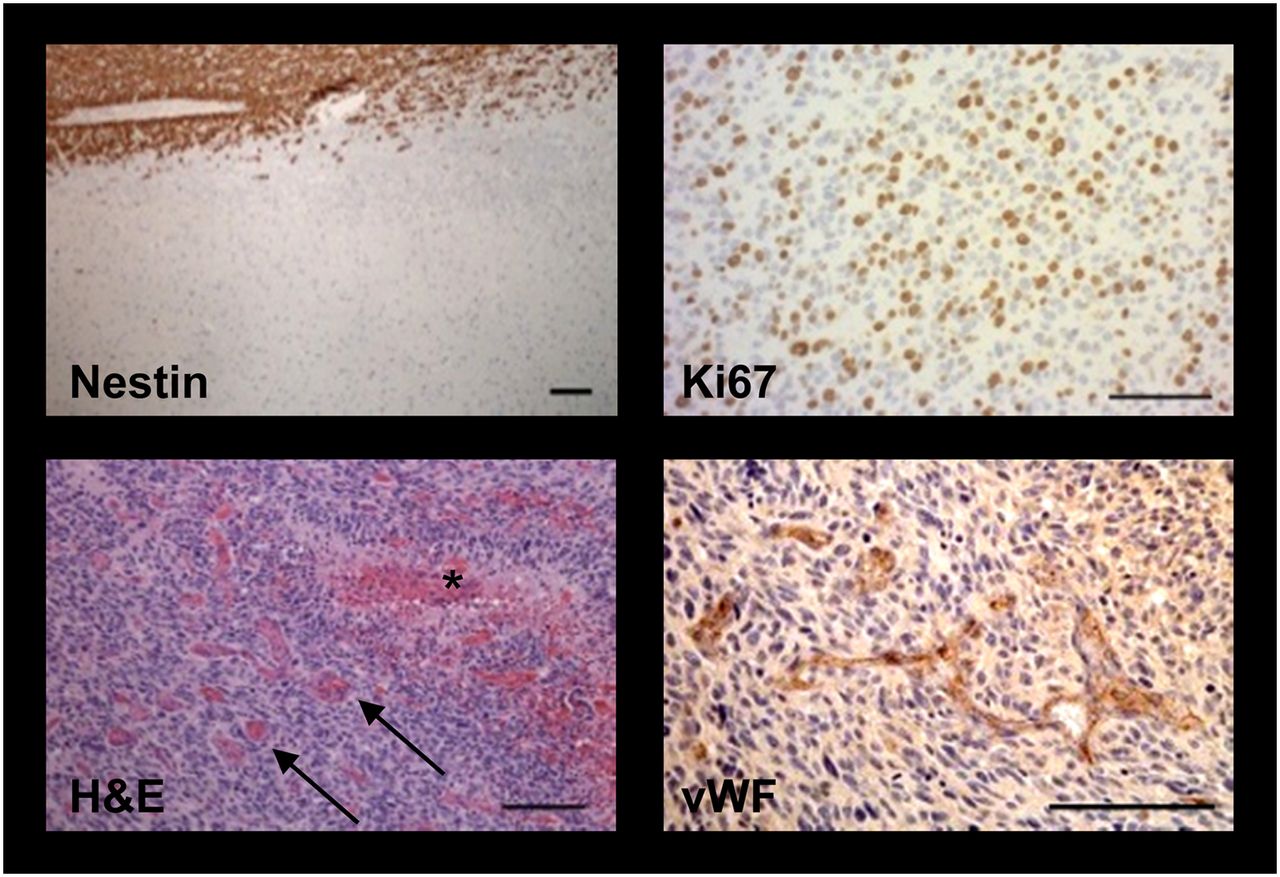
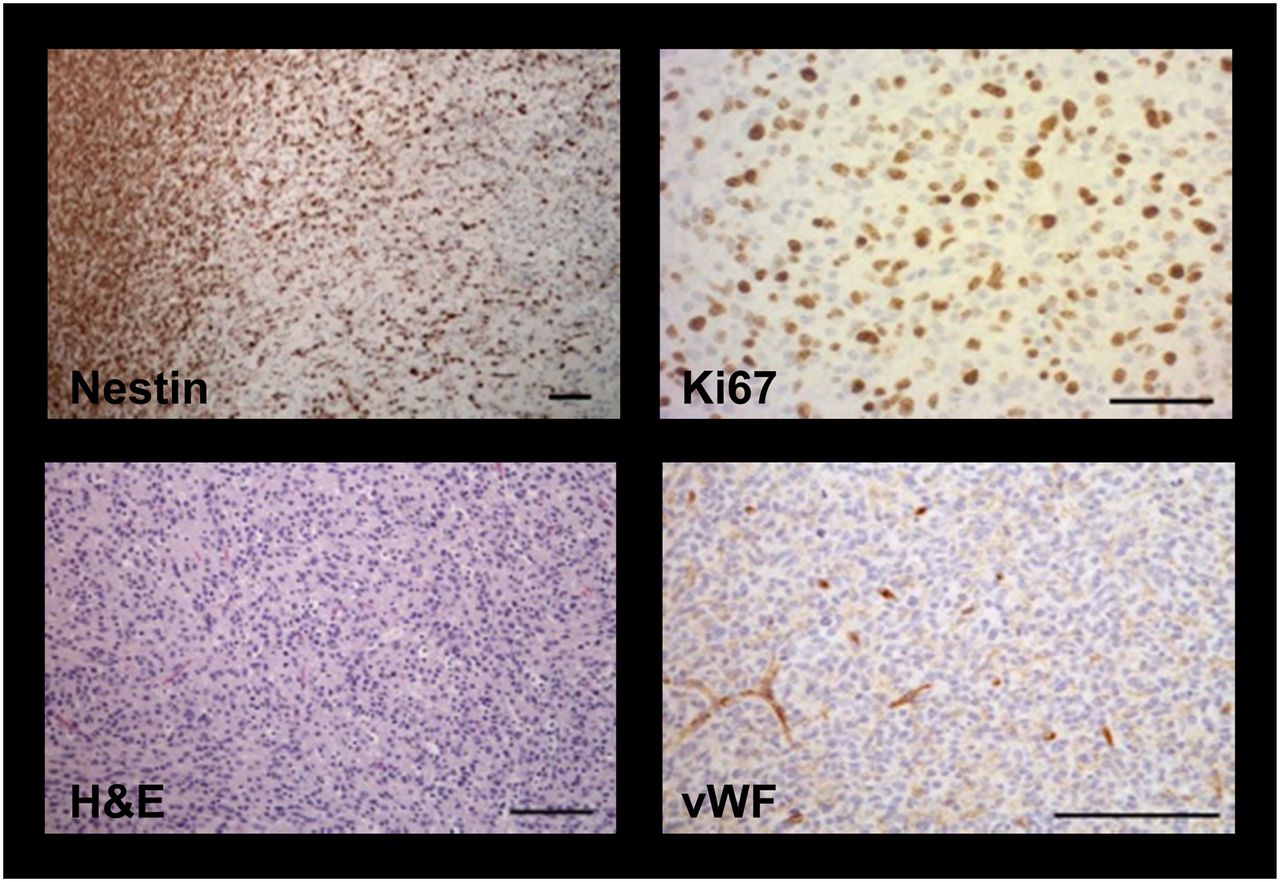
Nestin staining revealed circumscribed tumors with infiltration of single cells into brain parenchyma. Ki67 immunochemistry showed highly proliferative tumor cells. Hematoxylin and eosin (H&E)–stained sections showed angiogenic vessels (arrows) and necrotic areas (asterisk). von Willebrand factor (vWF) immunostaining depicted microvascular proliferation. Scale bars = 100 μm.
Depiction of Tumor Heterogeneity with PET and MRI
Combined PET and MRI revealed spatial heterogeneity of the imaging parameters within the angiogenic glioblastoma at week 6 (Fig. 4). Besides a global decrease of 18F-FDG uptake in the ipsilateral hemisphere, focal increased 18F-FDG uptake appeared at various tumor sites. This high metabolic activity was partly related to high proliferative activity as measured by high 18F-FLT uptake (Fig. 1B, black arrow) but also occurred in areas of low 18F-FLT uptake (Fig. 4A, black arrow). Signs of secondary tumor mass effects, such as the presence of cysts or ventricular enlargement, were observed as characterized by the absence of 18F-FDG and 18F-FLT uptake and increased diffusion coefficients (Fig. 4B, black arrow). Necrotic areas inside the tumor were also observed and depicted by the absence of 18F-FDG, 18F-FLT, and 11C-MET uptake and low T2-weighted signal intensity (Fig. 4C, black arrow).

Different imaging modalities give complementary information on extent and biologic activity of tumors from angiogenic phenotype. (A) 18F-FDG uptake is decreased in ipsilateral hemisphere. However, focal increase of 18F-FDG uptake could be observed (black arrow), and maximum of 18F-FDG uptake was not always correlated with maximum of 18F-FLT and 11C-MET uptake. (B) Low 18F-FDG and 18F-FLT uptake correlate with high T2-weighted signal intensity and increased ADC (black arrow) as indication of cyst or ventricular enlargement. (C) Other tumor regions were characterized by low 18F-FDG and 18F-FLT uptake correlating with low T2-weighted signal intensity and diminished ADC (black arrow), revealing necrotic areas inside tumor. Gd = gadolinium; T1w = T1-weighted; T2w = T2-weighted.
Dynamic Evolution of 18F-FLT and 11C-MET Tumor Uptake
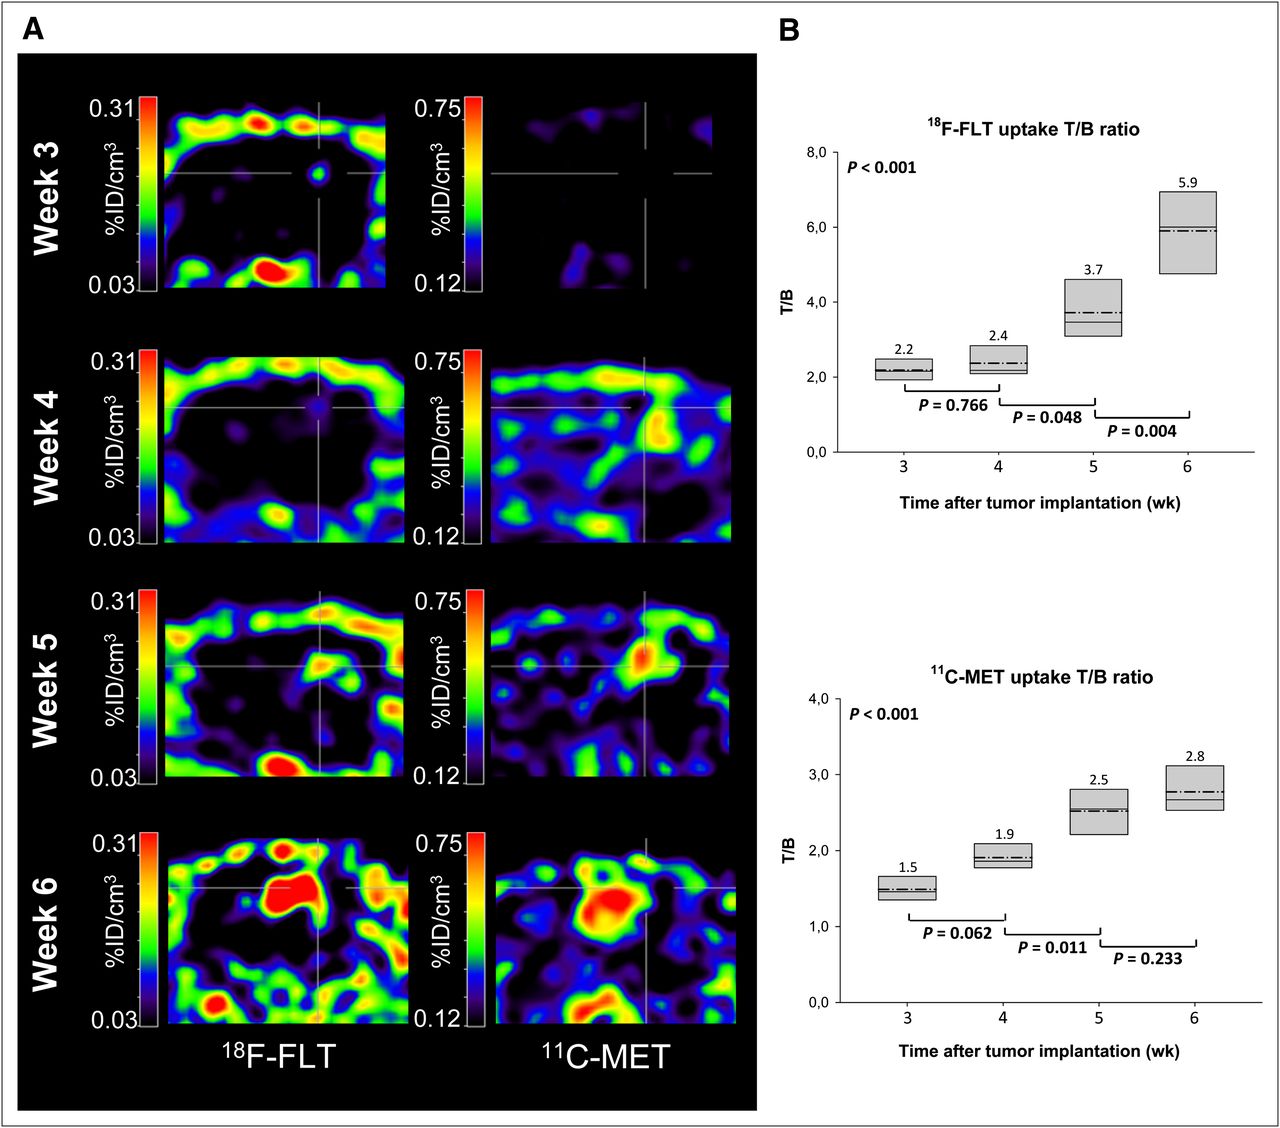
To better characterize the dynamics of tumor development in the case of the angiogenic phenotype, additional small-animal PET scans were obtained at weeks 3 and 5 for this model (Fig. 5A). At week 3 after spheroid implantation, limited 18F-FLT and 11C-MET accumulation was observed, with maximal T/B uptake ratios of 2.2 ± 0.3 and 1.5 ± 0.2, respectively (Fig. 5B). At week 4, the 18F-FLT uptake only slightly increased (maximal T/B uptake ratio of 2.4 ± 0.5; 9.1% increase) whereas 11C-MET uptake increased substantially in comparison to week 3 (maximal T/B uptake ratio of 1.9 ± 0.2; 26.7% increase). A week later, 18F-FLT T/B uptake ratio also increased significantly to reach 3.7 ± 0.8 (54.2% increase), which was paralleled with a further increase of 11C-MET accumulation (T/B ratio of 2.5 ± 0.3; 31.6% increase). At week 6, uptake of both radiotracers further increased as measured not only by T/B ratios but also by tumor size, with T/B ratios reaching 5.9 ± 1.2 (18F-FLT) and 2.8 ± 0.3 (11C-MET).

(A) 18F-FLT and 11C-MET PET were performed at 3, 4, 5, and 6 wk after spheroid implantation, and images were coregistered. (B) Radiotracer T/B ratios were quantified over time. Data are plotted as boxes, showing median values (continuous line), 25% and 75% percentiles (extremities of boxes), and means (dash–dot line, numeric values). At week 3, only limited 18F-FLT and 11C-MET accumulation was observed. At week 4, 11C-MET uptake was substantially increased, whereas 18F-FLT uptake was similar to that at week 3. At week 5, 18F-FLT uptake was also substantially increased. One-way ANOVA tests were used to analyze differences over time.
Absence of Detection of Angiogenesis-Independent Infiltrative Glioblastoma Development
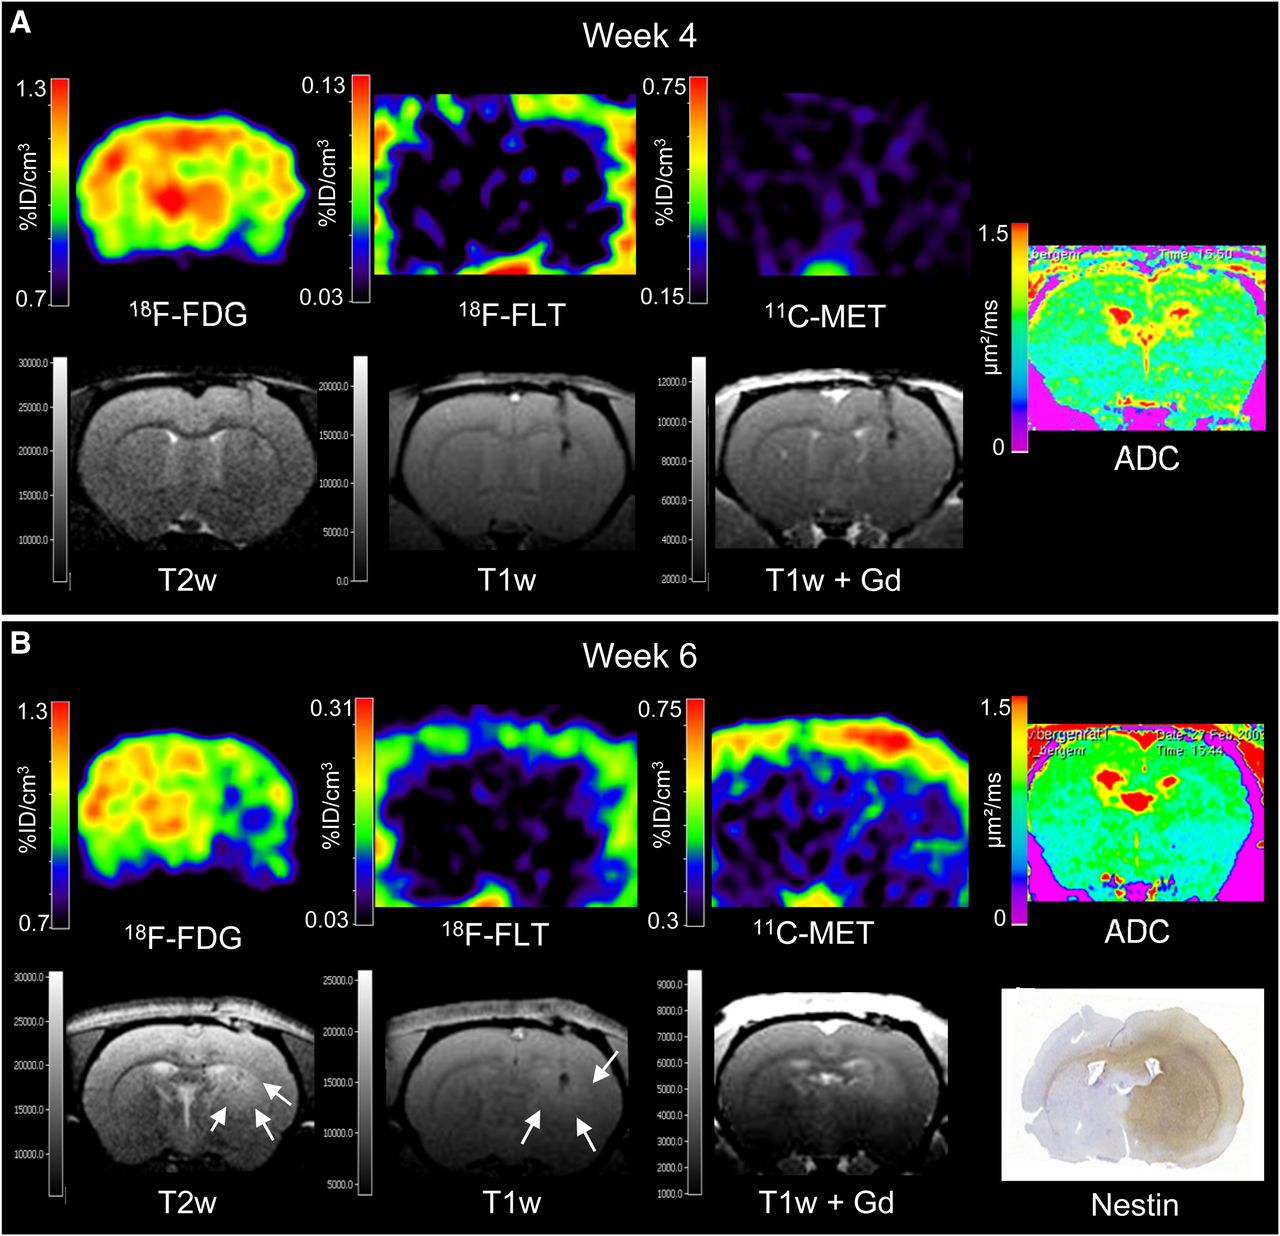
Nude rats (n = 6) were implanted with spheroids derived from the primary human glioblastoma-B. The xenograft and the patient biopsy showed a similar genetic profile (Supplemental Fig. 1). Glioblastoma development in vivo was imaged at 4 and 6 wk after tumor implantation (Fig. 6). At week 4, tumor development was revealed only by a slight decrease of 18F-FDG uptake (Fig. 6A). 18F-FLT and 11C-MET PET and MRI failed to detect this early stage of disease. Two weeks later, 18F-FDG uptake was decreased in the ipsilateral, compared with the contralateral, hemisphere (Fig. 6B), but differences were not found to be significant (Fig. 2). Only minor 18F-FLT and 11C-MET tumor uptake could be observed (maximal T/B uptake ratio of 1.4 ± 0.2 and of 1.8 ± 0.5, respectively). Differences between tracer accumulation (18F-FDG, 18F-FLT, and 11C-MET) at weeks 4 and 6 were not significant; however, the differences in the uptake of PET tracers between the 2 phenotypes were significant (Fig. 2). The extent of tumor infiltration was observed by T2- and T1-weighted MRI, with contrast being low and gadolinium enhancement absent. Histology and immunohistochemical analysis at week 6 (Fig. 7) revealed extended infiltrative tumors, with diffuse invasion into the brain parenchyma. Ki67 staining indicated a relatively high fraction of active tumor cell division (46.5%). The tumor blood vessels had a normal, thin endothelium, and no microvascular proliferation was observed. The absence of angiogenesis was supported by Western blotting, showing low levels of HIF1A and absence of vascular endothelial growth factor expression (Supplemental Fig. 2).

PET and MRI fail to depict tumor proliferation and metabolism of infiltrative phenotype. (A) Tumor development at 4 wk after spheroid implantation was indicated only by decreased 18F-FDG uptake. (B) At week 6, low 18F-FDG uptake revealed presence of tumor. Only minor 18F-FLT and 11C-MET uptake was observed. Extent of infiltrative tumors was observed by T2- and T1-weighted MRI (white arrows), but contrast was low and did not enhance after gadolinium injection. Nestin staining of brain sections confirmed presence of tumor. Gd = gadolinium; T1w = T1-weighted; T2w = T2-weighted.

Nestin staining revealed highly invasive, nonangiogenic tumors. Ki67 immunochemistry showed highly proliferative tumor cells. Hematoxylin and eosin (H&E)– and von Willebrand factor (vWF)–immunostained sections showed solid tumor mass, with normal vasculature. Scale bars = 100 μm.
DISCUSSION
Our results on 2 histologically different human glioblastoma models growing in nude rats revealed that small-animal PET in conjunction with small-animal MRI is able to depict the spatial and temporal dynamics of glioblastoma growth in vivo only of the angiogenic phenotype and not of the infiltrative angiogenesis-independent phenotype. In the angiogenic phenotype, in good correspondence with histology and immunohistochemistry, multitracer small-animal PET together with small-animal MRI is able to distinguish proliferating and angiogenic tumor areas from necrotic tumor parts and secondary mass effects, such as impaired cerebrospinal fluid circulation. In the infiltrative phenotype, 18F-FLT and 11C-MET PET fail to support clear tumor visualization, despite active tumor proliferation and invasion as depicted by immunohistochemistry, and only reduced 18F-FDG metabolism of the affected brain hemisphere may indicate tumor development.
For the development of more efficient antiglioblastoma treatments, it is crucial to better understand the molecular processes of disease progression. Improved glioblastoma models and tools to study their growth characteristics in vivo may be supportive for these attempts. The human spheroid glioblastoma model developed by Sakariassen et al. has raised particular interest because it demonstrates that tumor cells driving tumor progression can modulate their phenotype in a reversible manner to adapt to the brain’s microenvironment (12,13).
The hypothesis for our work was that the heterogeneity of the angiogenic versus the infiltrative phenotype should be distinguishable by clinically available multitracer PET and MRI tools. 18F-FDG PET showed decreased uptake in the tumor, compared with contralateral healthy brain, in both the angiogenic and the infiltrative phenotype. This decrease could be because of secondary inactivation of neuronal tissue, which is known to be a prognostically negative factor in the clinical application (20). The phenomenon, known as the Warburg effect, described the increased glucose consumption in actively growing tumors (21). 18F-FDG uptake is, however, a complex mechanism reflecting both glucose transport and consumption and providing important indications concerning the biologic status of the tumor (22). For patients with gliomas, increased intratumoral glucose consumption is linked to tumor grade, cell density, biologic aggressiveness, and survival of patients. However, tumor detection by 18F-FDG is hampered by high and variable background uptake in the normal brain, influenced by diverse factors such as physiologic cortical activity or type of anesthetic and leading to low T/B ratios. Therefore, glioma grading with 18F-FDG is difficult (23–26). Tsuchida et al. reported a mean T/B ratio of 0.98 and no statistically significant difference between high- and low-grade gliomas (26). Pauleit et al. described T/B ratios greater than 1 for low-grade gliomas and high-grade gliomas, with a significant overlap and no separation of histologic grade, using background regions placed into the white matter—an area in which 18F-FDG uptake is low (25). In our rat model, because of the size of the white matter area in rats, compared with the resolution of the PET scanner, reference regions were always mirror regions covering a mixture of gray and white matter of contralateral brain. The influence of isoflurane as the anesthetic on our results should also be investigated in the future.
For the angiogenic phenotype, signs of high cell proliferation were observed using 18F-FLT PET. 18F-FLT is phosphorylated by the cell cycle–dependent thymidine kinase 1, and 18F-FLT T/B ratio has been shown in previous studies to correlate with Ki67 expression in patients with glioblastoma presenting signs of breakdown of the blood–brain barrier (17,27,28). 18F-FLT PET is of particular interest in brain tumor research because there is only little accumulation in the normal brain, resulting in high T/B ratios. However, low 18F-FLT uptake in the healthy brain also reflects the limited transport of thymidine analogs across the intact BBB (28,29). 18F-FLT PET is inappropriate for the imaging of proliferative activity in nonenhancing infiltrative gliomas, because nucleosides and nucleoside analogs do not cross the BBB. This can be a reason, together with low cell concentrations revealed by the ADC map, for the absence of 18F-FLT uptake despite the presence of tumor proliferation as revealed by Ki67 staining in this model. Recently, Rueger et al. showed that proliferation of stem cells in rat models of cerebral ischemia may be quantifiable by 18F-FLT PET (30). The difference in injected 18F-FLT activity (37.0–81.4 MBq vs. 15 MBq in our study) could explain why proliferating stem cells can be detected despite an intact BBB. From our point of view, the role of 18F-FLT for the depiction of stem and tumor cell proliferation in areas in which the BBB is intact has still to be clarified in future studies.
Amino acid tracers such as 11C-MET and O-(2-18F-fluoroethyl)-l-tyrosine (18F-FET) are able to detect brain tumors with high sensitivity and specificity (31,32). In vivo 11C-MET and 18F-FET uptake is driven by amino acid transport (33). 11C-MET uptake has been shown to correlate with L-type amino acid transporter expression in gliomas (34). In this study, Okubo et al. showed in addition that L-type amino acid transporter expression correlated with microvessel density and formation. This study confirmed the observation of Kracht et al. that a correlation exists between 11C-MET uptake in glioma and microvessel density (35) and the study of Stockhammer et al. (36) demonstrating a correlation between 18F-FET uptake and vascular density in nonenhancing gliomas. High 11C-MET uptake was observed relatively early in the angiogenic phenotype (before a change in 18F-FLT uptake and without gadolinium enhancement of T1-weighted images) and may most likely reflect the increased expression of L-type amino acid transporters presumably on endothelial cells of newly formed tumor vessels. The limited ability of 18F-FLT to cross the intact BBB may limit the sensitivity to detect early tumor development and does not allow the question to be answered of whether vascular remodeling as depicted by 11C-MET promotes, accompanies, or follows tumor proliferation as depicted by 18F-FLT. In agreement with the histologic observation of normal vasculature for the infiltrative phenotype, only minor 11C-MET accumulation was observed for the infiltrative model. In a study on patients with low- and high-grade gliomas, Kracht et al. observed accumulation of 11C-MET in infiltrative astrocytomas and in the infiltrative parts of glioblastoma (37). In this study, 11C-MET PET enabled the depiction not only of proliferating tumor areas but also of infiltrating glioma parts at the border of those gliomas, which accumulate 11C-MET. Furthermore, studies on 18F-3,4-dihydroxyphenylalanine suggest that both low- and high-grade brain tumors are well detected by tracers of amino acid metabolism regardless of the integrity of the BBB (38,39). However, in our study the infiltrative phenotype presents normal vasculature, including the absence of breakdown of the BBB but also the absence of microvascular proliferation. Therefore, the low 11C-MET uptake in the infiltrative model may be a consequence of the absence of new vessel formation leading to normal microvessel density.
The study of this model showed that clinically relevant imaging parameters may miss diffusely infiltrative glioblastoma in the absence of vascular remodeling, thus necessitating the development of improved imaging protocols for diffusely infiltrating tumor cells (e.g., the use of markers for activated matrix metalloproteinases (40), the use of 18F-3,4-dihydroxyphenylalanine (38,39), or the use of higher dose of 18F-FLT (30)). As has been detailed by Dhermain et al. (9), MRI is the imaging method of choice for patients with gliomas, for whom additional PET (in conjunction with MRI) may reveal important complementary information with regard to detection of hot spots in low-grade lesions; planning of biopsy, surgery, and radiation; and detection of recurrent tumors (9).
Testing the various types of tumor behavior with implanted spheroids does not take into account the fact that the infiltration results from an interaction between migrating cells and the histologic environment. This environment is obviously extremely different between the natural situation and the rat spheroid model.
CONCLUSION
Similar to the clinical application, multitracer small-animal PET in conjunction with small-animal MRI reveals complementary information on glioma growth and metabolism and, specifically in this study, on proliferative and angiogenic activity of the angiogenic glioblastoma phenotype in good correspondence to immunohistochemical findings (von Willebrand factor, Ki67) and largely fails to depict the diffusely infiltrative phenotype. The model by Sakariassen et al. (12,13) is promising for the preclinical evaluation of new imaging paradigms and of new antiglioma treatment strategies. Moreover, our data support the view of tissue heterogeneity within glioblastomas with angiogenic and infiltrative features, which can be distinguished, at least in part, by noninvasive imaging using PET and MRI.
DISCLOSURE STATEMENT
The costs of publication of this article were defrayed in part by the payment of page charges. Therefore, and solely to indicate this fact, this article is hereby marked “advertisement” in accordance with 18 USC section 1734.
Acknowledgments
This work is supported in part by the BMBF grant MoBiMed, the Joint Translational Research Program on Cancer (DAAD-INCa, PKZ: D/0811485), the FP6 European NoE DiMI (LSHB-CT-2005-512146), CLINIGENE NoE (LSHB-CT-2006-018933), the FP7 EU project HEALTH-F5-2008-201842 (ENCITE), the Norwegian Research Council, the Norwegian Cancer Society, and HelseVest. No other potential conflict of interest relevant to this article was reported.
Footnotes
↵* Contributed equally to this work.
Published online Jun. 11, 2012.
- © 2012 by the Society of Nuclear Medicine, Inc.
REFERENCES
- Received for publication January 9, 2012.
- Accepted for publication March 7, 2012.


Jump to section
Related Articles
Cited By...
- Simultaneous Mapping of Vasculature, Hypoxia, and Proliferation Using Dynamic Susceptibility Contrast MRI, 18F-FMISO PET, and 18F-FLT PET in Relation to Contrast Enhancement in Newly Diagnosed Glioblastoma
- Stratification of 18F-Labeled PET Imaging Agents for the Assessment of Antiangiogenic Therapy Responses in Tumors
- Mammary Cancer Bone Metastasis Follow-up Using Multimodal Small-Animal MR and PET Imaging
- PET Findings of Intramedullary Tumors of the Spinal Cord Using [18F] FDG and [11C] Methionine