


Abstract
Despite tremendous progress in the management of breast cancer, the survival rate of this disease is still correlated with the development of metastases—most notably, those of the bone. Diagnosis of bone metastasis requires a combination of multiple imaging modalities. MR imaging remains the best modality for soft-tissue visualization, allowing for the distinction between benign and malignant lesions in many cases. On the other hand, PET imaging is frequently more specific at detecting bone metastasis by measuring the accumulation of radiotracers, such as 18F-sodium fluoride (18F-NaF) and 18F-FDG. Thus, the main purpose of this study was to longitudinally monitor bone tumor progression using PET/MR image coregistration to improve noninvasive imaging–assisted diagnoses. Methods: After surgical implantation of mammary MRMT-1 cells in a rat femur, we performed minimally invasive imaging procedures at different time points throughout tumor development. The procedure consisted of sequential coregistered MR and PET image acquisition, using gadolinium-diethylenetriaminepentaacetic acid (DTPA) as a contrast agent for MR imaging and 18F-FDG, 11C-methionine, and 18F-NaF as molecular tracers for PET imaging. The animals were then euthanized, and complementary radiologic (micro-CT scans) and histologic analyses were performed. Results: In this preclinical study, we demonstrated that coregistered MR and PET images provide helpful information in a rat mammary–derived bone cancer model. First, MR imaging provided a high-definition anatomic resolution that made the localization of bone resorption and tumor extension detectable between days 9 and 18 after the injection of cancer cells in the medullary channel of the femur. Indeed, the calculation of mean standardized uptake value (SUVmean) and maximal SUV (SUVmax) in bone and soft-tissue regions, as defined from the gadolinium-DTPA contrast-enhanced MR images, showed 18F-NaF uptake modifications and increased 18F-FDG or 11C-methionine uptake in the bone and surrounding soft tissues. 18F-FDG and 11C-methionine were compared in terms of the magnitude of change in their uptake and variability. We observed that 11C-methionine SUVmean variations in the tumor were more important than those of 18F-FDG. We also found fewer interindividual variations using SUVmean as a quantitative parameter than SUVmax. Conclusion: This preclinical evaluation demonstrated that a PET/MR image coregistration protocol provided a powerful tool to evaluate bone tumor progression in a rat model of bone metastasis and that this protocol could be translated to improve the clinical outcome for metastatic breast cancer management.
Despite advances in the understanding of breast cancer biology, the prognosis and survival rate of breast cancer patients are still correlated with the ability of the tumor to invade distant organ sites (1). Indeed, the 5-y mortality rate of metastasis-bearing cancer patients is close to 70%. Therefore, early detection of bone metastases and evaluation of early tumor response to chemotherapy remain challenging for researchers and clinicians (2). To date, staging of metastatic breast cancer is performed with minimally invasive imaging modalities differing in terms of their sensitivity and specificity, such as bone scintigraphy, CT, MR imaging, and PET (3). Thus, the use of complementary imaging techniques is gaining popularity in clinical practice (4).
Bone scintigraphy is still preferred for the detection of bone metastases (5). However, poor sensitivity for multiple bone metastases, especially in the spine, often makes confirmation by anatomic, more sensitive, imaging modalities, such as CT or MR imaging, necessary (6). CT is preferred for structural bone imaging, whereas MR imaging displays a better contrast resolution than CT for soft-tissue and spinal cord visualization and shows greater specificity overall (7). PET also displays excellent specificity and sensitivity (8). Radiotracers such as 18F-sodium fluoride (18F-NaF), 18F-FDG, and 11C-methionine are powerful tools to explore both bone and tumor metabolism. 18F-NaF has proven to be efficient for the characterization of osteolytic and osteoblastic lesions in preclinical models (9,10). It is now widely accepted as a marker for bone turnover modifications in skeletal tumors (11). 18F-FDG and 11C-methionine are radiotracers used to detect and determine the extent of malignancies by measuring changes in glucose and protein metabolism, respectively (8,12). To date, 18F-FDG has been used extensively to characterize tumor progression in animal models (13). However, a few studies have investigated the use of 18F-FDG in mammary-derived bone metastasis (9,10). Thus, it is important to acquire more data from animal models of breast cancer metastasizing to bone. The use of 11C-methionine has been mainly validated in brain tumors. In these studies, the investigators took advantage of the low background level for the detection of insidious tumors in which glucose uptake was low. However, the utility of radiolabeled amino acids has not been evaluated in animal models of bone metastasis. Despite its high sensitivity, PET imaging provides limited anatomic information whereas MR imaging provides better soft-tissue contrast than CT. PET/MR image coregistration may thus represent a better option for detecting and staging tumors in both animal and human studies (14).
The Response Evaluation Criteria in Solid Tumors define bone tumor response by the changes in lesion size only. Moreover, this response is normally assessed at the end of the treatment protocol. Metabolic imaging may represent one avenue to assess treatment efficiency throughout the course of its application, although further validation is necessary in animal models.
We previously showed that gadolinium-enhanced T1-weighted MR imaging and 18F-NaF PET are suitable for the evaluation of metastatic burden in a rat model of mammary-derived bone tumors (15). These analyses combined the following information: the state of tissue perfusion, high-resolution images of the lesion, and bone metabolism in cancer-bearing bones. In the present study, we explored the ability of PET/MR image coregistration using glucose (18F-FDG), protein (11C-methionine), and bone (18F-NaF) metabolism markers to characterize our model. To our knowledge, this is one of the first studies to compare several PET tracers with coregistered MR images in the context of bone metastasis. Coregistration between these different modalities allows for a precise overlapping of both bone and metastasis metabolism on a high-resolution anatomic template and perfusion data provided by T1-weighted, contrast-enhanced MR imaging. Herein, we present a comprehensive assessment of the bone metastasis process in rats using a multimodality imaging approach. We also provide methodology for the longitudinal monitoring and quantification of tumor progression in the rat femur.
MATERIALS AND METHODS
Animals
Adult male Sprague–Dawley rats (weight, 200–225 g; Charles River Laboratories) were maintained on a 12-h light–dark cycle with access to food and water ad libitum. Rats were acclimated to the animal facility for 4 d before surgery. Four to 6 animals were monitored in each group. The animals used for histology were previously imaged with PET/MR and CT. Sham surgeries were performed using the same protocol except that Hank’s balanced salt solution was injected instead of cancer cells. The contralateral paw was used as the reference point for analyses and comparisons, because it was not different from the sham-operated bone. All animal-related procedures were approved by the Ethical Committee for Animal Care and Experimentation of the Université de Sherbrooke and were performed according to the regulations of the Canadian Council on Animal Care.
Inoculation of Cancer Cells
Mammary rat metastasis tumor (MRMT-1) cells (carcinoma) were kindly provided by the Cell Resource Center for Biomedical Research Institute of Development, Aging and Cancer (Tohoku University). Mammary carcinoma cells were surgically implanted in the femur as described by Doré-Savard et al. (15). Briefly, 30,000 cells resuspended in 20 μL of Hank’s balanced salt solution (cancer group) were implanted in the medullar cavity of the rat femur. The injection site was sealed with dental amalgam (Prodigy A3; Kerr).
Histologic Procedures
After the last PET/MR imaging session, rats were deeply anesthetized with 5% isoflurane and transcardially perfused with 4% paraformaldehyde in phosphate buffer (0.1 M, pH 7.4). Bone specimens were removed and placed in a histologic cassette and postfixed overnight at 4°C in neutral formalin buffer (10%). Along with hematoxylin and eosine staining, Ki67 immunolabeling was performed on 3-µm bone sections. For negative controls, the primary antibody was omitted. All regions shown on the histologic slices in Figure 1 are located in the metaphysis, anterior to the growth plate in bone regions where resorption was important. Further details on histologic methods are provided in the supplemental materials (available online only at http://jnm.snmjournals.org).

Characteristics of mammary-derived bone metastasis model. Bone tumor (implantation site shown by yellow arrow) was monitored on days 15 and 18 after implantation using MR imaging and micro-CT. We first observed contrast enhancement in ipsilateral medullary channel on day 15 (white arrows). Cortical line of bone was partially resorbed on day 15, and tumor had started to spread outside bone (blue arrow). On day 18, extraosseous tumor had grown extensively. Cortical bone line was interrupted on surface of femur (red arrows). On histologic slices, on day 15, tumor invaded metaphysis completely, and Ki67-positive cells were abundant (black arrows). Numerous active osteoblasts were observed on trabecular bone surface (orange arrows). On day 18, tumor cells were less active, according to Ki67 staining, whereas osteoclastic activity was maximal, with several gigantic multinucleated cells (purple arrows). All images were taken in metaphysis, anterior to growth plate (n = 4–6). μCT = micro-CT; H&E = hematoxylin and eosin.
Radiologic Analysis
Micro-CT scans were obtained using a high-resolution scanner (SkyScan-1072; Bruker-microCT) as described by Doré-Savard et al. (15). Additional details on the procedure and the different parameters are provided in the supplemental materials.
MR Imaging
MR imaging studies were conducted at the Centre d’imagerie moléculaire de Sherbrooke with a 210-mm-diameter small-animal 7T scanner (Agilent Technologies Inc.) and a 63-mm-diameter volume radiofrequency coil, as described by Doré-Savard et al. (15). Further details are provided in the supplemental materials. The animals were imaged at day 15 to ascertain the presence of the tumor and at day 18 to perform the analyses.
PET
Immediately after the MR image acquisition, the cradle with the animal was transferred to a PET scanner without interrupting the anesthesia or animal monitoring. PET imaging was performed using a LabPET4 (Gamma Medica) avalanche photodiodes detector-based small-animal PET scanner with a field of view of 110 mm in diameter × 37.5 mm in axial length. The scanner achieves a spatial resolution of 1.35 mm in full width at half maximum and an absolute sensitivity of 1.1% in the central field of view, with a 250- to 650-keV energy window (16). The animals were aligned to have the hind knee joints at the radial and axial center of the scanner field of view, and they received approximately 74 MBq of 11C-methionine, followed by 18.5 MBq of 18F-NaF or 37 MBq of 18F-FDG alone by intravenous injection (200 μL at 500 μL/min). 11C-methionine and 18F-NaF were performed sequentially on the same animals. The second tracer (18F-NaF) was injected approximately 75 min after 11C-methionine (3.7 half-lives). The accumulation of radiotracers in the target tissues was monitored by 30-min static imaging at 30 min after administration for 18F-NaF and 18F-FDG or 15-min static imaging after administration for 11C-methionine.
Image Visualization and Analysis
PET and MR images were fused using a new multiresolution binarized intensity histogram (MRBIH) coregistration procedure that was specifically developed for small-animal PET/MR image fusion (17). The procedure combined low- and high-resolution images to take advantage of the low noise sensitivity at coarse levels and higher contrast at higher levels. MR imaging was used as the fixed volume, and PET was used as the floating volume. We used 3 multiresolution levels for each MRBIH and aligned them for 9 parameters (translation, rotation, and scaling in axial, sagittal, and coronal planes) until they converged at the same set of parameters.
PET and coregistered PET/MR images were visualized and analyzed with an OsiriX viewer (version 4.0, 64 bit; OsiriX). To determine the level of variation in radiotracer uptake, the mean and maximal standardized uptake values (SUVmean and SUVmax, respectively) were calculated according to the following formulas (12): SUVmean = mean uptake value/(dose injected [MBq] × animal weight [kg]) and SUVmax = maximal uptake value/(dose injected [MBq] × animal weight [kg]).
The SUV was valued within the boundaries of a region of interest (ROI), which was delimited on the MR images of the cancer-implanted paw. For 18F-FDG (n = 6) and 11C-methionine (n = 4) image analyses, 2 ROIs were used for each slice, 1 for delimiting the bone content and 1 consisting of the extraosseous region (Figs. 2B and 3B). The ROIs were then pasted on the corresponding coregistered PET images. Raw data (mean, maximum, and area) were extracted from these ROIs, and the SUVmean and SUVmax were calculated. ROIs were drawn on 3 slices per paw. Each ipsilateral slice was matched with its contralateral counterpart acquired in the same scan for statistical comparisons (e.g., ipsilateral D15 compared with contralateral D15 of same animal). For 18F-NaF images, inclusive ROIs were drawn to define the diaphysis (shaft) and the distal metaphysis or epiphysis (extremity) of the femur. SUVmax was then calculated using the same method. The most representative slice, in which the whole femur could be observed, was used for each paw (n = 6). A 5-mm2 circular ROI was drawn at a consistent distance from the bone in the biceps femoris to determine the level of background signal in the tissue, and this value was subtracted from the mean and maximal values for each tracer.
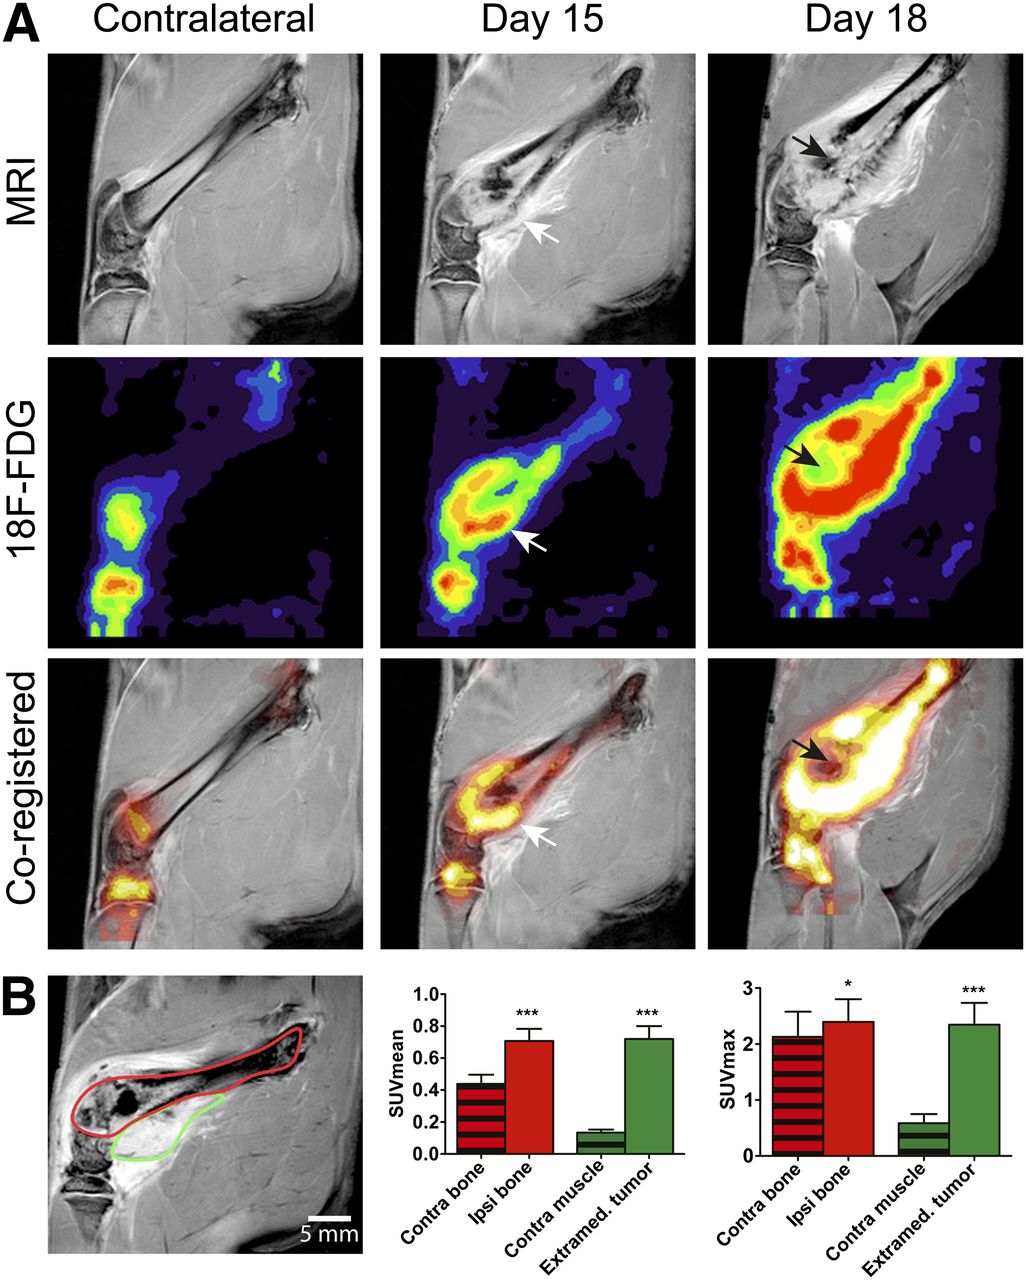
Contrast-enhanced MR imaging and 18F-FDG PET imaging of bone tumor. (A) On 18F-FDG PET scans, contralateral bone showed low uptake levels in metaphysis or epiphysis region, which was composed of healthy trabecular bone. 18F-FDG uptake increased on day 15 and was maximal on day 18. Coregistered images showed strong colocalization of contrast enhancement on MR imaging and high 18F-FDG uptake on PET (white arrows). Low uptake area corresponding to necrotic clusters was present in medullary channel of femur on day 18 (black arrows). (B) Graphic of ROI selection in bone (red) and in extraosseous tumor (green) at day 18. ROI analyses in terms of SUVmean and SUVmax.
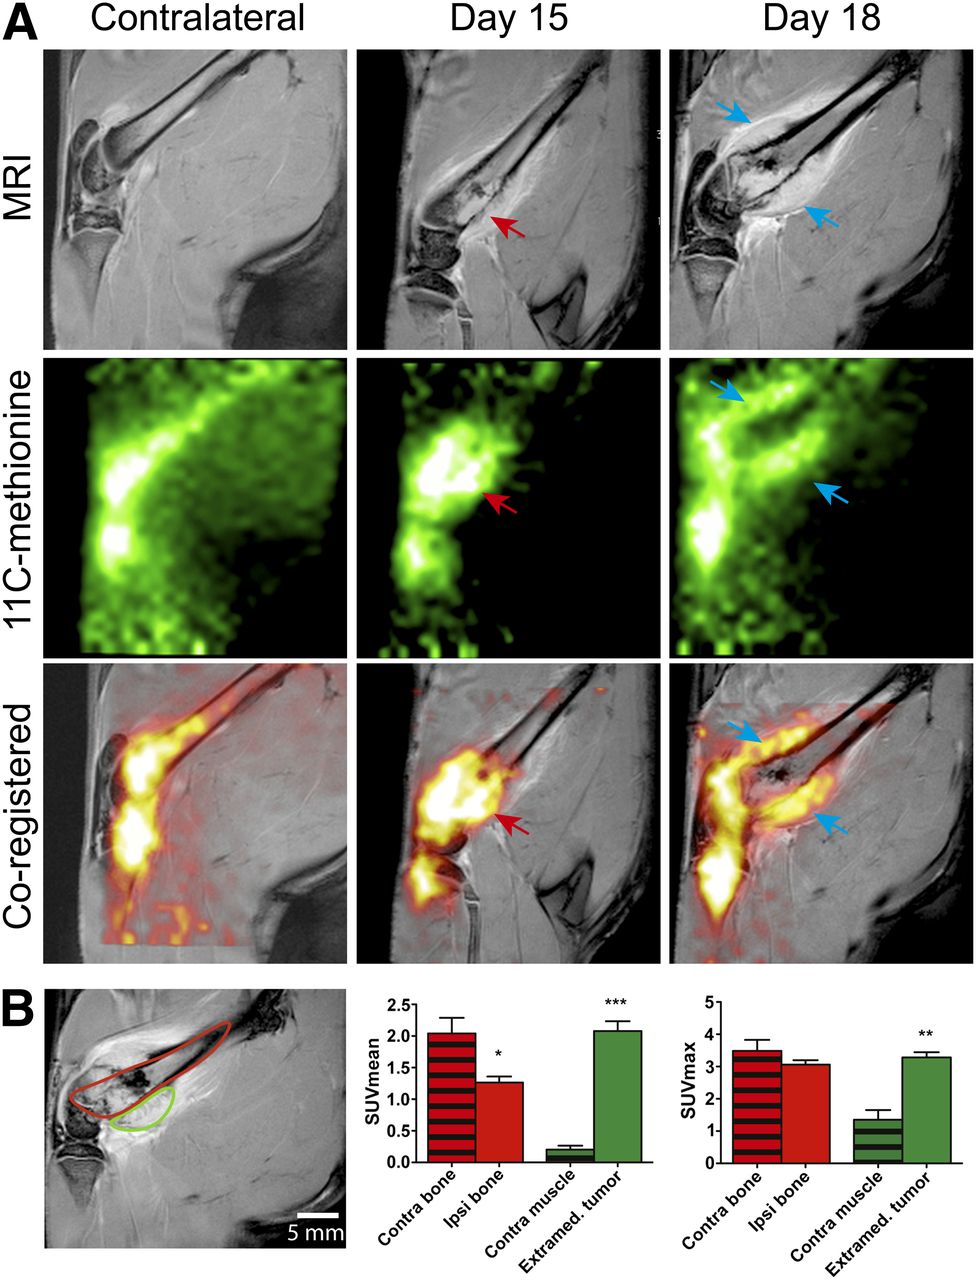
Contrast-enhanced MR imaging and 11C-methionine PET imaging of bone tumor. On 11C-methionine PET images, contralateral bone showed accumulation in both extremity and in shaft. Background level was also relatively high in muscle. On day 15, 11C-methionine accumulation was maximal in metaphysis, in epiphysis, and in growing tumor that was emerging on posterior surface of bone (red arrows). On day 18, radiotracer accumulation was localized mainly in extraosseous tumor, a finding that was confirmed by coregistered images where extraosseous contrast enhancement on MR images colocalized with 11C-methionine uptake on PET images (blue arrows). (B) Graphic of ROI selection in bone (red) and in extraosseous tumor (green) at day 18. ROI analyses in terms of SUVmean and SUVmax.
Statistical Analysis
A paired, nonparametric t test (Wilcoxon) was used to compare ipsilateral to contralateral paws in terms of SUVmean and SUVmax, and a P value of less than 0.05 was considered to be significantly different.
RESULTS
The proliferation of MRMT-1 cells implanted in the femoral medullary cavity was monitored using repeated MR image acquisition, ex vivo micro-CT analyses, and histologic staining procedures (Fig. 1). On day 9 after implantation (not shown), sagittal contrast-enhanced T1-weighted images showed that the tumor cells already had an effect on the bone microenvironment. On day 15, MR imaging showed that the bone morphology was modified at the distal extremity of the femur. The bone cortical line was less defined, and contrast enhancement appeared at the boundary of the bone. As observed in our previous study (15), tumor growth induced inflammation and edema in the surrounding environment, particularly in the interstitial space, by creating a distension of the periosteal compartment and overlaying muscular tissues. On day 18, the extent of tumor spread was observed in extraosseous tissues. Bone degradation progressed rapidly, making it difficult to detect the structure in the most affected regions of the bone cortex. Bone resorption was confirmed using micro-CT analyses and histologic observations. From days 9 through 15, trabecular degradation progressed rapidly and bone cortex invasion began. On day 9, only minor alterations were visible on the surface of the bone (not shown). On histologic slices, tumor cells were detected in the metaphysis and the endosteal surface of the bone. Healthy bone marrow was observed near the tumor. At that stage, Ki67 immunostaining showed relatively sparse positive tumor cells (not shown). By day 15, the bone cortex was highly modified, and the trabeculae architecture was compromised. However, bone density was still appreciable because of an abundance of osteoblasts compensating for the lytic activity of the tumor. Ki67 immunostaining was drastically increased 15 d after tumor cell implantation. On day 18, bone content was markedly reduced, increasing the risk of traumatic fracture. The abundance of tumor cells was confirmed by histologic analysis, which revealed that the tumor had completely replaced the bone marrow, and only sparse bone insertions were observed in the medullary cavity. Multinucleated active osteoclasts were abundant at the tumor–bone interface, and cell leakage occurred through bone cortex. Ki67-positive cells were observed sparsely throughout the tissue, but necrosis was present in important parts of the bone at that stage. Sham-operated femurs did not present any difference with the contralateral paw on days 15 and 18 (not shown).
The radiotracer 18F-FDG was used to determine the relative glucose metabolism of the bone environment in the presence of MRMT-1 tumor progression (Fig. 2). MR imaging was first performed to determine the exact anatomic contour of the bone and surrounding tissues and to ascertain the presence of the tumor (Fig. 2A). PET scans of 18F-FDG were then sequentially coregistered, showing only epiphyseal background activity that could be mainly attributed to the bone marrow blood flow in the contralateral paw (18,19). PET/MR image registration allowed us to perform region-specific analyses of the bone environment. On day 15, our previous results demonstrated the consistent presence of a tumor, ranging in size from 25 to 60 mm3 (20). At that stage, PET images showed elevated accumulation at the border of the metaphysis or diaphysis region, compared with the contralateral side. 18F-FDG uptake foci corresponded to areas where the bone cortex was damaged and heavy trabecular bone resorption occurred, as observed on coregistered MR images. On day 18, the cortical bone showed severe breaches through which the tumor had leaked, creating a distension of the periosteal compartment. The hyperintense MR signal in this extraosseous compartment converged with strikingly elevated 18F-FDG uptake. Indeed, selected ROI analyses (Fig. 2B) highlighted the increased SUVmean in both the bone (0.707 ± 0.076 vs. 0.439 ± 0.057) and extraosseous tissue (0.720 ± 0.081 vs. 0.134 ± 0.079), compared with the corresponding contralateral paw (P = 0.0002, n = 6). The SUVmax was also systematically increased in the bone tissue of the cancer paw when compared with the healthy paw (2.40 ± 0.40 vs. 2.13 ± 0.45; P = 0.02) or surrounding soft tissues (2.35 ± 0.39 vs. 0.59 ± 0.16; P = 0.0002, n = 6). In contrast, a cold 18F-FDG spot was observed in the medullary channel of the femur. This low accumulation corresponded to necrotic clusters, as shown on the corresponding histologic sections.
Methionine is a key amino acid in protein metabolism because it is the first amino acid incorporated into protein during translation. Hence, methionine incorporation is a relevant indicator of increased protein synthesis in tumor cells. After 11C-methionine administration (Fig. 3A), we observed a high level of tracer accumulation in healthy bone marrow, compared with the surrounding soft tissue. However, the accumulation site of the tracer was modified at an advanced stage of the disease. Indeed, the relative amount of tracer was increased on day 15 in the distal diaphysis. The observation of coregistered PET/MR images correlated with a disto-proximal migration of the tumor in the medullary cavity. Indeed, 11C-methionine accumulation highly colocalized with MR image contrast enhancement. On day 18, the tracer accumulated in a ring-shaped region, whereas the core of that volume seemed to be metabolically inactive. After ROI analyses of the bone and extraosseous tissue (Fig. 3B), we found that the SUVmean was significantly decreased in the ipsilateral bone (1.26 ± 0.10 vs. 2.04 ± 0.25; P = 0.01), whereas the SUVmax remained unchanged (3.06 ± 0.44 vs. 3.49 ± 1.09; P = 0.28). Areas in the periphery of the bone that were highly positive for 11C-methionine were also hyperintense on contrast-enhanced MR images. Accordingly, we observed a significant increase in both the SUVmean (2.08 ± 0.16 vs. 0.20 ± 0.06; P = 0.001) and the SUVmax (3.28 ± 0.16 vs. 1.35 ± 0.30; P = 0.007, n = 6) in this extraosseous compartment. Conversely, areas inside the medullary channel that were observed to be hyperintense by MR imaging did not appear to accumulate the 11C-methionine tracer and could correspond to necrotic areas.
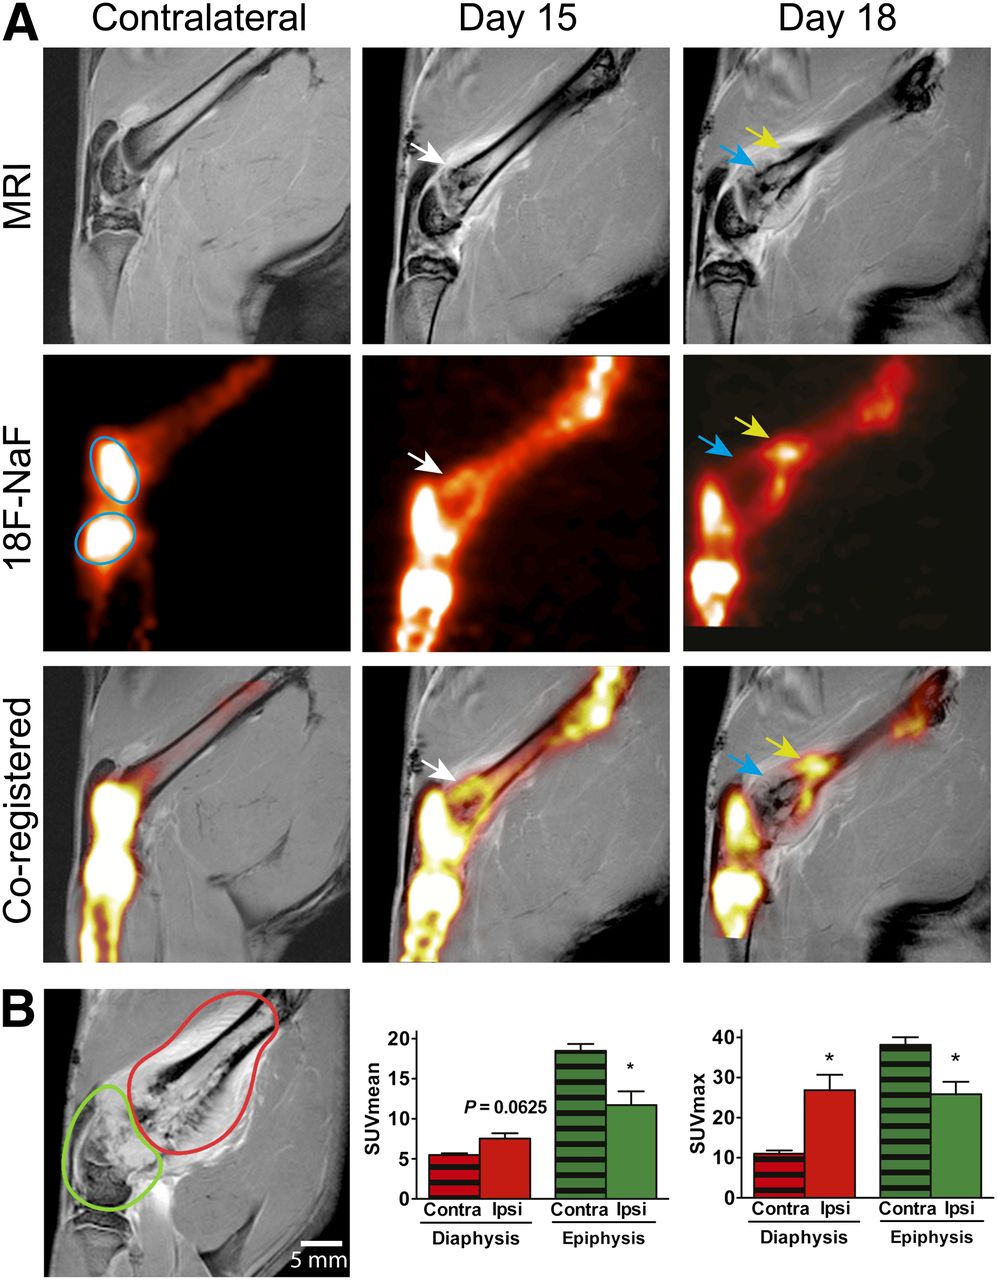
The high affinity of fluoride ions for the bone matrix makes it the tracer of choice for bone surveillance. Healthy bones showed a high tracer uptake in the femoral epiphyses (cyan oval shapes), a sign of homeostatic trabecular bone turnover (Fig. 4A). On the other hand, the bone shaft captures negligible amounts of tracer, corresponding to a lower level of bone remodeling (21). In cancer-bearing animals, the bone metabolic activity significantly changed in the vicinity of the tumor. On day 15, 18F-NaF uptake was increased in the distal medullary channel. This trend was confirmed on day 18, when the SUVmax and SUVmean of 18F-NaF were significantly increased in the diaphysis (26.9 ± 3.8 vs. 11.0 ± 0.8 [P = 0.03] and 7.52 ± 1.6 vs. 5.48 ± 0.21 [P = 0.03], respectively). This result is likely a sign of osteoblastic activity counterbalancing the lytic activity of the tumor. Indeed, PET/MR coregistered images allowed us to pinpoint most of the 18F-NaF uptake at the boundaries of the tumor, where osteoclasts and osteoblasts are abundant, as shown on histologic slices. Conversely, the SUVmax and SUVmean of 18F-NaF were decreased at the distal extremity (25.8 ± 3.1 vs. 38.2 ± 1.9 [P = 0.03] and 11.7 ± 1.7 vs. 18.5 ± 0.9 [P = 0.0625], respectively; n = 6). For instance, tracer accumulation was close to zero in areas that were hyperintense on day 15, indicative of important resorptive activity during that 3-d period, resulting in the loss of bone content.

Contrast-enhanced MR imaging and 18F-NaF PET imaging of bone tumor. Contralateral healthy bone showed high uptake levels in metaphysis (cyan oval shapes), whereas diaphysis showed little tracer accumulation. On day 15, uptake was increased in distal femur, especially where bone structure modifications were visible on MR images (white arrows). On day 18, high uptake was observed on proximal edge of tumor (yellow arrows), and low uptake areas were present where bone degradation was more extensive and tumor had emerged from bone (blue arrows). (B) Graphic of ROI selection in diaphysis (red) and in metaphysis or epiphysis (green) at day 18. ROI analyses in terms of SUVmax and SUVmean in diaphysis and metaphysis or epiphysis.
Merged 11C-methionine and 18F-NaF PET images are displayed in Supplemental Figure 1. On day 15, 11C-methionine–positive regions were strongly colocalized with 18F-fluoride, because 18F-NaF uptake on the anterior surface of the bone corresponded exactly with focal regions of high 11C-methionine uptake. The colocalization of both bone and tumor activity results in the degradation of the bone matrix and cancer cell leakage out of the medullary channel. The latter was confirmed on day 18, when 11C-methionine uptake at the distal level extended far beyond the bone structure. At that level, the 18NaF signal was virtually absent within the tumor. The colocalization of both tracers was observed only in peripheral portions of the tumor at the most proximal level and at the epiphysis of the femur. Alternatively, we observed numerous regions where only 1 tracer was present. For example, 18F-NaF accumulation was detected in the bone cortex on both MR imaging and 11C-methionine PET but not in the tumor mass. On the other hand, the tumor was active in areas in which 18F-NaF accumulation was absent.
Finally, we compared every tracer and each relevant parameter to determine how it would facilitate future analyses (Table 1). We first compared the variations of SUVmean and SUVmax, independently of the tracer used. The differences in the fold change of the standardized uptake values (SUVs) of 18F-FDG or 11C-methionine (compared with the contralateral side) were systematically greater when calculated for the SUVmean (0.6; 10.4) than for the SUVmax (1.1; 4.0). Furthermore, the percentage of variability between interindividual uptake values was also consistently smaller for the SUVmean (7.6; 11.3) than for the SUVmax (4.9; 31.2). The 11C-methionine extraosseous uptake value was the sole exception, where the SUVmax variability (4.9%) was lower than that of the SUVmean (7.6%). We then compared the 18F-FDG and 11C-methionine tracers to determine whether they were comparable in terms of the variations of the uptake parameters. Both 18F-FDG and 11C-methionine revealed important fold changes in the bone and extraosseous tissues after the SUVmean was computed for a reference. Both were poorly relevant in the bone when relying solely on the SUVmax (1.1- and 0.9-fold increase, respectively). Alternatively, the fold increase was higher using the SUVmax (2.4 vs. 1.6 for SUVmean) in the diaphysis of 18F-NaF scans. However, as was observed with the other tracers, interindividual variability was lower when the SUVmean was used. The use of the SUVmax or SUVmean appeared to be equivalent in the epiphysis or metaphysis.
PET Tracer Uptake Parameters in Bone After Implantation of Mammary-Derived Tumor
DISCUSSION
Bone scintigraphy and CT remain the gold standards for the detection of bone metastases in oncology. However, MR imaging and PET are becoming more accessible in the clinic, and their potential for bone metastases detection is being exploited. The purpose of this study was to evaluate a PET/MR image coregistration procedure using 18F-FDG, 11C-methionine, and 18F-NaF as tracers in an animal model of mammary carcinoma–derived bone metastasis. The fusion of 18F-NaF and 11C-methionine images allows for the interpretation of the relationship between tumor metabolism and bone metabolism in cancerous femurs.
In the present study, we were able to register MR and PET images obtained sequentially for the visualization of tumor-induced modifications at the bone level. The use of MR imaging as a comodality for PET was of particular interest for the determination of our ROIs. Indeed, we were able to limit our analysis to the exact contour of either the tumor or the bone, as determined by contrast enhancement, allowing for the analysis of carefully selected subregions and the exclusion of normal tissue. This technique could prove useful to improve the precision of diagnosis criteria for bone tumors. It is unclear whether this level of precision could be obtained with PET/CT. PET/CT certainly has an advantage when it comes to the evaluation of bone structure. Indeed, comparative studies determined that specificity was highest with CT for bone tumors (22). However, the enhanced contrast in soft tissue that is provided by MR imaging allows for a better determination of tumor boundaries. Additionally, perfusion information is of high interest in diagnosis and treatment monitoring. A recent study demonstrated that MR imaging (coupled with PET) was able to distinguish between angiogenesis-dependent and -independent glioblastomas (23). Moreover, the growth pattern elucidated by MR imaging was nicely correlated with histologic findings in these tumors. It would be highly speculative to pretend that PET/MR could replace PET/CT, because more preclinical and clinical studies are needed to refine their use according to the array of tumors and treatments. Future studies could also evaluate the possibility of replacing CT with 18F-NaF PET. The present study used bone samples for micro-CT imaging, and coregistration of resulting images with fluoride PET represents a technical challenge to overcome. However, future in vivo studies will attempt to provide further answers.
The information provided by PET/MR images corroborates observations from histologic sections. Indeed, 11C-methionine and 18F-FDG uptake has been associated with proliferative tumors in vitro (24). In vivo, the level of proliferation, as assessed by Ki67 staining, was associated with histologic characteristics in a rat glioblastoma model (23). In human patients, histologic profiles of suspected glioblastomas were in accordance with 11C-methionine uptake levels (25), and 11C-methionine uptake was strongly correlated with proliferation (26). In our study, increased staining was observed in tumor foci on the histologic sections of femurs labeled with Ki67. In parallel, 11C-methionine and 18F-FDG accumulation was strongly increased in late-stage disease, reinforcing the hypothesis that increased uptake of these tracers may be a good predictor of the histologic profile. The lack of 18F-NaF accumulation in the most active parts of the tumor, which were also positive for gadolinium-DTPA and 11C-methionine, suggests specific accumulation of 18F-NaF in the bone and specific accumulation of 11C-methionine in the tumor. However, discrepancies between the accumulation of gadolinium-DTPA and the accumulation of 11C-methionine or 18F-FDG suggest the specific uptake of these PET tracers in active tumor cells instead of inactive necrotic clusters. In late-stage disease, gadolinium-DTPA is localized in the central portion of the tumor, which is considered to be necrotic on histologic slices, and both 11C-methionine and 18F-FDG accumulations are absent. We suggest that gadolinium-DTPA diffusion during the time frame of the imaging study may be responsible for these differences, and further dynamic studies are necessary to solve these important questions.
11C-methionine and 18F-FDG both allowed for the detection of mammary-derived bone metastases in our model. However, the fold change in the uptake was greater with 11C-methionine than with 18F-FDG when considering the SUVmean. This difference between these tracers could be important and favors the extended use of 11C-methionine in the future. Early experiments in humans showed similar bone uptake in prostate cancer patients (27). This study by Nuñez et al. compared 11C-methionine and 18F-FDG uptake and concluded that 11C-methionine detected significantly more metastases in both the bone and the soft tissue of patients. 11C-methionine PET was also evaluated in multiple myeloma, and its uptake was increased by 6-fold in marrow lesions (28). Additionally, a study by Viel et al. showed that it was possible to differentiate angiogenesis dependent from infiltrative tumors using 11C-methionine but not 18F-FDG (23). Surprisingly, the SUVmean for 11C-methionine was decreased in our model. This fact may be caused by the advanced stage of our model at the time of analysis or differences between tumor cell types. We observed that the accumulation of 18F-FDG was localized in areas corresponding to nontumorous tissues, adjacent to the mass. This finding is not surprising because it has been shown that 18F-FDG uptake was enhanced in inflamed tissue invaded by macrophages and other inflammatory cells, accounting for approximately 25% of the uptake of this tracer in certain tumors (29). 11C-methionine uptake is low in inflamed tissue (30). Thus, we suggest that 11C-methionine may allow for a more precise determination of the tumor boundaries on coregistered MR images. This hypothesis is supported by the fact that 11C-methionine uptake is higher than 18F-FDG in several types of brain tumors (30) and has been identified as a better candidate tracer for guiding biopsies in brain cancer (31). We also detected a certain number of limitations of this tracer. First, the signal-to-noise ratio was poor for 11C-methionine. Unexpectedly, we also found relatively high uptake of 11C-methionine in healthy bones. The latter finding was also observed in clinical studies (32). This finding is an important factor that explains the relatively low magnitude of variation between the SUVmax of healthy and cancerous bones. Statistical variability could be reduced using SUV4max (a variation of SUVmax) (33).
The fact that methionine is labeled with the short-lived 11C isotope allows for the sequential use of a second tracer, such as 18F-NaF, in the same PET imaging session. To date, it is not possible to sequentially scan a patient with 18F-FDG, then with 18F-NaF, in a realistic time frame in the clinic. In our preclinical model of bone cancer, scanning the animal on 2 different days is not acceptable because the time lapse would be sufficient to observe important variability in the stage of the disease, which would be problematic for the fusion of images. Here, the short half-life of 11C-methionine (20 min) circumvented this problem. The simultaneous visualization of tumor metabolism and bone turnover using 18F-NaF in the same scanning procedure could improve bone tumor monitoring and help in designing future therapies. Indeed, the management of breast cancer patients presenting bone metastases is most often based on multimodal treatments that affect bone turnover (bisphosphonates) or the tumor itself (chemoradiotherapy) (34). Discriminating between antineoplastic therapeutic success and the bone homeostasis reestablishment is important to ascertain the quality of the clinical strategy. In a preclinical setting, the degree of precision provided by a noninvasive, multitracer PET approach could improve our ability to screen for new anticancer, antiresorptive, and analgesic treatments and their possible side effects. The sole drawback of this approach is the necessity of an on-site cyclotron, which is required for tracer synthesis, given the short half-life of 11C (31).
The SUVmax has been widely used in clinical studies to assess the metabolic activity in a malignant tumor (35). The main advantage of this parameter is that it is ROI-independent. It has been reported that the variability of the SUVmax parameter between successive scans in the same patient was higher than that for the SUVmean (36), making the latter a better option. However, the experimental pattern in that study allowed for changes in tumor metabolism between scans, which could contribute to more variability in both parameters. Further, 18F-FDG and 11C-methionine tracer analyses were compared on the basis of their SUVmean, SUVmax, or minimum SUV (SUVmin) parameters in a human study (27). However, it was difficult to highlight the advantage of using one of these parameters over the others. This difficulty is not surprising, considering the high statistical variability inherent in single-pixel values, such as SUVmax and SUVmin, and the systematic uncertainty that may result from the ROI-dependent SUVmean estimates. Here, because ROIs were safely delimited based on coregistered contrast-enhanced MR images, we observed significantly less interindividual variability for the SUVmean (9.6%), compared with the SUVmax (22.5%). The clinical significance of such variability needs to be carefully assessed, but it is likely that preclinical studies would benefit from a more reliable parameter for evaluating the outcome of a treatment through screening, particularly given the limited number of animals allowed in these experiments. The SUV calculation also assumes 100% specific uptake by cancer cells. However, this cannot be the case because an unknown portion of the tracer accumulation is nonspecific. Moreover, the tumor contour revealed by contrast-enhanced MR imaging and the extent of radiotracer uptake can be prone to systematic disparities that will affect the SUVmean calculation. A thorough comparison of gadolinium-DTPA and PET tracer uptake patterns could provide additional information in future experiments.
In addition, the method used for drawing the ROI is a significant factor for SUV calculation (37). It has been reported that manually drawn ROIs are more precise than threshold-determined regions. In fact, the ROIs were drawn on PET images without a comodality, and the SUV variability between 2 scans was 8% in the manual method and up to 13% using threshold methods (37). The ROI volume was also more variable using threshold methods (variability ≤ 55%), compared with the manual method (20%) in that study. We explored the possibility of using MR imaging to manually draw our ROIs as a support system for determining high-resolution anatomic markers. We believe that this approach allowed us to objectively determine the bone and tumor boundaries. The inclusion of the whole bone structure in the ROI, or its exclusion from soft-tissue uptake quantification, was performed with greater confidence. User-dependent variability cannot be excluded using this method, but MR images did help minimize interuser variability by standardizing the visual criteria and relying only on the anatomic aspect of the area as a criterion for drawing ROIs. The interrater reliability using this method has been demonstrated in Alzheimer disease (38), with coefficients of variation ranging between 3% and 10% for both the manual and automated methods. This method would require systematic evaluation, but it should be easily transferable to any location where PET/MR image coregistration is available in preclinical and clinical settings.
In the perspective of treatment response, monitoring and PET/MR would be of the highest interest in antiangiogenic therapies such as vascular endothelial growth factor (VEGF)–targeted antibodies. Indeed, antiangiogenic therapies have been monitored before using MR imaging in mouse models of bone and other metastasis (39,40). The observations using this technique are made from the analysis of diffusion-related parameters and are indirect but indicative of treatment effects on the tumor microenvironment. The addition of molecular imaging would provide additional and more refined confirmation of the beneficial effects of these treatments on tumor activity. Other strategies are also under investigation to use VEGF PET tracers to noninvasively determine the VEGF expression, thus replacing in parts the need for histologic sample data (41,42).
CONCLUSION
This study adds to the relevance of noninvasive, multimodality multitracer imaging for the detection and visualization of bone metastases, especially in preclinical models. A longitudinal study is necessary to evaluate the capacities of each PET radiotracer to detect the bone tumor at an early stage in our model. Nonetheless, we showed that 18F-FDG, 11C-methionine, and 18F-NaF are valuable tools to evaluate the extent of tumor invasion and the impact on bone architecture. We also showed that PET/MR image coregistration significantly improved ROI drawing, based on anatomic information. We look forward to applying our multimodal imaging approach to drug treatment monitoring in our bone cancer model.
DISCLOSURE
The costs of publication of this article were defrayed in part by the payment of page charges. Therefore, and solely to indicate this fact, this article is hereby marked “advertisement” in accordance with 18 USC section 1734. Martin Lepage is the Canada Research Chair in Magnetic Resonance Imaging. Philippe Sarret is a FRQS research scholar junior 2 and recipient of the Canada Research Chair in Neurophysiopharmacology of Chronic Pain. Louis Doré-Savard and Nicolas Beaudet are both recipients of the Frederick-Banting-and-Charles-Best CIHR doctoral scholarship. Roger Lecomte, Martin Lepage, and Philippe Sarret are members of the FRQS-funded Centre de recherche clinique Étienne–Le Bel. This work is supported by the CIHR grant MOP-219596, the Cancer Research Society and the Quebec Bio-imaging Network. No other potential conflict of interest relevant to this article was reported.
Acknowledgments
We thank Mélanie Archambeault, Véronique Dumulon-Perreault, Sébastien Tremblay, and Maxime Paillé for technical assistance. We also thank Renée Bernatchez and Yongjun Xiao from the Center for Bone and Periodontal Research for their assistance with μ-CT and histological analyses. Finally, we thank Felix Morency and other staff from the Plateforme d’analyse et de visualization d’image (http://pavi.dinf.usherbrooke.ca/) for their assistance with image processing and analysis.
Footnotes
↵* Contributed equally to this work.
Published online Apr. 17, 2013.
- © 2013 by the Society of Nuclear Medicine and Molecular Imaging, Inc.
REFERENCES
- Received for publication October 9, 2012.
- Accepted for publication December 27, 2012.


