


Abstract
Parkinson disease (PD), progressive supranuclear palsy (PSP), and multiple-system atrophy (MSA) are known to affect dopaminergic neurons of the brain stem and striatum with different preferential involvement. Here we investigated differences in striatal subregional dopamine transporter loss in PD, PSP, and MSA and assessed the diagnostic value of 18F-fluorinated-N-3-fluoropropyl-2-β-carboxymethoxy-3-β-(4-iodophenyl)nortropane (18F-FP-CIT) PET in differentiating PSP and MSA from PD. Methods: Forty-nine patients with PD, 19 patients with PSP, 24 patients with MSA, and 21 healthy people (healthy controls) were examined with 18F-FP-CIT PET. The PET images were spatially normalized and analyzed with 12 striatal subregional volume-of-interest (VOI) templates (bilateral ventral striatum [VS], anterior caudate [AC], posterior caudate, anterior putamen, posterior putamen [PP], and ventral putamen [VP]) and 1 occipital VOI template. The nondisplaceable binding potential (BPND) and intersubregional ratio (ISR; defined as the ratio of the BPND of one striatal subregion to that of another striatal subregion) of subregional VOIs were calculated. Results: The BPND of all VOIs in the PD, MSA, and PSP groups were significantly lower than those in the healthy controls (P < 0.05). The BPND of AC and the AC/VS ISR in the PSP group were significantly lower than those in the PD group. The BPND of VP was significantly lower, but the PP/VP ISR was significantly higher in the MSA group than in the PD group. At the cutoff value for the AC/VS ISR (<0.7), the sensitivity and specificity for differentiating PSP from PD were 94% and 92%, respectively. At the cutoff value for the PP/VP ISR (>0.65), the sensitivity and specificity for differentiating MSA from PD were 90% and 45%, respectively. The diagnostic accuracy of visual analysis was similar to that of quantitative analysis for differentiating PSP from PD but was significantly higher for differentiating MSA from PD. Conclusion: Compared with PD, PSP and MSA showed more prominent and earlier dopamine transporter loss in the AC and VP, respectively. These findings could be useful for suggesting PSP or MSA in parkinsonian cases without characteristic atypical features.
Parkinsonian disorders have clinically similar features characterized by akinesia with resting tremor, rigidity, or postural instability (1) but exhibit pathologically distinct features (2). Idiopathic Parkinson disease (PD), the most common, is slowly progressive and responsive to l-3,4-dihydroxyphenylalanine. Atypical parkinsonian disorders (APD), such as progressive supranuclear palsy (PSP) and multiple-system atrophy (MSA), which also account for a significant proportion of parkinsonian cases (3), exhibit a rapidly evolving and fatal neurodegenerative course (4,5). Nevertheless, the majority of patients with APD have clinical features that overlap those of PD. A major concern in differentiating parkinsonian disorders is early diagnosis, particularly at a stage of disease evolution when intervention is likely to be most effective. Consequently, making an accurate diagnosis is critical, not only for choosing treatment regimens (6) and assessing prognosis (7) but also for understanding pathogenesis and developing new therapeutic strategies (8). Although the definition of PD is in an active state of evolution, it mainly requires the histologic demonstration of intraneuronal Lewy body inclusions in the nervous system (9)—a test that is clearly impractical during a patient's life. The application of less sensitive clinical criteria (10) based on retrospective clinicopathologic studies only intensifies the confusion. Consequently, the diagnosis of parkinsonian disorders continues to be challenging, with misdiagnosis rates of 20%–30% in early stages (11).
Numerous efforts have been made to improve the diagnostic accuracy of tests used to discriminate APD from PD. Functional imaging techniques such as both pre- and postsynaptic dopaminergic SPECT or PET and 18F-FDG PET have been studied for their potential ability to differentiate APD from PD (12,13).
To date, dopamine receptor imaging and 18F-FDG PET have shown promise in distinguishing among parkinsonian disorders. Presynaptic dopamine transporter (DAT) imaging, in contrast, has not proved as useful as dopamine receptor or 18F-FDG imaging in differentiating APD from PD, although it is useful in ruling out essential tremor, drug-induced parkinsonism, vascular parkinsonism, and Alzheimer disease because it reveals significant striatal DAT loss in both PSP and MSA as well as PD (14,15).
18F-fluorinated-N-3-fluoropropyl-2-β-carboxymethoxy-3-β-(4-iodophenyl)nortropane (18F-FP-CIT) PET/CT, which has recently become available for DAT imaging in clinical practice, has better spatial resolution and more sophisticated attenuation correction than SPECT (16). Thus, it is possible to use 18F-FP-CIT PET to evaluate subregional changes in the striatal DAT (17) and to differentiate parkinsonian disorders on the basis of the more asymmetric and pronounced loss of the posterior putamen (PP) in PD than in APD (14,15).
The purposes of this study were to investigate differences in subregional DAT loss in PD, PSP, and MSA and to establish the diagnostic value of 18F-FP-CIT PET in differentiating PSP and MSA from PD.
MATERIALS AND METHODS
Subjects
Nineteen patients with clinically probable PSP, 24 patients with clinically probable MSA, and 49 patients with PD at various Hoehn–Yahr stages were enrolled in this study. The diagnosis of PD was based on UK Parkinson's Disease Society Brain Bank Clinical Diagnostic Criteria (18). Patients with clinically probable PSP (the classic Richardson syndrome) and MSA (parkinsonian type) were enrolled on the basis of current diagnostic criteria (4,19). All patients were assessed by a neurologist specializing in movement disorders. Their medical records were available. The severity of motor symptoms was evaluated with the motor portion of the Unified Parkinson Disease Rating Scale, Part III (UPDRS III), immediately before PET and after antiparkinsonian drugs had been discontinued for at least 12 h (considered “off medication”).
Twenty-one healthy people (healthy controls) (>40 y old) were selected from among a normal 18F-FP-CIT PET data pool maintained at our institution. Healthy controls had no neurologic or psychologic diseases. This study was approved by the institutional review board, and written informed consent was obtained from each subject.
Radiopharmaceutical Synthesis
18F-FP-CIT was synthesized with a protic solvent (t-butanol or t-amyl alcohol) as a reaction solvent and N-[3′-(tosyloxy)propyl]-2β-carbomethoxy-3β-(4′-iodophenyl)nortropane as a precursor (20). The radiochemical yield (mean ± SD) was 42.5% ± 10.9% (decay corrected), the radiochemical purity was greater than 98% after purification by high-performance liquid chromatography, and the specific activity was 64.4 ± 4.5 GBq/μmol at the end of synthesis.
PET/CT
18F-FP-CIT PET was performed with a Biograph 40 TruePoint PET/CT camera (Siemens/CTI), which provides an in-plane spatial resolution of 2.0 mm full width at half maximum at the center of the field of view. All subjects had fasted for at least 6 h, and antiparkinsonian drugs had been stopped 12 h before the scans were obtained. Image acquisition was started 3 h after intravenous injection of 18F-FP-CIT (185 MBq). Emission PET data were acquired for 10 min in the 3-dimensional mode after brain CT, which was performed in the spiral mode at 120 kVp and 380 mAs (reference standard) with the CARE Dose 4D program. 18F-FP-CIT PET images were reconstructed from CT data for attenuation correction by use of the TrueX algorithm and an all-pass filter with a 336 × 336 matrix.
Quantitative Analyses
Image processing was performed with SPM2 (Wellcome Department of Imaging Neuroscience, Institute of Neurology, University College London) within MATLAB 6.5.1 for Windows (The MathWorks, Inc.) and MRIcro version 1.37 (Chris Rorden, Columbia, SC, USA. www.mricro.com).
Quantitative analyses were based on volumes of interest (VOIs), which were defined on the basis of a template in standard space. All reconstructed PET images were spatially normalized to Talairach space by use of a standard 18F-FP-CIT PET template, which was made in-house from 18F-FP-CIT PET and T1-weighted MR images of 13 healthy controls (4 men and 9 women; 55.2 ± 9.2 y old; age range, 41–70 y) as described previously to remove intersubject anatomic variability (21). Images of patients were reoriented so that the striatum contralateral to the symptomatic side was on the left side of the brain. If no laterality was present, then the anatomic left became the more affected side.
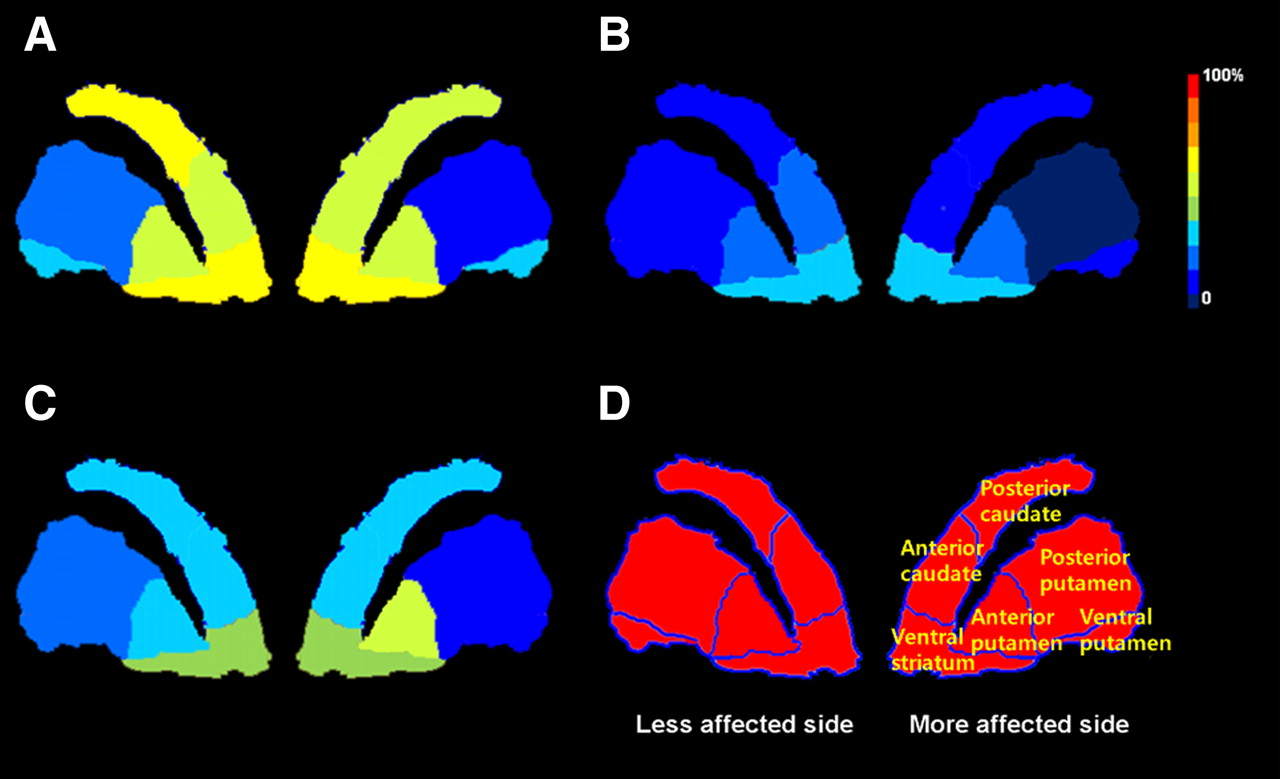
Twelve VOIs of bilateral striatal subregions and one occipital VOI were drawn manually on a coregistered, spatially normalized, single T1-weighted MRI and 18F-FP-CIT PET template image by an experienced nuclear medicine physician specializing in nuclear neurology. The VOI for the ventral striatum (VS) was defined on the basis of previously defined criteria (22); the caudate nucleus and putamen were further divided into 5 subregions: anterior caudate (AC), posterior caudate (PC), anterior putamen (AP), PP, and ventral putamen (VP). The boundary point between the AC and the PC and between the AP and the PP was the anterior commissure coronal plane. The boundary point between the PP and the VP was the anterior–posterior commissure transaxial plane. The outer boundaries of the striatal subregions were visually determined from the characteristic increased activity of the striatum, which readily distinguished these subregions from extrastriatal structures (Fig. 1).

Diagram of age-corrected, normalized %BP of striatal subregions on 18F-FP-CIT PET for PD (A), PSP (B), MSA (C), and healthy controls (D).
The VOI template in the standard stereotactic space was automatically applied directly to the spatially normalized individual PET images to analyze striatal 18F-FP-CIT binding.
The activity concentration in each VOI was calculated. The nondisplaceable binding potential (BPND) was defined as follows: (mean standardized uptake value [SUV] of striatal subregional VOI − mean SUV of occipital VOI)/mean SUV of occipital VOI. The age-corrected normalized BPND (%BP) was defined as follows: 100 × (BPND for patient/BPND for age-matched healthy control). The intersubregional ratio (ISR) was defined as the ratio of the BPND of one striatal subregion to that of another striatal subregion. The ISRs for the anteroposterior gradient (AP/PP, AC/PC, and PP/AC), the ventrodorsal gradient (AC/VS, AP/VS, AC/AP, PP/VP, and PC/VP), and the asymmetry of the BPND for each of the 6 striatal subregions were calculated.
Visual Analysis
For visual interpretation, 18F-FP-CIT PET/CT images were displayed as a series of 148 transaxial slices scaled to a common maximum in a standard color scale on a dedicated workstation (Singo; Siemens). All PET images were compared visually. First, they were independently classified as PD, PSP, or MSA; next, they were assigned as PSP (or MSA) versus PD by 3 nuclear medicine physicians who were completely unaware of the clinical information. A training session had been organized for learning typical images (Fig. 2) of each disease entity on the basis of the results of the VOI analysis.

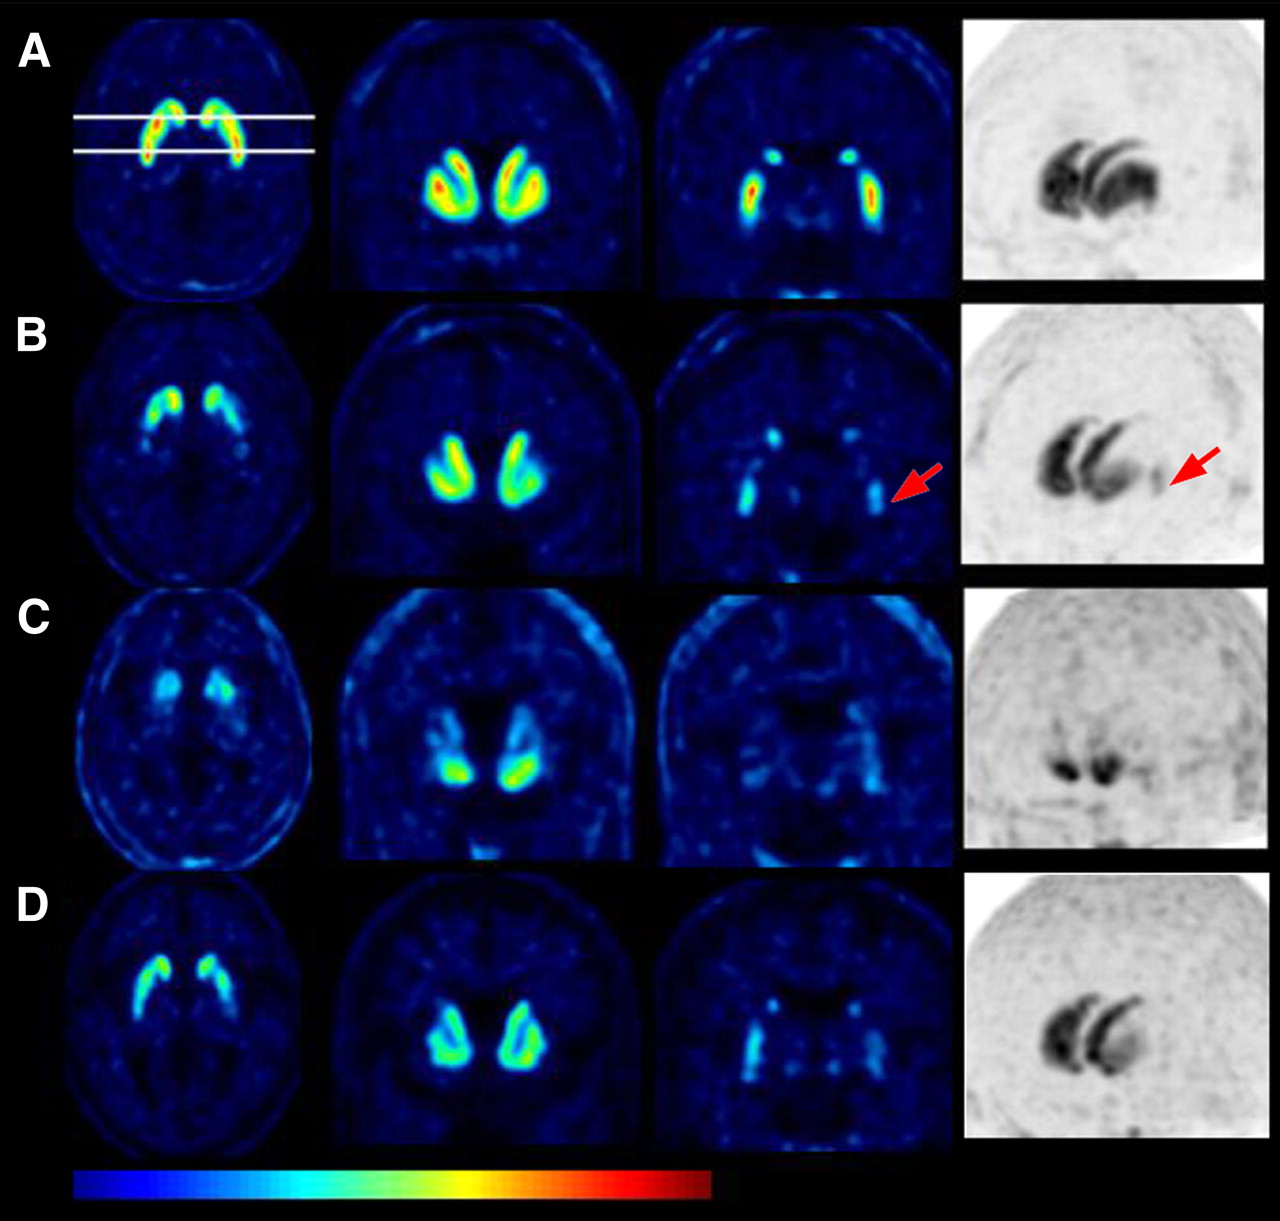
Representative ratio (regional VOI to occipital VOI) parametric axial images at level of anterior–posterior commissure, coronal image at level 7 mm anterior to anterior commissure, coronal image at level 17 mm posterior to anterior commissure, and maximum-intensity-projection image from 18F-FP-CIT PET of healthy controls (A) and PD (B), PSP (C), and MSA (D) groups. (B) PET images of patients with PD showed typical preferential DAT loss in dorsal PP. Note relative sparing of DAT loss in VP (arrow). (C) PET images of patients with PSP showed preferential DAT loss in caudate nuclei as well as in putamen. (D) PET images of patients with MSA showed preferential DAT loss in VP as well as in dorsal PP.
Statistical Analyses
Continuous variables among groups were compared with 1-way ANOVAs. The Bonferroni correction was applied to a post hoc analysis of between-group comparisons. For multiple comparisons of BPND and %BP, a P value of less than 0.008 (0.05/6) was chosen. For ISRs, a P value of less than 0.004 (0.05/12) was chosen. For comparisons of %BP among groups, BPND values were age corrected by fitting each patient's data to a regression line calculated from a sample of 21 healthy controls and were expressed as percentages of control values for each striatal subregion as previously reported (23). A receiver-operating-characteristic curve analysis was used to select the most significant ISR for discriminating APD from PD. Pearson correlation analyses were used to identify the correlations between ISRs and clinical parameters. For visual analysis, agreement was measured between readers, and the Fleiss κ coefficient was used to evaluate overall agreement. The McNemar test was used to compare significant differences between quantitative analysis and visual analysis. A P value of less than 0.05 was considered statistically significant.
Data for the study variables were expressed as mean ± SD. We used SPSS version 17.0 (SPSS Inc.) and SAS 9.1 (SAS Institute Inc.) software.
RESULTS
The clinical characteristics of the patients with PD, PSP, and MSA and the healthy controls are summarized in Table 1. There were no significant differences in sex, duration of symptoms, or UPDRS III scores among the disease groups. Patients in the PSP and MSA groups had more advanced Hoehn–Yahr stages than patients in the PD group (P < 0.001 for both PSP and MSA).
Clinical Characteristics of Subjects
VOI Analysis
Data from 5 cases (1 PD, 2 PSP, and 2 MSA) for which 18F-FP-CIT PET images showed visually evident misregistration with predefined VOI templates after spatial normalization were excluded from the VOI analysis.
BPND and age-corrected %BP values for all bilateral striatal subregions in the PD, PSP, and MSA groups were significantly lower than those in the healthy controls (P < 0.001) (Table 2 and Fig. 2). A post hoc analysis revealed that BPND and age-corrected %BP values for the whole striatum and several subregions in the PSP group were significantly lower than those in the PD group (P < 0.001).
BPND of Striatal Subregions in Healthy Controls and PD, PSP, and MSA Groups
The ISRs for the anteroposterior gradient, ventrodorsal gradient, and asymmetry in the PD, PSP, and MSA groups and healthy controls are shown in Tables 3 and 4. The PP/AC ISR (anteroposterior gradient) in the PD group was significantly lower than those in the healthy controls and the PSP group. The asymmetry of striatal BPND values was significantly different only for PP in the PD group and the healthy controls (P < 0.001).
ISRs for Gradients of BPND in PD, PSP, and MSA Groups
ISRs for Asymmetry (Left to Right) of BPND in PD, PSP, and MSA Groups
Among the ISRs suggesting a ventrodorsal gradient, the AC/VS ISR in the PSP group was significantly lower than that in the PD group (0.5 ± 0.2 vs. 1.0 ± 0.2 on the more affected side [P < 0.001]; 0.5 ± 0.3 vs.1.0 ± 0.2 on the less affected side [P < 0.001]) (Fig. 3A). The AC/VS ISR correlated positively with the UPDRS III score and symptom duration in the PD group (P < 0.05) but not in the PSP group (Supplemental Fig. 1) (supplemental materials are available online only at http://jnm.snmjournals.org). A receiver-operating-characteristic curve analysis showed that the AC/VS ISR on the more affected side had the largest area under the curve (0.958 and 0.928 on the more and less affected sides, respectively) and was the most significant parameter for discriminating PSP from PD. At the cutoff value for the AC/VS ISR (<0.7), the sensitivity, specificity, positive predictive value, and negative predictive value for differentiating PSP from PD were 94%, 92%, 80%, and 98%, respectively.

ISRs of BPND values. (A) AC/VS ratios in PSP group were significantly lower than those in PD group, MSA group, and healthy controls. (B) PP/VP ratios in MSA group were significantly higher than those in PD group.
Among the ISRs suggesting a ventrodorsal gradient, the PP/VP ISR in the MSA group was significantly higher than that in the PD group on the more affected side (0.8 ± 0.3 vs. 0.6 ± 0.3 [P = 0.002]) (Fig. 3B). The PP/VP ISR correlated positively with the UPDRS III score and symptom duration in the PD group (P < 0.01) but not in the MSA group (Supplemental Fig. 2). A receiver-operating-characteristic curve analysis revealed that the PP/VP ISR on the less affected side had the largest area under the curve (0.709 and 0.736 on the more and less affected sides, respectively) and was the most significant parameter for discriminating MSA from PD. At the cutoff value for the PP/VP ISR (>0.65), the sensitivity, specificity, positive predictive value, and negative predictive value for differentiating MSA from PD were 90%, 45%, 44%, and 92%, respectively.
Visual Analysis
On axial, coronal, and maximum-intensity-projection images of 18F-FP-CIT PET, patients with PD showed a preferential decrease in DAT binding in the PP, with relative sparing of the VP (“rabbit hip” sign on the maximum-intensity-projection image). Patients with PSP showed a preferential decrease in DAT binding in the caudate nuclei (“rabbit ear” sign) as well as in the putamen. Patients with MSA showed a preferential decrease in DAT binding in the VP (“rabbit foot” sign) as well as in the PP (Fig. 2).
The results of the visual analysis are shown in Table 5. The interobserver agreement of 3 interpreters in the visual analysis was good (Fleiss κ coefficient, 0.70 [P < 0.001]). The rates of concordance of clinical and visual diagnoses were 96% for PD, 78% for PSP, and 67% for MSA.
Visual Interpretation of 18F-FP-CIT PET Images of Patients with PD, PSP, and MSA
The sensitivity, specificity, positive predictive value, and negative predictive value for discriminating PSP from PD were 84%, 98%, 94%, and 94%, respectively; for discriminating MSA from PD, the respective values were 79%, 96%, 90%, and 90%. The diagnostic accuracy of visual analysis was similar to that of quantitative analysis for differentiating PSP from PD (P = 0.250) but was significantly higher for differentiating MSA from PD (P < 0.001).
DISCUSSION
In the present study, all groups of patients showed significantly reduced striatal subregional BPND values, indicative of presynaptic degeneration, but exhibited different preferential subregional losses of striatal DAT on 18F-FP-CIT PET. Compared with patients with PD, patients with PSP and MSA showed more prominent and earlier DAT losses in the AC and VP, respectively.
The striatum is divided into 3 functional parts: the VS, which is strongly implicated in emotion, motivation, and reward-guided behaviors; the associative striatum, which is largely involved in cognition; and the sensorimotor striatum, which is involved in motor function (24). The striatum was further divided into more substructures—VS, VP, AP, PP, AC, and AP—in the present study than in previous studies (17,25) because of the higher resolution offered by a new-generation PET scanner (26). This scenario enabled us to understand the complex functional anatomy of this structure, which is crucial to understanding the pathophysiology of parkinsonian disorders. For example, we were able to observe that DAT binding was always mostly spared in the VS in all groups of patients (Fig. 2). This sparing of the VS relative to the associative striatum or the sensorimotor striatum could have implications in the context of the anatomic framework described earlier.
Our results showed an anteroposterior gradient in PD, indicating greater involvement in the PP than in the AP, especially on the more affected side. These results are consistent with previous 123I-β-CIT studies (17,27). However, the relative sparing of DAT loss in the VP in PD resulted in a ventrodorsal gradient of putaminal DAT loss. A previous study with 18F-3,4-dihydroxyphenylalanine PET showed a gradient in dopamine metabolism from the ventral to the dorsal portion of the caudal putamen in patients with PD (27). This pattern may reflect the neuropathologic basis of PD, in which the particularly early involvement of the ventrolateral part of the pars compacta of the substantia nigra, which projects to the posterior part of the putamen, is known to occur (28). Our results also supported the findings that the mean density of α-synuclein immunoreactivity was higher in the lateral segment of the substantia nigra and inversely correlated with the density of DAT immunoreactivity in brains with synucleinopathy (29). The preservation of DAT binding in the VP in PD is reasonable, considering the role of the VS.
Patients with PSP showed the most extensive and symmetric pattern of striatal DAT loss, including that in the caudate nuclei, on 18F-FP-CIT PET. These results are supported by a pathology study that found a more widespread loss of dopamine neurons in PSP than in PD (30). In terms of the ventrodorsal gradient, we also found a more profound DAT loss in the AC than in the VS; this feature provided the best diagnostic value for differentiating the PSP group from other groups. These results are consistent with a previous study showing that extensive pathologic degeneration of the pars compacta impaired the projection to the head of the caudate in PSP (31). However, in contrast to previous studies with 123I-β-CIT (31) and 123I-IPT SPECT (13), our study showed an anteroposterior gradient of DAT loss in patients with PSP that was similar to that in patients with PD and MSA. Technically, this finding was mainly due to the clearer separation of striatal subregions afforded by the increased spatial resolution of the PET camera compared with a SPECT camera (16). In other words, we reduced the spillover of higher putaminal 123I-β-CIT uptake into the adjacent caudate head that led to an overestimation of the caudate signal in a previous study (32).
18F-FDG PET often missed small changes in striatal metabolism in early MSA because the nigrostriatal dopaminergic terminals comprise less than one-fifth of the striatal synapses (33). In contrast, in the present study, striatal DAT loss was evident in all patients with MSA despite the relatively short duration of symptoms.
Consistent with previous 123I-β-CIT studies (34,35), the present study showed similar anteroposterior gradients in the MSA and PD groups. With respect to the ventrodorsal gradient, however, the MSA group showed a relatively even DAT loss from the VP to the PP; in contrast, the PD group showed a ventrodorsal gradient of putaminal DAT loss. In this context, we suggest that the ventrodorsal gradient is more useful for differentiating PD from MSA than the anteroposterior gradient, even in the early stage. The different patterns may reflect the different neuropathologic bases of these diseases. Goto et al. (36) reported that the loss of striatal dopaminergic neurons preceded nigral involvement in MSA, which is opposite that in PD (7), although the ventrolateral substantia nigra is known to be the most pathologically affected region in both PD and MSA. We believe that this early pathologic involvement of the striatum as well as the midbrain in MSA results in a relatively even loss of putaminal DAT without a ventrodorsal gradient.
The AC/VS and PP/VP ISRs showed good diagnostic accuracy for differentiating PSP and MSA from PD, respectively. In the present study, we chose the optimum cutoff probability values in a way that maximized sensitivity to complement the low sensitivity of clinical criteria because, in the clinical setting, 18F-FP-CIT PET is used mainly as a confirmatory test for DAT loss in patients with suspected PD rather than for the differential diagnosis of APD.
Visual interpretation showed comparatively superior diagnostic accuracy for differentiating PSP or MSA from PD mainly because this approach could take into account not only ISRs but also other circumstances, such as asymmetry.
Finally, several methodologic and clinical limitations of the present study deserve mention. First, considering the current subcentimeter spatial resolution of a PET scanner and the sizes of the striatal subregions, partial-volume effects cannot be excluded. Given that nonlinear partial-volume effects lead to an underestimation of the concentration of radioactivity in small lesions (37), the quantification of signals in the posterior parts of the putamen likely would be particularly affected (32). In the present study, however, the 18F-FP-CIT signals in such subregions in all groups of patients were significantly lower than those in healthy controls. Therefore, this potential issue is less likely to affect classification by ISRs.
Second, template-based VOI analysis might further reduce resolution during the normalization of individual PET images to the 18F-FP-CIT PET template. Accurate segmentation of this structure is of great interest. Because of the improved resolution of PET instrumentation, subdividing the putamen into multiple parts was recently attempted in a VOI-based study (38). In addition, Jokinen et al. (17) reported the reliable detection of early PD by ratio analysis of 6-18F-flouro-l-dopa uptake in striatal subregions. In the present study, however, spatially normalized 18F-FP-CIT PET images of some patients showed misregistration with predefined VOI templates and were ultimately excluded from the VOI analysis. This problem might be intrinsic to template-based analysis for patients with severe cerebral atrophy, ventricle enlargement, and advanced stages of parkinsonian disorders (39).
Third, we used ISRs to show different patterns of DAT loss in striatal subregions. Although this approach is simple, it might result in overestimation if there is a relatively severe loss at the bottom of the fraction. This scenario could explain the extraordinary asymmetry of the PC in the PSP group.
Finally, patients in the present study were diagnosed clinically. Therefore, misdiagnoses could have occurred because of the lack of postmortem verification (40). Although all diagnoses were based on strict diagnostic criteria, a longer period of follow-up is needed, especially given that the overdiagnosis of PD and the underdiagnosis of atypical parkinsonism are common (11).
Despite these limitations, the results of our study set the stage for the use of 18F-FP-CIT PET for the differential diagnosis of parkinsonian disorders. Analysis of the detailed subregions of the striatum provides insights into the pathophysiology of each disease. Moreover, the comparatively superior performance of visual interpretation adds the value of daily clinical practice for the detection and differentiation of parkinsonism.
CONCLUSION
PD, PSP, and MSA had significantly reduced striatal subregional BPND values but different preferential subregional decreases in striatal DAT binding when examined by 18F-FP-CIT PET. Compared with PD, PSP and MSA had more prominent and earlier DAT loss in the AC and VP, respectively. These findings could be useful for suggesting PSP or MSA in parkinsonian cases without characteristic atypical features.
DISCLOSURE STATEMENT
The costs of publication of this article were defrayed in part by the payment of page charges. Therefore, and solely to indicate this fact, this article is hereby marked “advertisement” in accordance with 18 USC section 1734.
Acknowledgments
This work was supported by the real-time molecular imaging research program (No. 2010-002040) from the National Research Foundation (NRF). No other potential conflict of interest relevant to this article was reported.
Footnotes
Published online Feb. 9, 2012.
- © 2012 by the Society of Nuclear Medicine, Inc.
REFERENCES
- Received for publication June 30, 2011.
- Accepted for publication October 17, 2011.


Jump to section
Related Articles
Cited By...
- Fast and Accurate Amyloid Brain PET Quantification Without MRI Using Deep Neural Networks
- Association Between White Matter Networks and the Pattern of Striatal Dopamine Depletion in Patients With Parkinson Disease
- Imaging Dopaminergic Neurotransmission in Neurodegenerative Disorders
- Safety of AADC Gene Therapy for Moderately Advanced Parkinson Disease: Three-Year Outcomes From the PD-1101 Trial
- Determining the Degree of Dopaminergic Denervation Based on the Loss of Nigral Hyperintensity on SMWI in Parkinsonism
- Data-driven evolution of neurosurgical gene therapy delivery in Parkinsons disease
- Areas of white matter hyperintensities and motor symptoms of Parkinson disease
- Clinical and striatal dopamine transporter predictors of {beta}-amyloid in dementia with Lewy bodies
- Presynaptic Striatal Dopaminergic Function in Atypical Parkinsonism: A Metaanalysis of Imaging Studies
- Levodopa-induced dyskinesia is closely linked to progression of frontal dysfunction in PD
- Effects of dopaminergic depletion and brain atrophy on neuropsychiatric symptoms in de novo Parkinsons disease
- Analysis of Extrastriatal 123I-FP-CIT Binding Contributes to the Differential Diagnosis of Parkinsonian Diseases
- Is normosmic Parkinson disease a unique clinical phenotype?
- Segmentation-Based MR Attenuation Correction Including Bones Also Affects Quantitation in Brain Studies: An Initial Result of 18F-FP-CIT PET/MR for Patients with Parkinsonism
- Is ioflupane I123 injection diagnostically effective in patients with movement disorders and dementia? Pooled analysis of four clinical trials
- Presynaptic dopamine depletion predicts levodopa-induced dyskinesia in de novo Parkinson disease
- Clinical utility of dopamine transporter single photon emission CT (DaT-SPECT) with (123I) ioflupane in diagnosis of parkinsonian syndromes