
Main menu

  • Home
  • Content
    • Current
    • Ahead of print
    • Past Issues
    • JNM Supplement
    • SNMMI Annual Meeting Abstracts
    • Continuing Education
    • JNM Podcasts
  • Subscriptions
    • Subscribers
    • Institutional and Non-member
    • Rates
    • Journal Claims
    • Corporate & Special Sales
  • Authors
    • Submit to JNM
    • Information for Authors
    • Assignment of Copyright
    • AQARA requirements
  • Info
    • Reviewers
    • Permissions
    • Advertisers
  • About
    • About Us
    • Editorial Board
    • Contact Information
  • More
    • Alerts
    • Feedback
    • Help
    • SNMMI Journals
  • SNMMI
    • JNM
    • JNMT
    • SNMMI Journals
    • SNMMI

User menu

  • Subscribe
  • My alerts
  • Log in
  • My Cart

Search

  • Advanced search
Journal of Nuclear Medicine
  • SNMMI
    • JNM
    • JNMT
    • SNMMI Journals
    • SNMMI
  • Subscribe
  • My alerts
  • Log in
  • My Cart
Journal of Nuclear Medicine

Advanced Search

  • Home
  • Content
    • Current
    • Ahead of print
    • Past Issues
    • JNM Supplement
    • SNMMI Annual Meeting Abstracts
    • Continuing Education
    • JNM Podcasts
  • Subscriptions
    • Subscribers
    • Institutional and Non-member
    • Rates
    • Journal Claims
    • Corporate & Special Sales
  • Authors
    • Submit to JNM
    • Information for Authors
    • Assignment of Copyright
    • AQARA requirements
  • Info
    • Reviewers
    • Permissions
    • Advertisers
  • About
    • About Us
    • Editorial Board
    • Contact Information
  • More
    • Alerts
    • Feedback
    • Help
    • SNMMI Journals
  • View or Listen to JNM Podcast
  • Visit JNM on Facebook
  • Join JNM on LinkedIn
  • Follow JNM on Twitter
  • Subscribe to our RSS feeds
Research ArticleClinical Investigations

Brain and Whole-Body Imaging of Nociceptin/Orphanin FQ Peptide Receptor in Humans Using the PET Ligand 11C-NOP-1A

Talakad G. Lohith, Sami S. Zoghbi, Cheryl L. Morse, Maria F. Araneta, Vanessa N. Barth, Nancy A. Goebl, Johannes T. Tauscher, Victor W. Pike, Robert B. Innis and Masahiro Fujita
Journal of Nuclear Medicine March 2012, 53 (3) 385-392; DOI: https://doi.org/10.2967/jnumed.111.097162
Talakad G. Lohith
  • Find this author on Google Scholar
  • Find this author on PubMed
  • Search for this author on this site
Sami S. Zoghbi
  • Find this author on Google Scholar
  • Find this author on PubMed
  • Search for this author on this site
Cheryl L. Morse
  • Find this author on Google Scholar
  • Find this author on PubMed
  • Search for this author on this site
Maria F. Araneta
  • Find this author on Google Scholar
  • Find this author on PubMed
  • Search for this author on this site
Vanessa N. Barth
  • Find this author on Google Scholar
  • Find this author on PubMed
  • Search for this author on this site
Nancy A. Goebl
  • Find this author on Google Scholar
  • Find this author on PubMed
  • Search for this author on this site
Johannes T. Tauscher
  • Find this author on Google Scholar
  • Find this author on PubMed
  • Search for this author on this site
Victor W. Pike
  • Find this author on Google Scholar
  • Find this author on PubMed
  • Search for this author on this site
Robert B. Innis
  • Find this author on Google Scholar
  • Find this author on PubMed
  • Search for this author on this site
Masahiro Fujita
  • Find this author on Google Scholar
  • Find this author on PubMed
  • Search for this author on this site
  • Article
  • Figures & Data
  • Supplemental
  • Info & Metrics
  • PDF
Loading

Article Figures & Data

Figures

  • Tables
  • Additional Files
  • FIGURE 1.
    • Download figure
    • Open in new tab
    • Download powerpoint
    FIGURE 1.

    Parent radioligand fraction, radioactivity concentrations (conc), and radiometabolite profile in plasma from 40-y-old healthy man injected with 755 MBq of 11C-NOP-1A. (A) Fraction of unchanged parent radioligand 11C-NOP-1A (○) in plasma fitted by Hill function. (B) Time course of parent 11C-NOP-1A concentration (○) in arterial plasma fitted by multiplying triexponential-fitted total plasma radioactivity and Hill function–fitted plasma parent fraction. (C) Radiochromatogram illustrating plasma composition 40 min after injection of 11C-NOP-1A. Radioactivity was measured in counts per second (cps). Peaks A to D and parent are labeled with increasing lipophilicity.
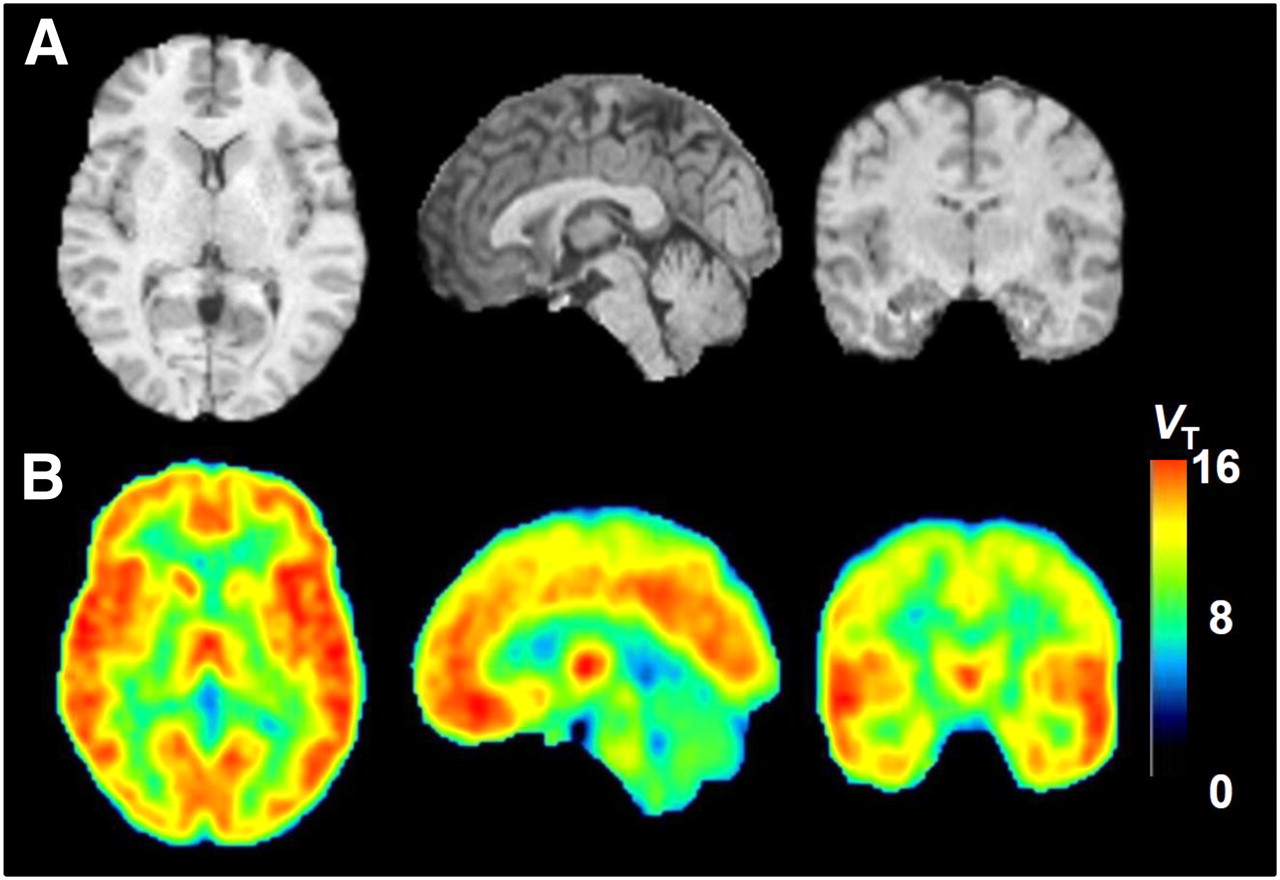
  • FIGURE 2.
    • Download figure
    • Open in new tab
    • Download powerpoint
    FIGURE 2.

    MRI and MA1 parametric PET images of 44-y-old healthy man injected with 738 MBq of 11C-NOP-1A: MRI anatomic images (A) and MA1 parametric images (B) in axial (left), sagittal (middle), and coronal (right) views. Each pixel value represents VT and is indicated in VT color scale on right.
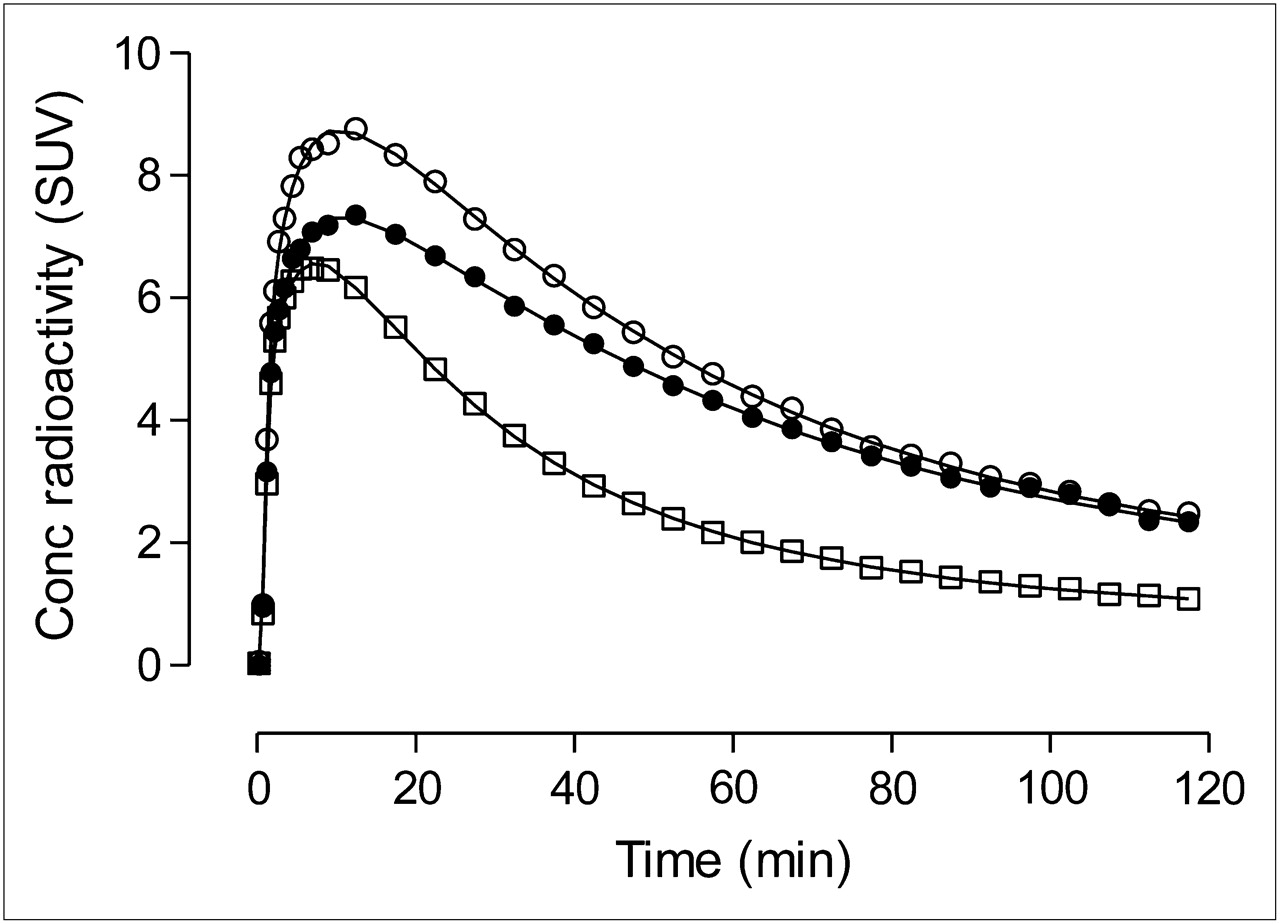
  • FIGURE 3.
    • Download figure
    • Open in new tab
    • Download powerpoint
    FIGURE 3.

    Representative brain uptake with compartmental fitting from 40-y-old healthy man injected with 755 MBq of 11C-NOP-1A. Concentration of radioactivity from 3 regions is shown: putamen (○), with highest uptake; cingulate cortex (•), with medium uptake; and cerebellum (□), with lowest uptake. Line represents unconstrained 2-tissue-compartment fitting.

  • FIGURE 4.
    • Download figure
    • Open in new tab
    • Download powerpoint
    FIGURE 4.

    Comparison of total VT in various brain regions. VT values were calculated in 7 subjects injected with 11C-NOP-1A using unconstrained 2-tissue-compartment model for VOI data and Logan and MA1 methods for voxel data (Loganvoxel and MA1voxel). (A) Mean VT values obtained by both MA1voxel (hatched bars) and Loganvoxel (white bars) were significantly lower than those obtained by 2-tissue-compartment model (black bars) (P < 0.05 by factorial repeated-measures ANOVA). Loganvoxel gave significantly smaller VT values than MA1voxel (P < 0.05). Data represent mean ± SD of all 7 subjects. (B) Scatterplot comparing mean VT values from each region (excluding cerebellum) by MA1voxel method vs. 2-tissue-compartment model in 40-y-old healthy man injected with 755 MBq of 11C-NOP-1A. Simple linear regression was significant (Pearson R2 = 0.95, P < 0.0001), with linear regression line equation y = 1.05x + 0.1. Solid line represents line of best fit. Dashed lines are 95% confidence intervals. FC = frontal cortex; PA = parietal cortex; OC = occipital cortex; TC = temporal cortex; MT = medial temporal cortex; CC = cingulate cortex; CA = caudate cortex; PU = putamen; TH = thalamus; CE = cerebellum.

  • FIGURE 5.
    • Download figure
    • Open in new tab
    • Download powerpoint
    FIGURE 5.

    Whole-body images of healthy 22-y-old man show distribution of radioactivity at about 6, 50, and 102 min after injection of 480 MBq of 11C-NOP-1A. In addition to high uptake in brain, image at 6 min shows high uptake in lungs and heart. Images at 50 and 102 min show excretion of radioactivity via liver, small bowel, and urinary bladder. These images were created by summing all coronal slices at each time point. Pixel values were decay-corrected to time of injection and displayed with same gray scale.
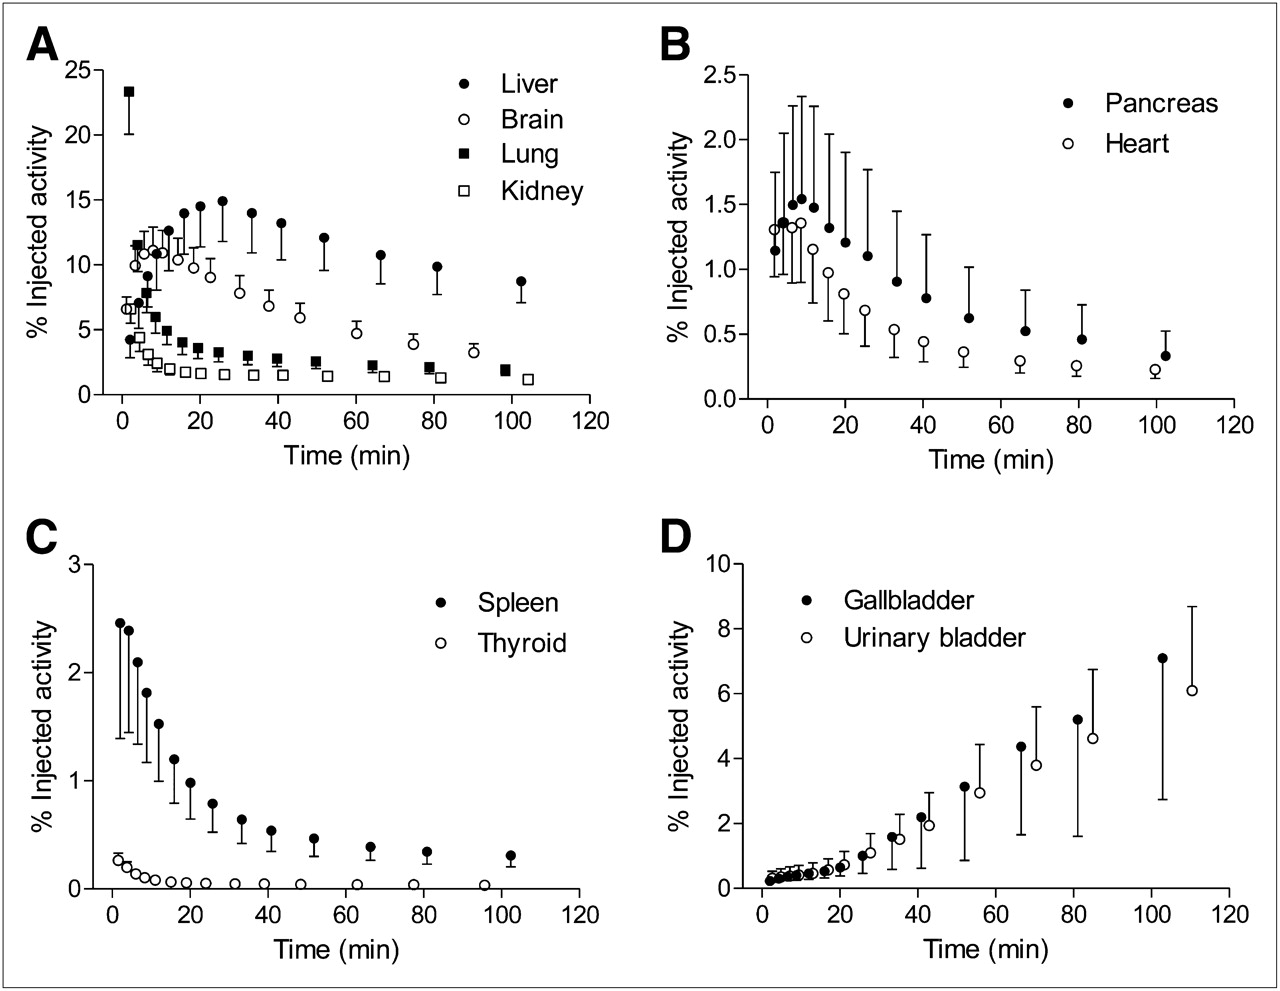
  • FIGURE 6.
    • Download figure
    • Open in new tab
    • Download powerpoint
    FIGURE 6.

    Time–activity curves for 10 source organs after 11C-NOP-1A injection. Data are corrected for radioactive decay and expressed as mean and SD (symbol and error bars) from 9 subjects.

Tables

  • Figures
  • Additional Files
    • View popup
    TABLE 1

    Regional VT of 11C-NOP-1A in Human Brain Determined from Large VOIs or from Individual Voxels

    VT (mL cm−3)
    VOIVoxel
    Brain regionTwo-tissueLoganVOIMA1VOILoganvoxelMA1voxel
    Temporal cortex10.1 ± 1.69.6 ± 1.69.5 ± 1.58.9 ± 1.79.4 ± 1.8
    Cingulate cortex9.4 ± 1.58.9 ± 1.58.9 ± 1.58.3 ± 1.58.8 ± 1.6
    Putamen10.0 ± 1.89.5 ± 1.79.4 ± 1.78.9 ± 1.79.3 ± 1.8
    Thalamus9.0 ± 1.68.5 ± 1.58.5 ± 1.58.0 ± 1.68.5 ± 1.6
    Cerebellum5.6 ± 0.85.2 ± 0.85.3 ± 0.84.8 ± 1.05.1 ± 1.0
    • Values are mean ± SD from 7 humans using 120 min of brain and plasma data. Two-tissue-compartment model was fit with no constraints. Subscript “VOI” denotes that concentration of radioactivity from large VOIs (e.g., entire temporal cortex of 251 cm3) was analyzed. Subscript “voxel” denotes that concentration of radioactivity of individual voxel (8 mm3) was analyzed. Voxels of resulting parametric image have values equal to VT.

Additional Files

  • Figures
  • Tables
  • Supplemental Data

    Files in this Data Supplement:

    • Supplemental Data
PreviousNext
Back to top

In this issue

Journal of Nuclear Medicine: 53 (3)
Journal of Nuclear Medicine
Vol. 53, Issue 3
March 1, 2012
  • Table of Contents
  • Table of Contents (PDF)
  • About the Cover
  • Index by author
Print
Download PDF
Article Alerts
Sign In to Email Alerts with your Email Address
Email Article

Thank you for your interest in spreading the word on Journal of Nuclear Medicine.

NOTE: We only request your email address so that the person you are recommending the page to knows that you wanted them to see it, and that it is not junk mail. We do not capture any email address.

Enter multiple addresses on separate lines or separate them with commas.
Brain and Whole-Body Imaging of Nociceptin/Orphanin FQ Peptide Receptor in Humans Using the PET Ligand 11C-NOP-1A
(Your Name) has sent you a message from Journal of Nuclear Medicine
(Your Name) thought you would like to see the Journal of Nuclear Medicine web site.
Citation Tools
Brain and Whole-Body Imaging of Nociceptin/Orphanin FQ Peptide Receptor in Humans Using the PET Ligand 11C-NOP-1A
Talakad G. Lohith, Sami S. Zoghbi, Cheryl L. Morse, Maria F. Araneta, Vanessa N. Barth, Nancy A. Goebl, Johannes T. Tauscher, Victor W. Pike, Robert B. Innis, Masahiro Fujita
Journal of Nuclear Medicine Mar 2012, 53 (3) 385-392; DOI: 10.2967/jnumed.111.097162

Citation Manager Formats

  • BibTeX
  • Bookends
  • EasyBib
  • EndNote (tagged)
  • EndNote 8 (xml)
  • Medlars
  • Mendeley
  • Papers
  • RefWorks Tagged
  • Ref Manager
  • RIS
  • Zotero
Share
Brain and Whole-Body Imaging of Nociceptin/Orphanin FQ Peptide Receptor in Humans Using the PET Ligand 11C-NOP-1A
Talakad G. Lohith, Sami S. Zoghbi, Cheryl L. Morse, Maria F. Araneta, Vanessa N. Barth, Nancy A. Goebl, Johannes T. Tauscher, Victor W. Pike, Robert B. Innis, Masahiro Fujita
Journal of Nuclear Medicine Mar 2012, 53 (3) 385-392; DOI: 10.2967/jnumed.111.097162
Twitter logo Facebook logo LinkedIn logo Mendeley logo
  • Tweet Widget
  • Facebook Like
  • Google Plus One
Bookmark this article

Jump to section

  • Article
    • Abstract
    • MATERIALS AND METHODS
    • RESULTS
    • DISCUSSION
    • CONCLUSION
    • DISCLOSURE STATEMENT
    • Acknowledgments
    • Footnotes
    • REFERENCES
  • Figures & Data
  • Supplemental
  • Info & Metrics
  • PDF

Related Articles

  • This Month in JNM
  • PubMed
  • Google Scholar

Cited By...

  • PET Imaging of Phosphodiesterase-4 Identifies Affected Dysplastic Bone in McCune-Albright Syndrome, a Genetic Mosaic Disorder
  • Buprenorphine exposure alters the development and migration of interneurons in the cortex
  • Head-to-Head Comparison of 11C-PBR28 and 18F-GE180 for Quantification of the Translocator Protein in the Human Brain
  • Occupancy of Nociceptin/Orphanin FQ Peptide Receptors by the Antagonist LY2940094 in Rats and Healthy Human Subjects
  • Google Scholar

More in this TOC Section

  • Cardiac Presynaptic Sympathetic Nervous Function Evaluated by Cardiac PET in Patients with Chronotropic Incompetence Without Heart Failure
  • Validation and Evaluation of a Vendor-Provided Head Motion Correction Algorithm on the uMI Panorama PET/CT System
  • Prognostic Role of 68Ga-PSMA11 PET–Based Response in Patients with Prostate Cancer Undergoing Taxane-Based Chemotherapy
Show more Clinical Investigations

Similar Articles

SNMMI

© 2025 SNMMI

Powered by HighWire