


Article Figures & Data
Figures
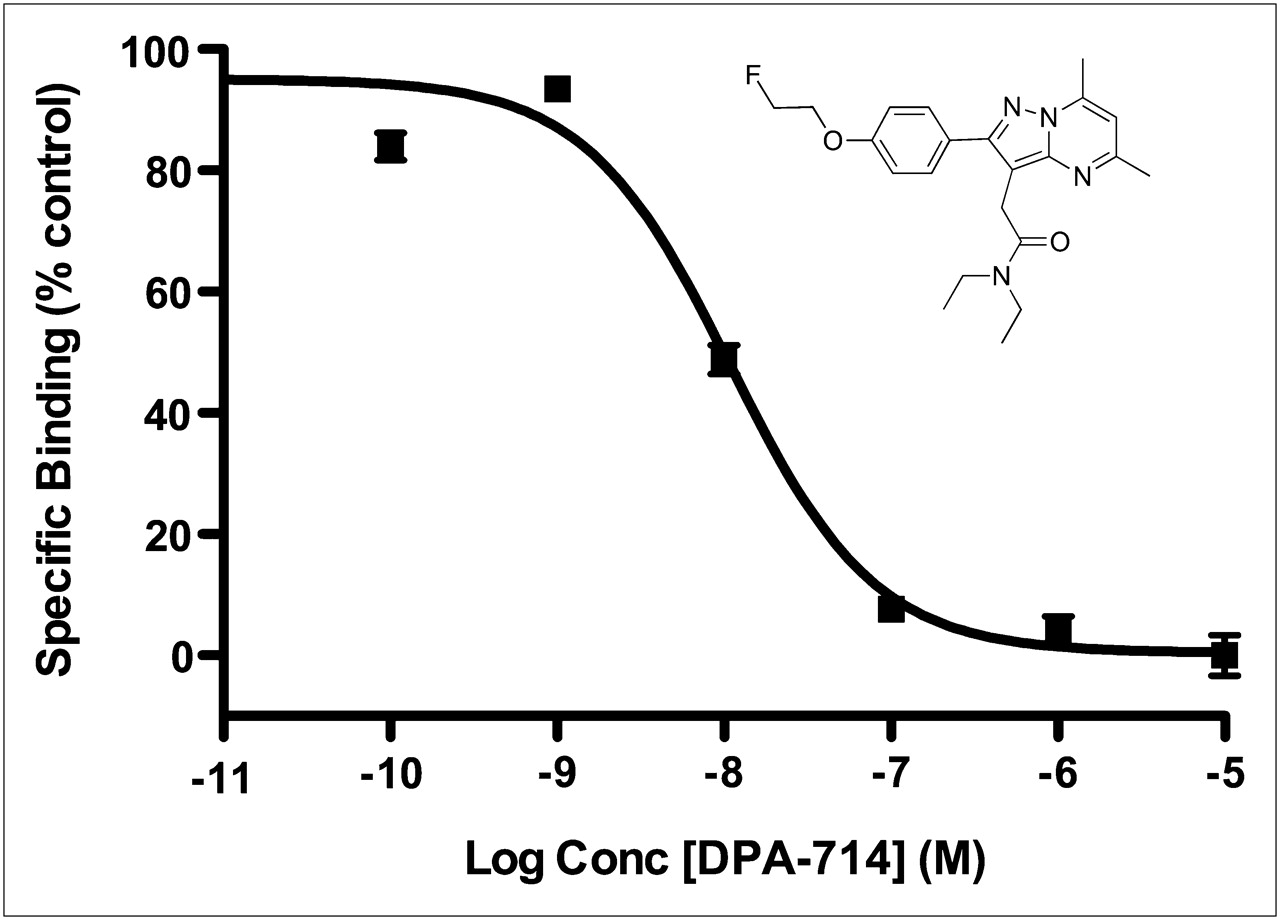
- FIGURE 1.
Chemical structure of DPA-714 (inset). Radioligand displacement of 3H-PK 11195 using DPA-714 in C6 glioma cell lysate (inhibitory concentration of 50%, 10.9 nM). conc = concentration.
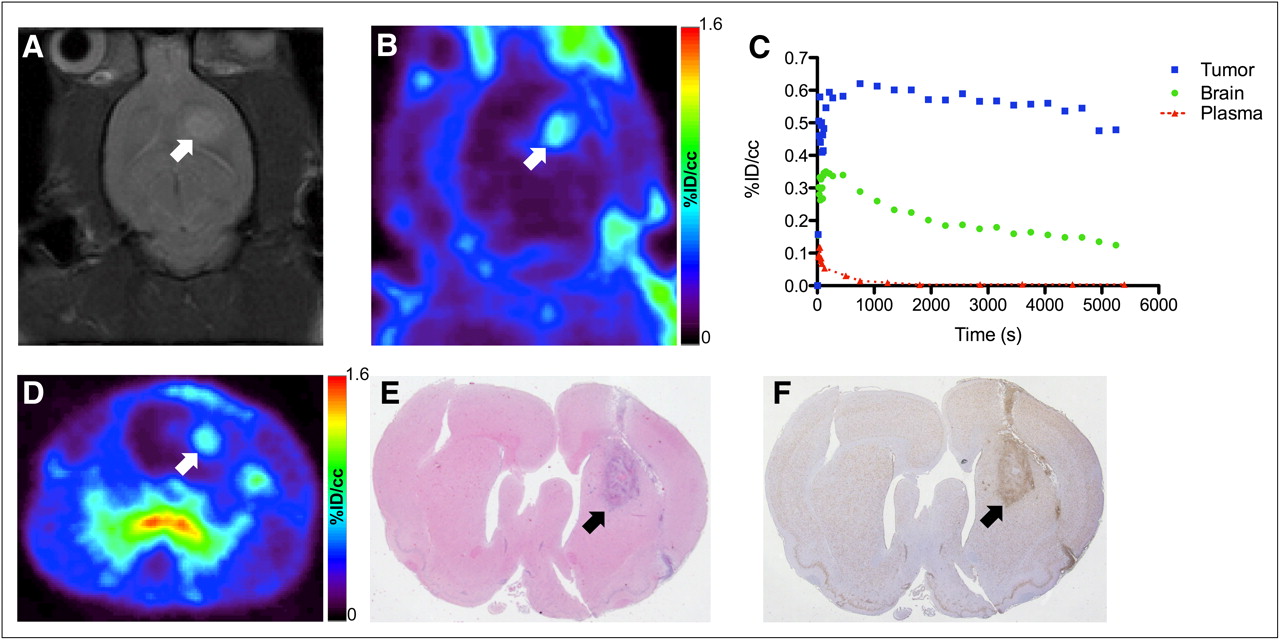
- FIGURE 2.
(A) T2-weighted MR image of C6 glioma–bearing rat in right brain hemisphere. (B) Coronal PET image obtained from dynamic scan of 18F-DPA-714 PET (summed dynamic scan, 0–90 min). (C) 18F-DPA-714 time–activity curves for tumor (blue), contralateral brain (green), and plasma (red). (D) Transverse PET image obtained from dynamic scan of 18F-DPA-714 PET (summed dynamic scan, 0–90 min). (E) Standard hematoxylin and eosin staining of serial tissue section. (F) Immunohistochemistry analysis of TSPO expression in typical C6 glioma. Tumor location is indicated with arrows in images. %ID/cc = percentage injected dose per cubic centimeter.
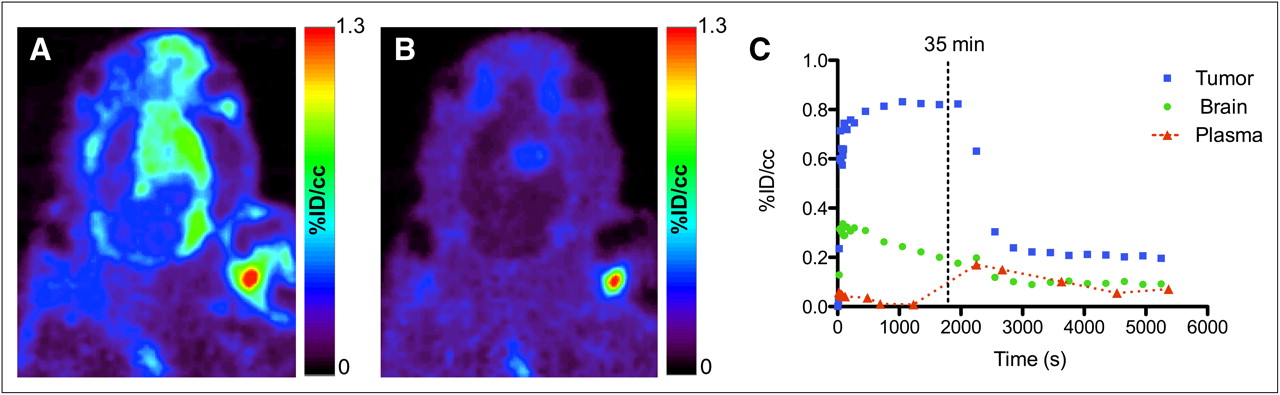
- FIGURE 3.
In vivo displacement of 18F-DPA-714 in C6 glioma–bearing rat. Relative 18F-DPA-714 uptake before (A) and after (B) intravenous infusion of excess of DPA-714. (C) 18F-DPA-714 time–activity curves generated for tumor (blue), contralateral brain (green), and plasma (red). %ID/cc = percentage injected dose per cubic centimeter.
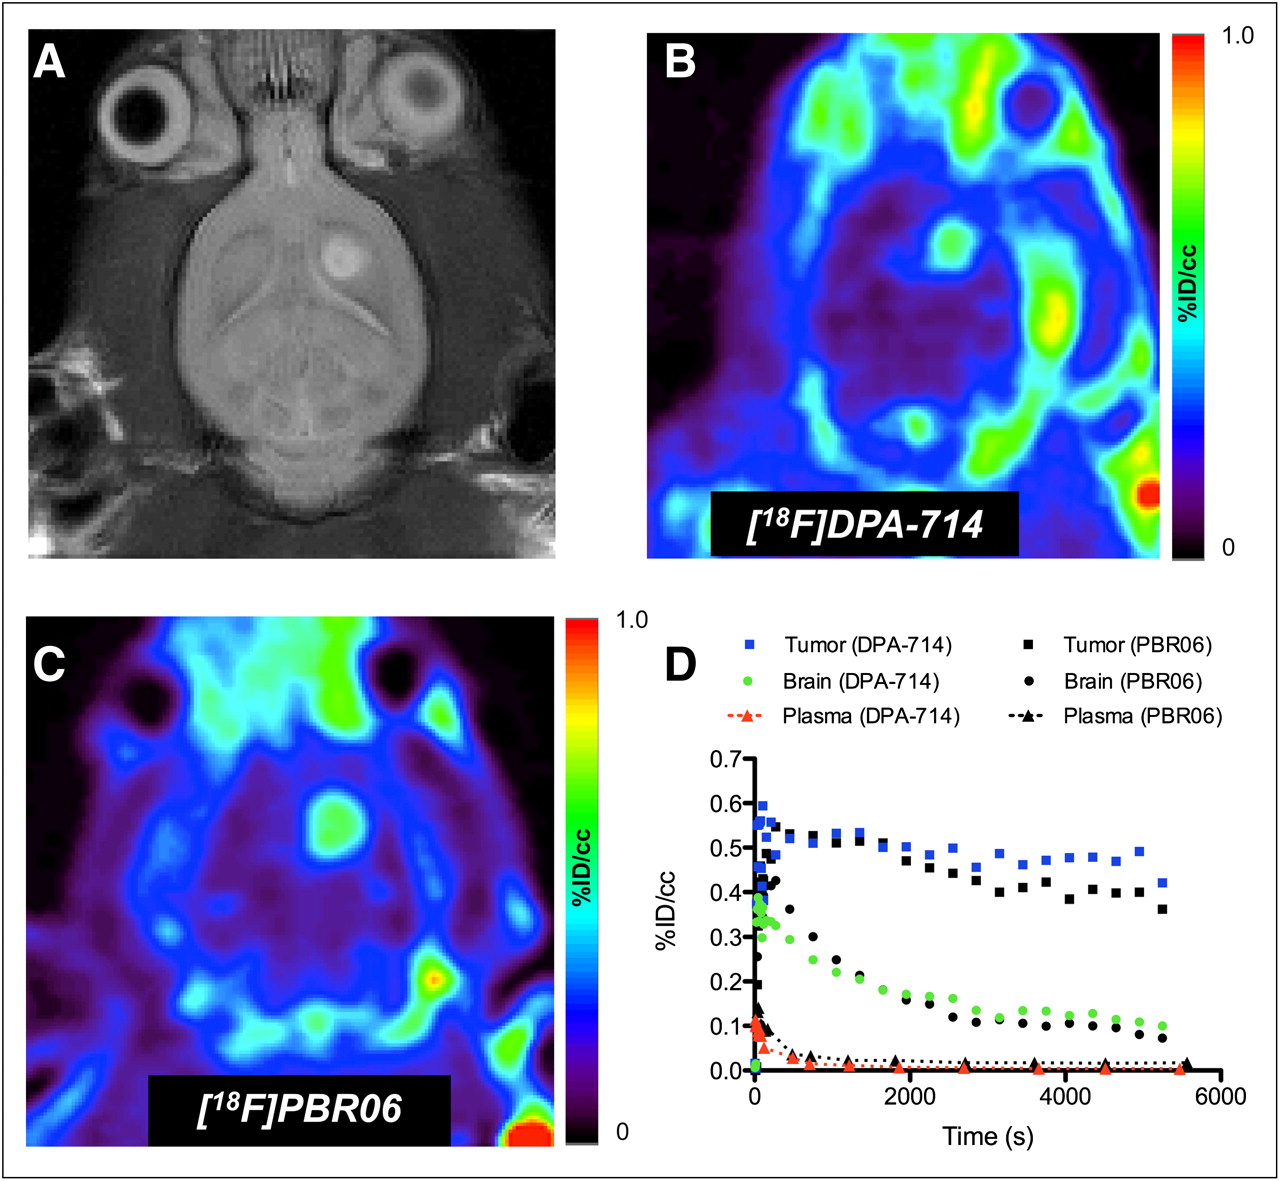
- FIGURE 4.
Comparison of 18F-PBR06 and 18F-DPA-714 in same glioma-bearing rat. (A) T2-weighted MR image of rat bearing C6 glioma in right hemisphere. (B) 18F-DPA-714 PET image (summed dynamic scan over last 30 min). (C) 18F-PBR06 PET image (summed dynamic scan over last 30 min). (D) 18F-DPA-714 time–activity curves generated for tumor (blue), contralateral brain (green), and plasma (red). For comparison, 18F-PBR06 time–activity curves are shown in black. %ID/cc = percentage injected dose per cubic centimeter.
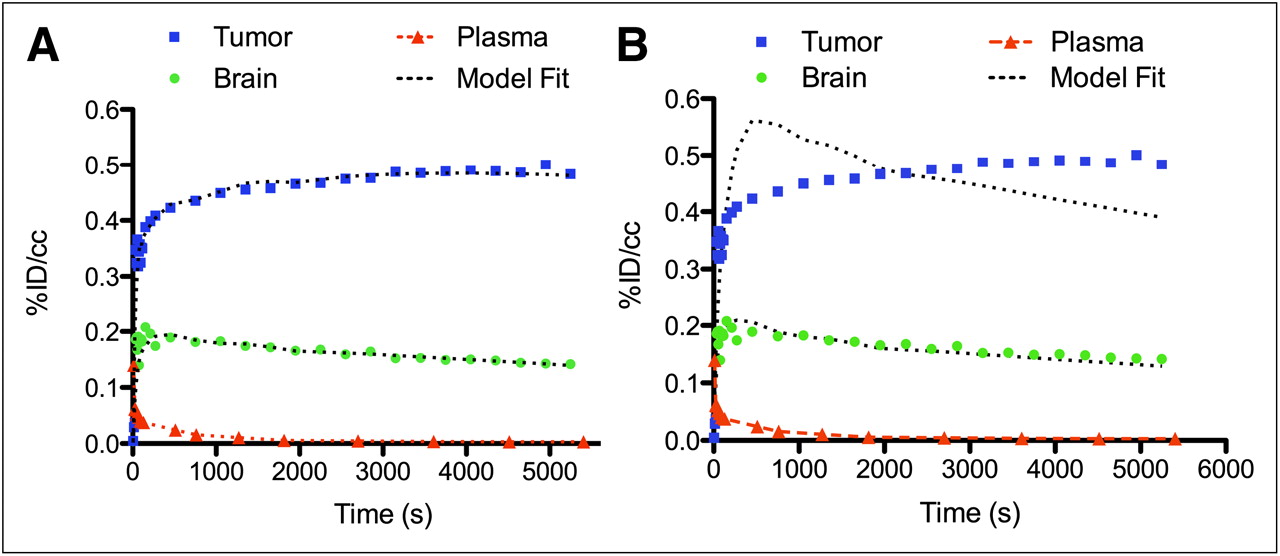
- FIGURE 5.
Pharmacokinetic model fit of typical 18F-DPA-714 time–activity curves to 3-compartment, 4-kinetic-parameter (A) and 2-compartment, 2-kinetic-parameter (B) models. Time–activity curves for tumor (blue), contralateral brain (green), and plasma (red) are shown with associated model fit. %ID/cc = percentage injected dose per cubic centimeter.
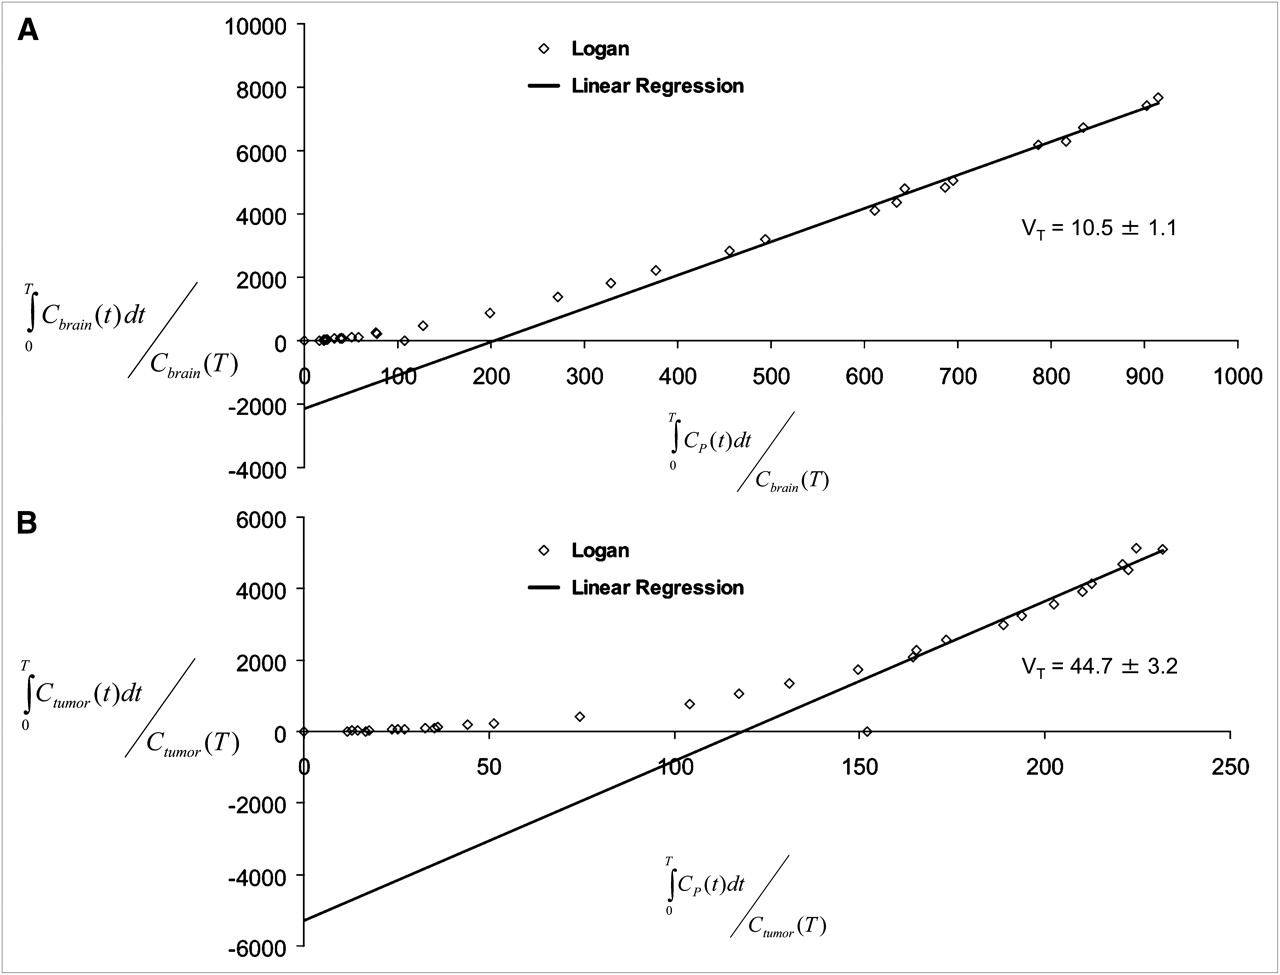
- FIGURE 6.
Representative graphical analysis of VT for a subject from this investigation. Fit was performed for normal brain (A) and for tumor (B). Solid gray line = linear regression (start time for linear regression, “t*”).


Tables
Time after injection (min) Percentage 18F-DPA-714 Percentage 18F-fluoride Percentage metabolite 2 (n = 7) 95 ± 6.0 2 ± 3.3 3 ± 3.7 12 (n = 7) 68 ± 7.4 13 ± 6.7 19 ± 5.8 30 (n = 7) 44 ± 8.9 37 ± 5.4 19 ± 8.8 60 (n = 7) 27 ± 6.2 50 ± 15.0 23 ± 7.3 90 (n = 5) 22 ± 17.8 64 ± 12.1 14 ± 3.8 Data are mean ± SD.
Supplemental Data
Files in this Data Supplement:


Jump to section
Related Articles
Cited By...
- TSPO-targeted PET and Optical Probes for the Detection and Localization of Premalignant and Malignant Pancreatic Lesions
- Combined PET Imaging of the Inflammatory Tumor Microenvironment Identifies Margins of Unique Radiotracer Uptake
- Imaging Microglial Activation with TSPO PET: Lighting Up Neurologic Diseases?
- TSPO as a target for glioblastoma therapeutics
- The 18-kDa Mitochondrial Translocator Protein in Human Gliomas: An 11C-(R)PK11195 PET Imaging and Neuropathology Study
- Glial Activation in the Early Stages of Brain Metastasis: TSPO as a Diagnostic Biomarker
- The Translocator Protein Radioligand 18F-DPA-714 Monitors Antitumor Effect of Erufosine in a Rat 9L Intracranial Glioma Model