
Main menu

  • Home
  • Content
    • Current
    • Ahead of print
    • Past Issues
    • JNM Supplement
    • SNMMI Annual Meeting Abstracts
    • Continuing Education
    • JNM Podcasts
  • Subscriptions
    • Subscribers
    • Institutional and Non-member
    • Rates
    • Journal Claims
    • Corporate & Special Sales
  • Authors
    • Submit to JNM
    • Information for Authors
    • Assignment of Copyright
    • AQARA requirements
  • Info
    • Reviewers
    • Permissions
    • Advertisers
  • About
    • About Us
    • Editorial Board
    • Contact Information
  • More
    • Alerts
    • Feedback
    • Help
    • SNMMI Journals
  • SNMMI
    • JNM
    • JNMT
    • SNMMI Journals
    • SNMMI

User menu

  • Subscribe
  • My alerts
  • Log in
  • My Cart

Search

  • Advanced search
Journal of Nuclear Medicine
  • SNMMI
    • JNM
    • JNMT
    • SNMMI Journals
    • SNMMI
  • Subscribe
  • My alerts
  • Log in
  • My Cart
Journal of Nuclear Medicine

Advanced Search

  • Home
  • Content
    • Current
    • Ahead of print
    • Past Issues
    • JNM Supplement
    • SNMMI Annual Meeting Abstracts
    • Continuing Education
    • JNM Podcasts
  • Subscriptions
    • Subscribers
    • Institutional and Non-member
    • Rates
    • Journal Claims
    • Corporate & Special Sales
  • Authors
    • Submit to JNM
    • Information for Authors
    • Assignment of Copyright
    • AQARA requirements
  • Info
    • Reviewers
    • Permissions
    • Advertisers
  • About
    • About Us
    • Editorial Board
    • Contact Information
  • More
    • Alerts
    • Feedback
    • Help
    • SNMMI Journals
  • View or Listen to JNM Podcast
  • Visit JNM on Facebook
  • Join JNM on LinkedIn
  • Follow JNM on Twitter
  • Subscribe to our RSS feeds
Research ArticleClinical Investigations

Comparison of Clinical Tools for Measurements of Regional Stress and Rest Myocardial Blood Flow Assessed with 13N-Ammonia PET/CT

Piotr J. Slomka, Erick Alexanderson, Rodrigo Jácome, Moises Jiménez, Edgar Romero, Aloha Meave, Ludovic Le Meunier, Magnus Dalhbom, Daniel S. Berman, Guido Germano and Heinrich Schelbert
Journal of Nuclear Medicine February 2012, 53 (2) 171-181; DOI: https://doi.org/10.2967/jnumed.111.095398
Piotr J. Slomka
  • Find this author on Google Scholar
  • Find this author on PubMed
  • Search for this author on this site
Erick Alexanderson
  • Find this author on Google Scholar
  • Find this author on PubMed
  • Search for this author on this site
Rodrigo Jácome
  • Find this author on Google Scholar
  • Find this author on PubMed
  • Search for this author on this site
Moises Jiménez
  • Find this author on Google Scholar
  • Find this author on PubMed
  • Search for this author on this site
Edgar Romero
  • Find this author on Google Scholar
  • Find this author on PubMed
  • Search for this author on this site
Aloha Meave
  • Find this author on Google Scholar
  • Find this author on PubMed
  • Search for this author on this site
Ludovic Le Meunier
  • Find this author on Google Scholar
  • Find this author on PubMed
  • Search for this author on this site
Magnus Dalhbom
  • Find this author on Google Scholar
  • Find this author on PubMed
  • Search for this author on this site
Daniel S. Berman
  • Find this author on Google Scholar
  • Find this author on PubMed
  • Search for this author on this site
Guido Germano
  • Find this author on Google Scholar
  • Find this author on PubMed
  • Search for this author on this site
Heinrich Schelbert
  • Find this author on Google Scholar
  • Find this author on PubMed
  • Search for this author on this site
  • Article
  • Figures & Data
  • Info & Metrics
  • PDF
Loading

Article Figures & Data

Figures

  • Tables
  • FIGURE 1.
    • Download figure
    • Open in new tab
    • Download powerpoint
    FIGURE 1.

    Linear regression (left) and Bland–Altman (right) plots for QPET vs. syngo MBF, QPET vs. PMOD, and syngo MBF vs. QPET for flow values combining stress and rest values (n = 66). C = QPET; P = PMOD; S = syngo MBF.
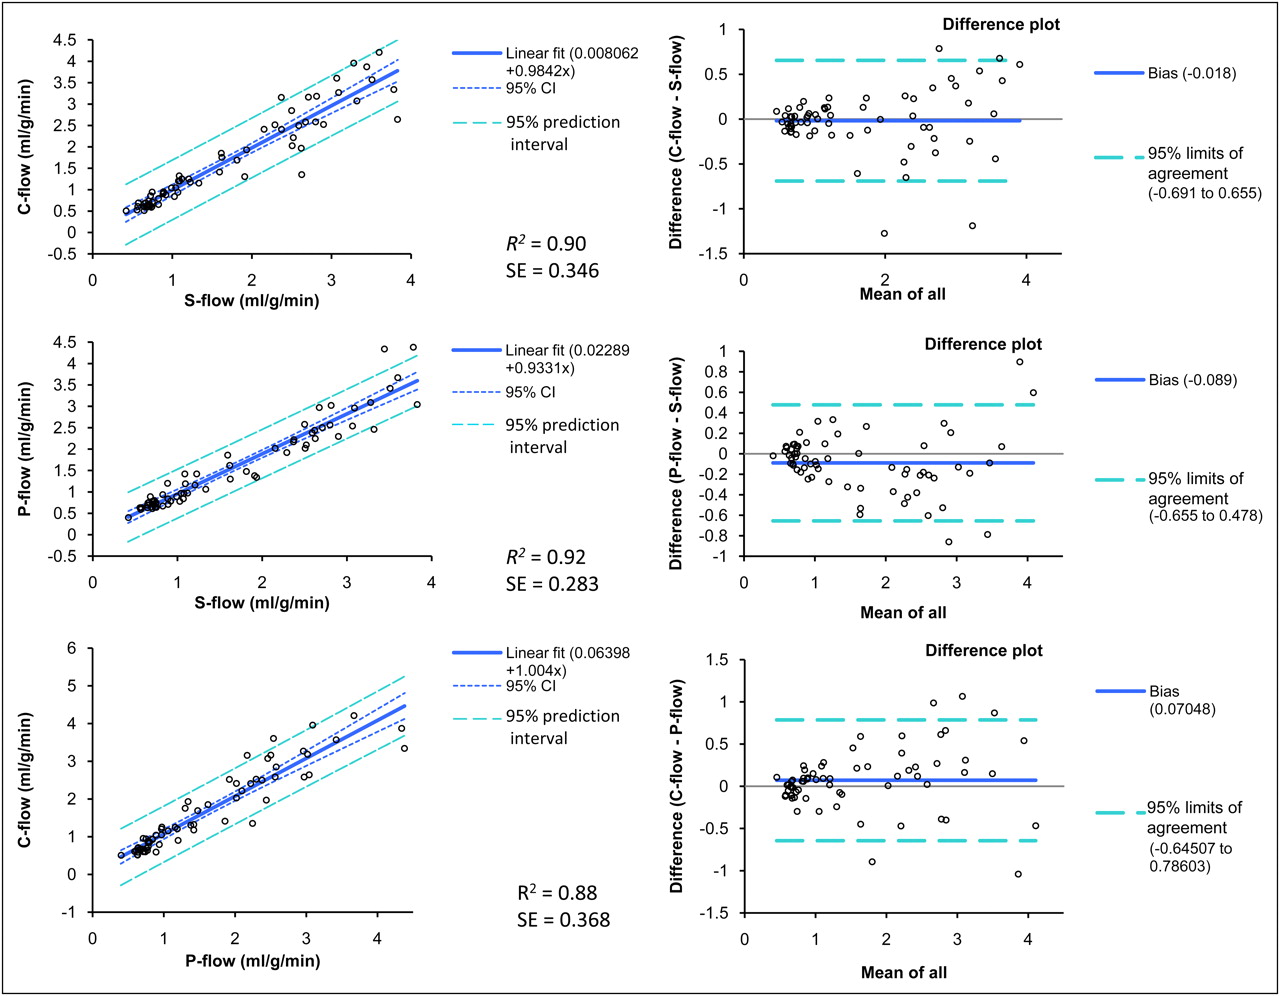
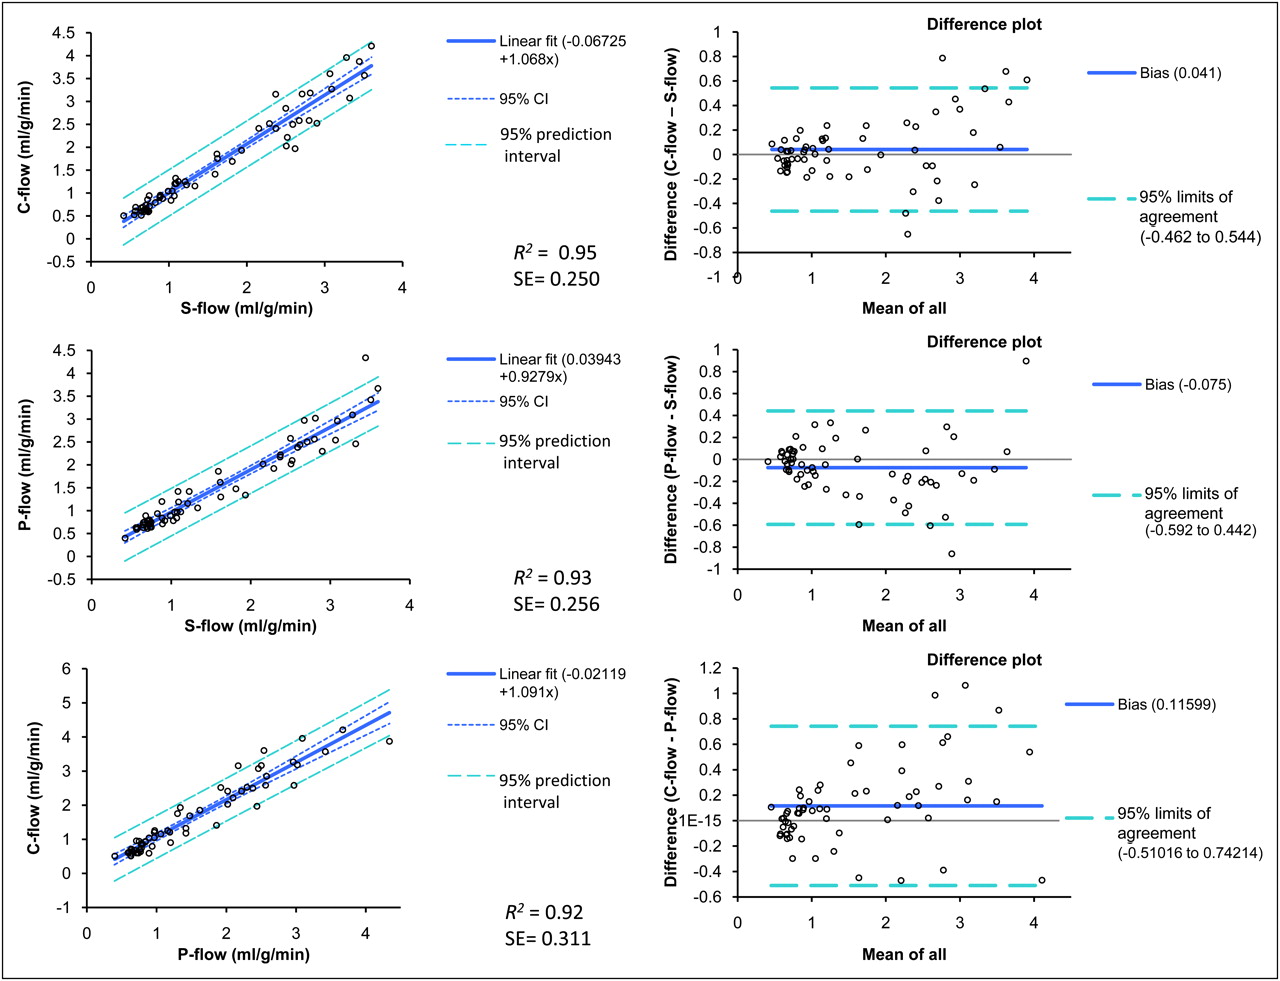
  • FIGURE 2.
    • Download figure
    • Open in new tab
    • Download powerpoint
    FIGURE 2.

    Linear regression (left) and Bland–Altman (right) plots for QPET vs. syngo MBF, QPET vs. PMOD, and syngo MBF vs. QPET for flow values combining stress and rest values (n = 61) after excluding 5 cases with high spillover fraction (>0.65) (n = 61). C = QPET; P = PMOD; S = syngo MBF.
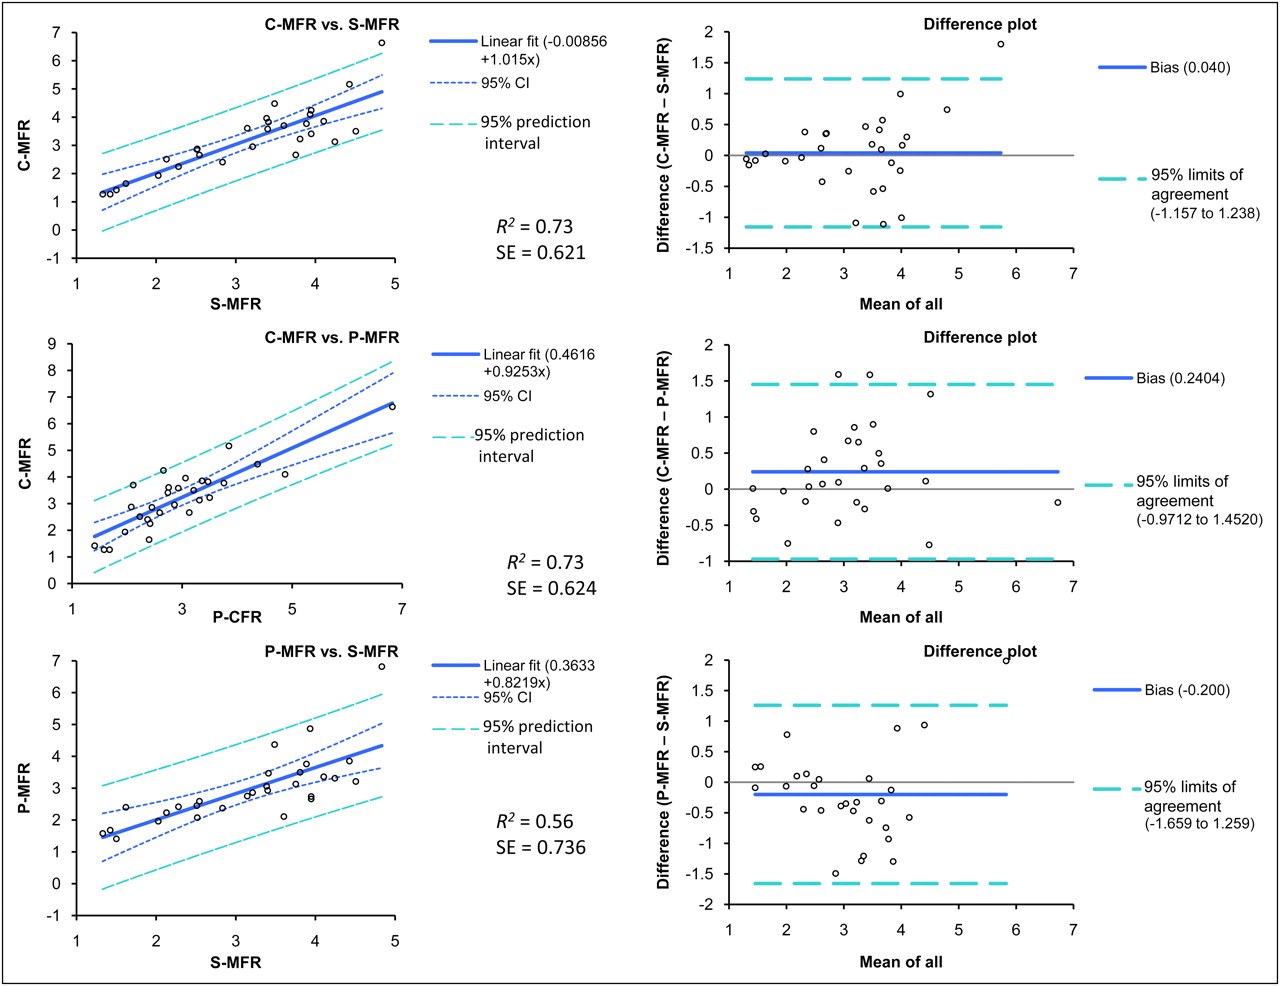
  • FIGURE 3.
    • Download figure
    • Open in new tab
    • Download powerpoint
    FIGURE 3.

    MFR. Linear regression (left) and Bland–Altman (right) plots for QPET vs. syngo MBF, QPET vs. PMOD, and PMOD vs. syngo MBF (n = 29). C = QPET; P = PMOD; S = syngo MBF.
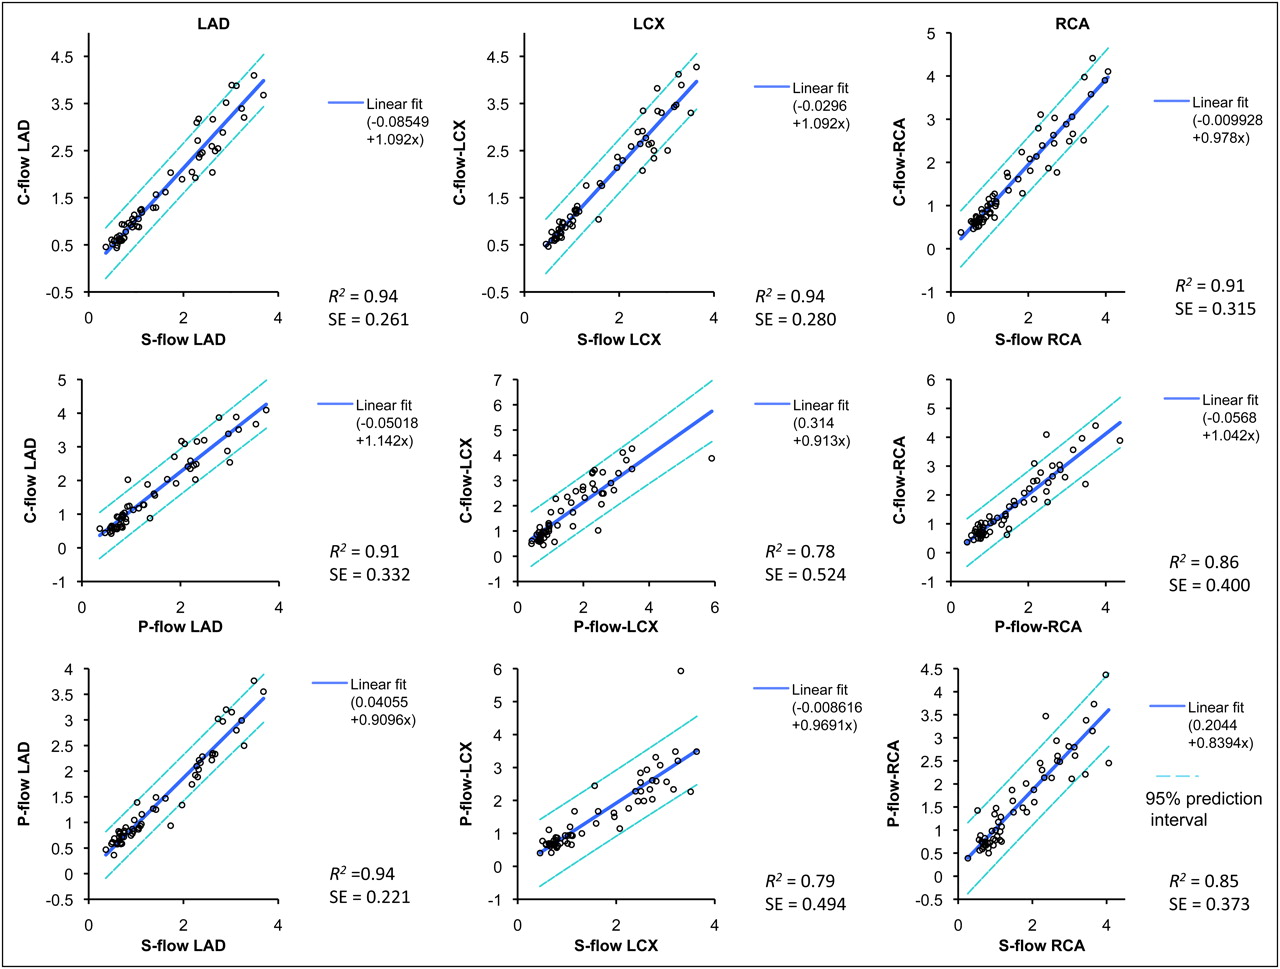
  • FIGURE 4.
    • Download figure
    • Open in new tab
    • Download powerpoint
    FIGURE 4.

    Regional flow regression plots among the 3 methods (n = 61). All flow values are reported in mL/g/min. C = QPET; P = PMOD; S = syngo MBF.
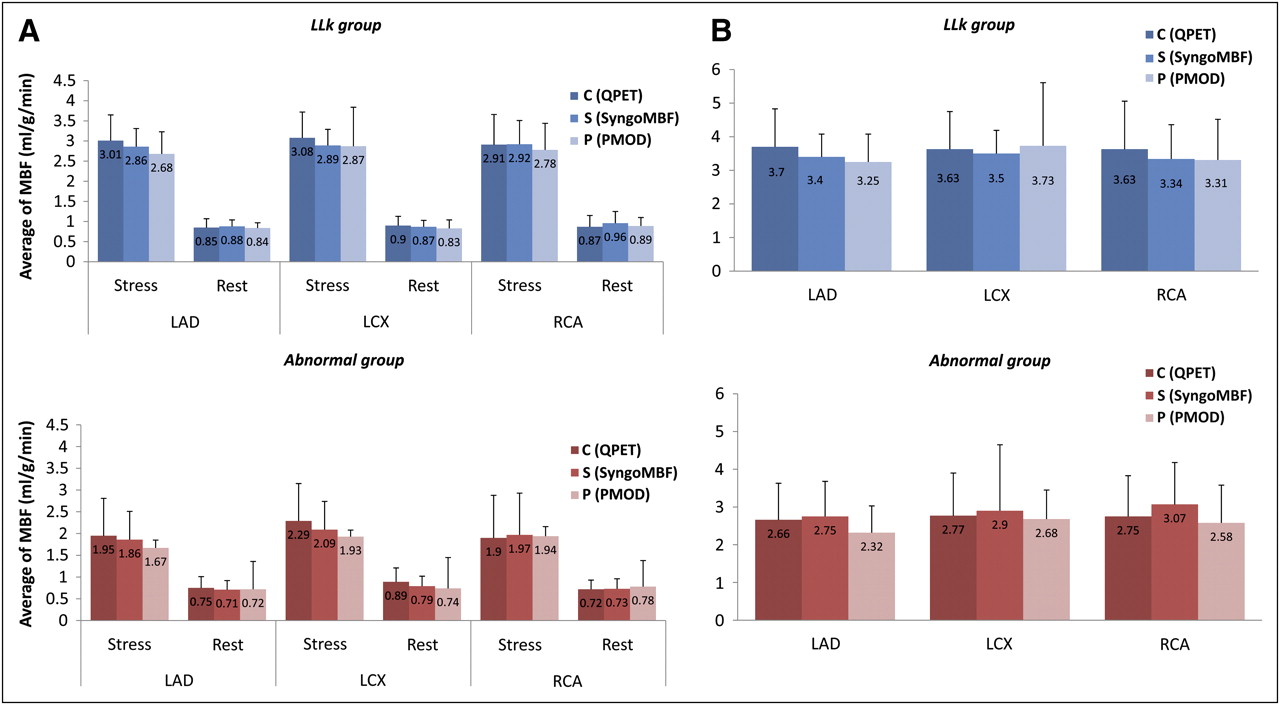
  • FIGURE 5.
    • Download figure
    • Open in new tab
    • Download powerpoint
    FIGURE 5.

    Mean regional stress and rest flow MBF (A) and MFR (B) results obtained in very low likelihood and ischemic patient groups by the 3 methods. None of the results were significantly different from one another (1-way ANOVA of repeated measures) in either very low likelihood or ischemic group.
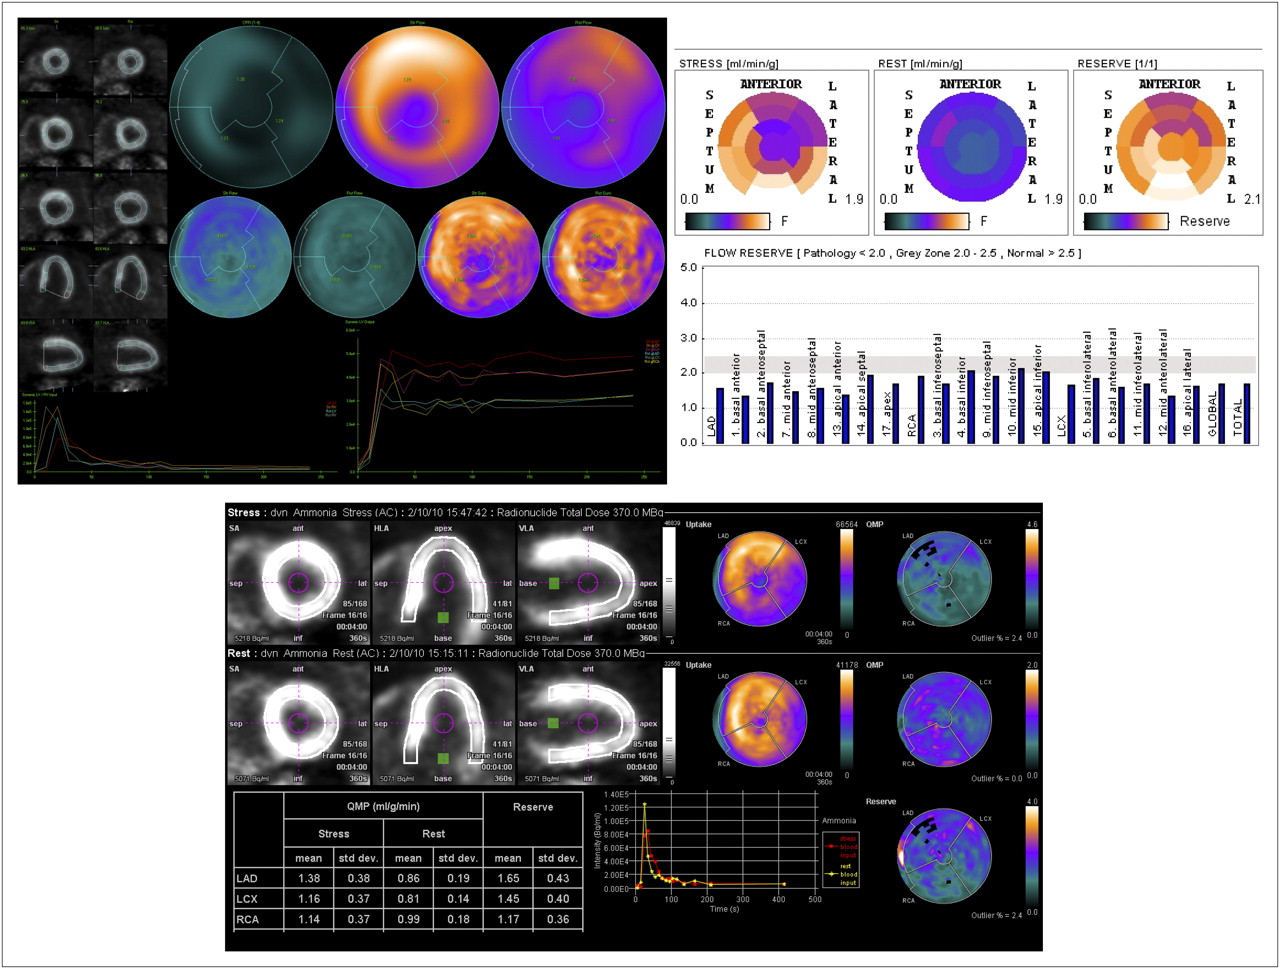
  • FIGURE 6.
    • Download figure
    • Open in new tab
    • Download powerpoint
    FIGURE 6.

    Example output generated by QPET (top left), PMOD (top right), and syngo MBF (bottom) in 65-y-old man. All 3 methods demonstrated abnormal MFR (QPET: stress flow = 1.20 mL/g/s, rest flow = 0.96 mL/g/s, MFR = 1.29; syngo MBF: stress flow = 1.23 mL/g/min, rest flow = 0.89 mL/g/min, MFR = 1.42; PMOD: stress flow = 1.42 mL/g/min, rest flow = 0.84 mL/g/min, MFR = 1.68).

Tables

  • Figures
    • View popup
    TABLE 1

    Patient Characteristics (n = 33)

    CharacteristicValue
    Men (n)22 (66%)
    Mean age ± SD (y)54.6 ± 14.6
    Mean body mass index ± SD26.4 ± 4.0
    Patients with diabetes (n)5
    Patients with hypertension (n)16
    Patients with dyslipidemia (n)18
    Smokers (n)14
    Patients with a family history (n)13
    Patients with myocardial infarction (n)9
    Very low likelihood patients (n)18
    • View popup
    TABLE 2

    Hemodynamics in Patients

    CharacteristicValue
    Rest
     Heart rate (beats/min)67.2 ± 11.0
     Systolic blood pressure (mm Hg)124.0 ± 14.9
     RPP (beats/min · mm Hg)8,405.6 ± 2,095.9
    Stress
     Heart rate (beats/min)78.9 ± 18.1
     Systolic blood pressure (mm Hg)124.2 ± 18.1
     RPP (beats/min · mm Hg)9,790.7 ± 2,679.9
    • RPP = rate–pressure product.

    • View popup
    TABLE 3

    Regression R2 and SE Among the 3 Methods When Cases with High Spillover Fraction Are Excluded

    R2SE
    Spillover fraction thresholdNQPET vs. syngo MBFQPET vs. PMODQPET vs. syngo MBFQPET vs. PMOD
    All660.900.880.3460.368
    <0.70640.920.910.3070.319
    <0.65610.950.920.2500.311
    <0.60560.960.920.2220.305
    <0.5430.950.930.2300.274
    • N = number of cases with spillover fraction below the given threshold.

    • View popup
    TABLE 4

    Mean Absolute Differences (±SD) Between Measurements Obtained by the 3 Methods

    ComparisonRest flow (mL/g/min)Stress flow (mL/g/min)MFR
    QPET vs. syngo MBF0.09 ± 0.060.28 ± 0.220.44 ± 0.42
    PMOD vs. syngo MBF0.11 ± 0.080.30 ± 0.220.58 ± 0.50
    QPET vs. PMOD0.11 ± 0.080.39 ± 0.270.49 ± 0.44
    • View popup
    TABLE 5

    R2, SE, Interobserver Reproducibility, and 95% Confidence Interval (CI) for the 3 Methods

    Flow (mL/g/min)MFR
    MethodR2SEBiasCIR2SEBiasCI
    QPET0.990.09−0.04−0.26, −0.190.970.20−0.06−0.43, −0.31
    Syngo MBF0.990.120.04−0.2, 0.270.910.290.19−0.38, 0.76
    PMOD0.990.100.03−0.16, 0.220.940.23−0.07−0.56, 0.42
    • View popup
    TABLE 6

    Stress and Rest Flow and MFR Results Obtained in Very Low Likelihood and Ischemic Patients by the 3 Methods

    GroupStress flow (mL/g/min)Rest flow (mL/g/min)MFR
    Very low likelihood (n = 15)
     QPET3.00 ± 0.66 (1.97–4.21)0.87 ± 0.24 (0.59–1.25)3.66 ± 1.19 (2.25–6.63)
     Syngo MBF2.89 ± 0.45 (2.29–3.60)0.90 ± 0.20 (0.68–1.33)3.41 ± 0.76 (2.13–4.83)
     PMOD2.77 ± 0.65 (1.92–4.34)0.85 ± 0.16 (0.69–1.40)3.39 ± 1.22 (2.23–6.82)
    Ischemic (n = 14)
     QPET2.04 ± 0.80 (0.90–3.60)0.78 ± 0.24 (0.51–1.32)2.71 ± 1.00 (1.27–3.76)
     Syngo MBF1.98 ± 0.66 (0.88–3.07)0.74 ± 0.21 (0.42–1.09)2.90 ± 1.17 (1.33–4.51)
     PMOD1.83 ± 0.57 (1.16–3.02)0.77 ± 0.23 (0.40–1.42)2.51 ± 0.74 (1.41–3.76)
    • Data are mean ± SD, with ranges in brackets.

PreviousNext
Back to top

In this issue

Journal of Nuclear Medicine: 53 (2)
Journal of Nuclear Medicine
Vol. 53, Issue 2
February 1, 2012
  • Table of Contents
  • Table of Contents (PDF)
  • About the Cover
  • Index by author
Print
Download PDF
Article Alerts
Sign In to Email Alerts with your Email Address
Email Article

Thank you for your interest in spreading the word on Journal of Nuclear Medicine.

NOTE: We only request your email address so that the person you are recommending the page to knows that you wanted them to see it, and that it is not junk mail. We do not capture any email address.

Enter multiple addresses on separate lines or separate them with commas.
Comparison of Clinical Tools for Measurements of Regional Stress and Rest Myocardial Blood Flow Assessed with 13N-Ammonia PET/CT
(Your Name) has sent you a message from Journal of Nuclear Medicine
(Your Name) thought you would like to see the Journal of Nuclear Medicine web site.
Citation Tools
Comparison of Clinical Tools for Measurements of Regional Stress and Rest Myocardial Blood Flow Assessed with 13N-Ammonia PET/CT
Piotr J. Slomka, Erick Alexanderson, Rodrigo Jácome, Moises Jiménez, Edgar Romero, Aloha Meave, Ludovic Le Meunier, Magnus Dalhbom, Daniel S. Berman, Guido Germano, Heinrich Schelbert
Journal of Nuclear Medicine Feb 2012, 53 (2) 171-181; DOI: 10.2967/jnumed.111.095398

Citation Manager Formats

  • BibTeX
  • Bookends
  • EasyBib
  • EndNote (tagged)
  • EndNote 8 (xml)
  • Medlars
  • Mendeley
  • Papers
  • RefWorks Tagged
  • Ref Manager
  • RIS
  • Zotero
Share
Comparison of Clinical Tools for Measurements of Regional Stress and Rest Myocardial Blood Flow Assessed with 13N-Ammonia PET/CT
Piotr J. Slomka, Erick Alexanderson, Rodrigo Jácome, Moises Jiménez, Edgar Romero, Aloha Meave, Ludovic Le Meunier, Magnus Dalhbom, Daniel S. Berman, Guido Germano, Heinrich Schelbert
Journal of Nuclear Medicine Feb 2012, 53 (2) 171-181; DOI: 10.2967/jnumed.111.095398
Twitter logo Facebook logo LinkedIn logo Mendeley logo
  • Tweet Widget
  • Facebook Like
  • Google Plus One
Bookmark this article

Jump to section

  • Article
    • Abstract
    • MATERIALS AND METHODS
    • RESULTS
    • DISCUSSION
    • CONCLUSION
    • DISCLOSURE STATEMENT
    • Acknowledgments
    • Footnotes
    • REFERENCES
  • Figures & Data
  • Info & Metrics
  • PDF

Related Articles

  • This Month in JNM
  • PubMed
  • Google Scholar

Cited By...

  • Reply: Clarifying the Utility of Myocardial Blood Flow and Myocardial Flow Reserve After Cardiac Transplantation
  • Accurate needle-free assessment of myocardial oxygenation for ischemic heart disease in canines using magnetic resonance imaging
  • Clinical Quantification of Myocardial Blood Flow Using PET: Joint Position Paper of the SNMMI Cardiovascular Council and the ASNC
  • Relationship Between Ktrans and K1 with Simultaneous Versus Separate MR/PET in Rabbits with VX2 Tumors
  • Myocardial Blood Flow and Inflammatory Cardiac Sarcoidosis
  • Integration of Quantitative Positron Emission Tomography Absolute Myocardial Blood Flow Measurements in the Clinical Management of Coronary Artery Disease
  • Relationship Between Quantitative Adverse Plaque Features From Coronary Computed Tomography Angiography and Downstream Impaired Myocardial Flow Reserve by 13N-Ammonia Positron Emission Tomography: A Pilot Study
  • Quantification of Myocardial Blood Flow in Absolute Terms Using 82Rb PET Imaging: The RUBY-10 Study
  • Multisoftware Reproducibility Study of Stress and Rest Myocardial Blood Flow Assessed with 3D Dynamic PET/CT and a 1-Tissue-Compartment Model of 82Rb Kinetics
  • Phase II Safety and Clinical Comparison With Single-Photon Emission Computed Tomography Myocardial Perfusion Imaging for Detection of Coronary Artery Disease: Flurpiridaz F 18 Positron Emission Tomography
  • Google Scholar

More in this TOC Section

  • Feasibility of Ultra-Low-Activity 18F-FDG PET/CT Imaging Using a Long–Axial-Field-of-View PET/CT System
  • Cardiac Presynaptic Sympathetic Nervous Function Evaluated by Cardiac PET in Patients with Chronotropic Incompetence Without Heart Failure
  • Validation and Evaluation of a Vendor-Provided Head Motion Correction Algorithm on the uMI Panorama PET/CT System
Show more Clinical Investigations

Similar Articles

SNMMI

© 2025 SNMMI

Powered by HighWire